How to determine if a network is saturated ; Currently the network here at work is very slow ; we would like to do my own network analysis. A switch should in theory prevent collisions (except in the event of bad cable or half-duplex connections) so if you see collisions you have other problems. These days, many switches do not have collision LEDs on the display because they are pretty much eliminated in a properly constructed network. The point of a switch is to separate traffic going from one pc (or whatever) to another and prevent it from going to all the devices on the switch . That in turn allows much more aggregate band width use than if you had a hub at the same speed. we may have a malfunctioning network device, a spanning-tree loop, switches connected to switches with spanning-tree turned on, multiple hubs connected to a single switch port, etc , we'll unplug that and see what happens or we needed restart or on - off - on again .
XXX . XXX Internet Down
Doing the same thing over and over again and expecting different results. That's insanity and observing it is usually easy.
brain ware of insanity : From the outside perspective, it's easy to say he's acting insane. we should try something else, but when you're living the insanity, this is a difficult thing to realize. After all, we're taught to get back on the horse when we fall. Nobody tells us to consider getting a bike after we get bucked off.
Insanity is easy to find when we inspect dating, but it's not the only thing driving people insane. What do you do when you have an internet problem? Reset the router, of course. If the internet comes back, that's awesome, but what do you do if you stay disconnected? Reset the router, of course. If the internet comes back, that's awesome, but what do you do if you stay disconnected? Reset the router, of course...
Network problems drive us insane, too!
It doesn't have to be that way. There's more you can do to fix connection problems. I'm not telling you to stop rebooting things altogether that's still a good first step.
What I am telling you is to is be aware of network induced insanity, and try these tests next time you find yourself slipping into the loop.
wi-fi is not connecting automatically ;
Please enable ‘Connect automatically when this network is in range’ feature in the wireless card properties.
- Click on Start button.
- In the search box type, ‘Manage Wireless Networks’ and then press enter.
- Right Click on the network you connect normally and click on Properties.
- In the Connection tab give a check on ‘Connect automatically when this network is in range’.
- Click OK.
Wireless Interference
Wireless networks are awesome, but the electromagnetic waves they rely on are more prone to interference than wired networks. Any device that emits a wireless signal can interfere with your connection. Common offenders include cordless phones, wireless speakers, microwaves, and Blu-Ray players.How to test
Connect to your network through ethernet. (You know - the cable)
What to look for
If the problem goes away after connecting through ethernet, there's a good chance something is interfering with your wireless.How to solve
- Avoid wireless networks when you can't afford disruptions (i.e. keep your computer plugged into ethernet).
- Reconnect to wireless and turn off devices that might be causing interference. Track whether anything changes after a device is powered down.
- Change the router's WiFi Channel and see how performance is effected.
Bad Hardware
It's possible for cords, modems, routers, and other network ingredients to fail and negatively affect network performance.How to test
Systematically replace different network components. If you don't have extra hardware lying around, you probably have a friend who would love to loan you something to aid your effort.
What to look for
If network performance gets better after you swap out a component, chances are whatever you replaced was broken.How to solve
- Replace the broken or poorly performing component.
- Update software if you're dealing with a router or modem.
Bandwidth Saturation
Every network has a capacity. It's called bandwidth. When network usage exceeds available bandwidth, performance gets worse.How to test
Experiment with different levels of network activity and see when the network gets worse.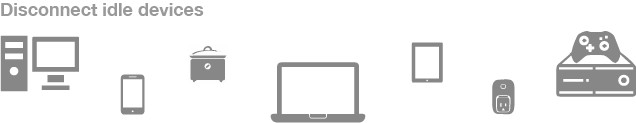
What to look for
Try to define network usage thresholds. For example, you can play a game on your computer and stream video on your Roku at the same time, but when a large file download is added to the mix the game lags, the video buffers, and the download is slow.How to solve
- Limit bandwidth usage
- Buy more bandwidth
Stepping Up Your Game
If you try these tests next time you feel yourself slipping into the router reboot cycle, you'll successfully thwart insanity. Nice work. But, if you're serious about solving your network problem, this is only the tip of the iceberg.I have not addressed two important ideas.
- Catching differences in network performance is difficult when you're only using your five senses.
- The problem could be caused by a network you don't control.
solution Switch / wireless / PING to full loaded so slowly :
Start, control panel, device manager. Click on Network and then right click on your network adapter, left click properties, power management. Uncheck the box, allow computer to turn off this device to save power.
Go to the power options, and changed the Wireless Adapter Setting, from Maximum Power Setting to Maximum Performance.

XXX . XXX 4%zero Common Network Problems
We 'll find a lineup of the most common (and sometimes uncommon) Ping Plotter results. We've assembled this list to act as a sort of "perpetrator lineup," so you can match your results against what you see here, and get more specific information about what you may be encountering.
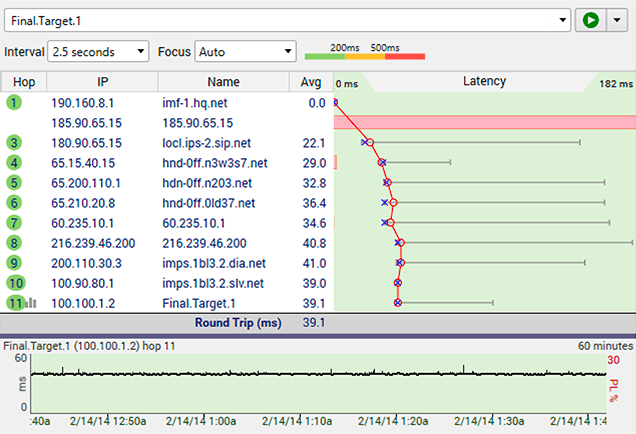
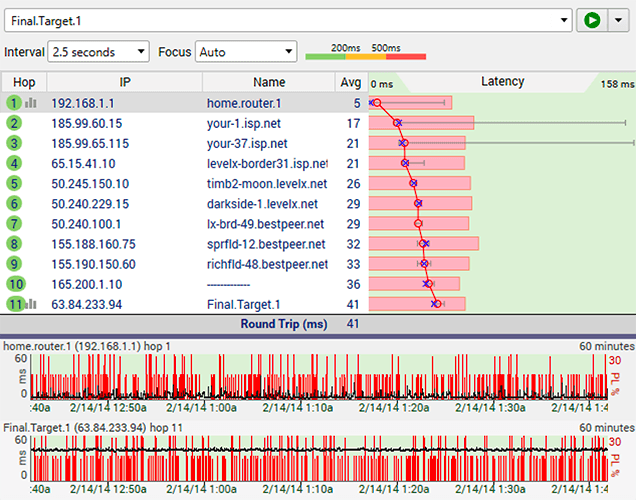
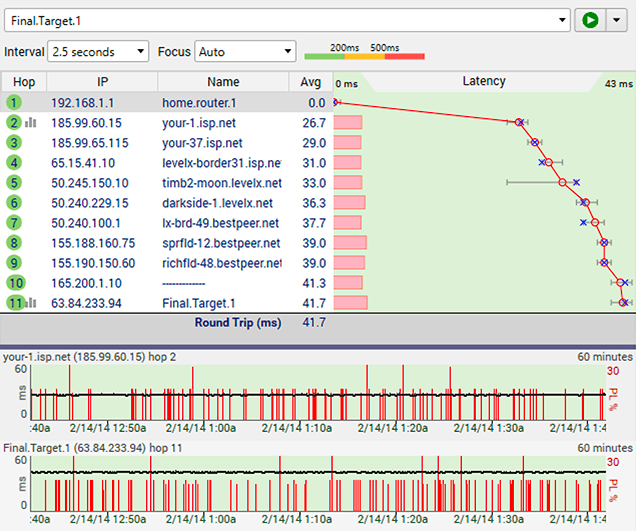
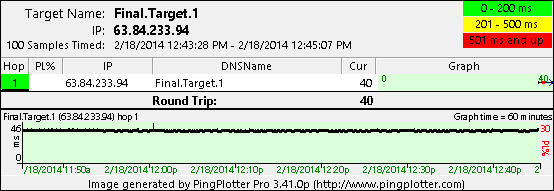
41ms round trip latency with no packet loss? You really can't ask for results much better than this!
The packet loss at hop #2 and hop #7 is nothing to be concerned about - some routers just don't prioritize timed out ICMP requests very well. As long as this packet loss doesn't have a negative effect on the final destination, you don't need to worry about it.
The packet loss at hop #2 and hop #7 is nothing to be concerned about - some routers just don't prioritize timed out ICMP requests very well. As long as this packet loss doesn't have a negative effect on the final destination, you don't need to worry about it.
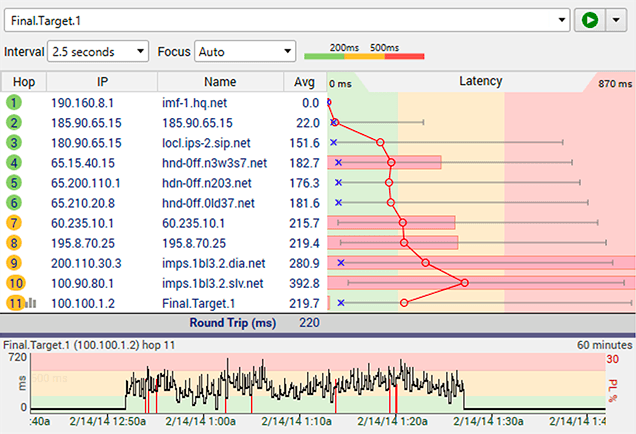
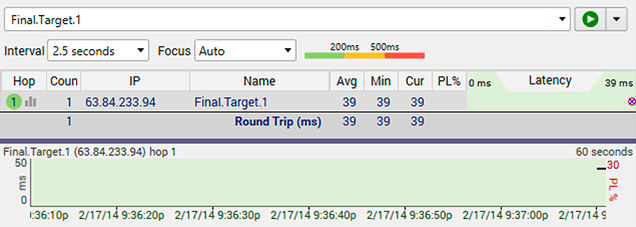
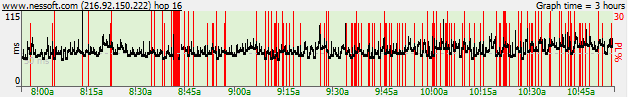
Every network has limits - and running at the limit is not necessarily a bad thing. This graph is an example of a network that's running great but then gets saturated / overused.
The distinct parts of this pattern is that latency and/or packet loss occurs at a bandwidth-limited point (often the connection between you and the ISP), and it starts and stops pretty abruptly. If you have a "fat pipe", the latency jump is probably not as big as this example.
The affects to the rest of the network is pretty big - where everything is fine and then suddenly web pages take forever to load, movies buffer, VoIP calls get garbled and it feels like 2002 again with your slow network.
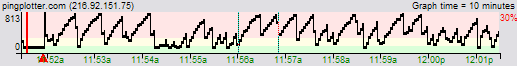
In PingPlotter, bandwidth saturation appears in many forms. One distinct pattern is the Saw tooth. This pattern is a strong (like really really strong) indicator of bandwidth saturation.
There are a few possible solutions to this problem:
Bandwidth saturation can come from two directions - overuse, or under supply. If this happens regularly and you can't figure out why, you might want to get with your provider to have them help you troubleshoot.
Internet Service Provider Bandwidth Saturation
- Use less bandwidth.
- Buy more bandwidth.
- Get a device between you and your ISP that limits overuse by big consumers (throttling, but the good kind).
- Put up with it.
Bandwidth saturation can come from two directions - overuse, or under supply. If this happens regularly and you can't figure out why, you might want to get with your provider to have them help you troubleshoot.
Internet Service Provider Bandwidth Saturation
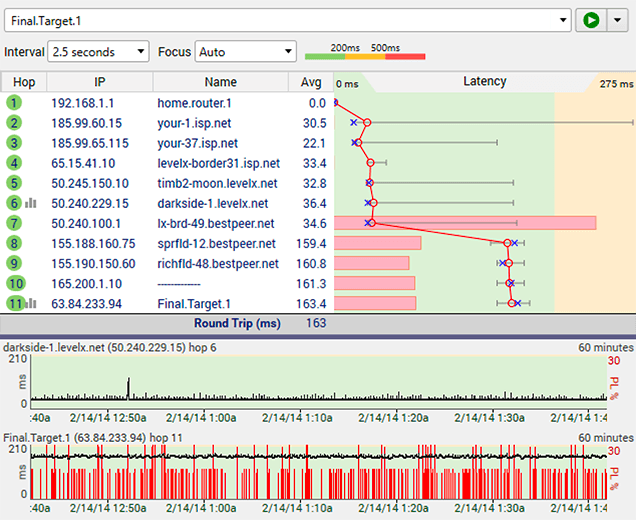
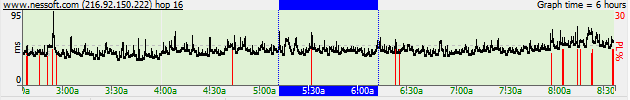
Bandwith saturation happens everywhere - and honestly, there are many manifestations of it. Here's an example where there's some packet loss nearer the far end.
When you see situations like this that are chronic and affecting you regularly, it may be best to contact the provider at the far end, if you have a relationship with them.
When you see situations like this that are chronic and affecting you regularly, it may be best to contact the provider at the far end, if you have a relationship with them.
Wireless networks are not always reliable - if you're seeing consistent packet loss at hop 1 (your wireless router/hub) and you're connected to your network with 802.11 wireless, then your wireless connection may be the culprit.
Wireless connections are almost always recognizable (vs a wired one) because there is a non-zero latency even inside your own network. Sometimes, this is 1ms - sometimes it can be as high as 4 or 5 ms normally, and sometimes you get regular latency as high as 250-400ms.
If you're seeing that and you can somehow connect your computer to a wire it may make a big difference in your network experience. If that's the case, sometimes changing wireless channels can help (from your wireless router) or even upgrading your wireless router to a newer one.
If you suspect this is happening to a wireless hardware device (like a Blu-ray player or similar) and your computer's network latency / packet loss looks just fine, you may wan to try tracing from your computer to that device (find its IP address in the setup menu for the device). If you see results like the graph here - you'll probably have a way better experience with a wire.
Bad Hardware on Local Network
Marginal wiring or failing hardware in your own network happens more often then we may think. The good news is that once you've found the problem, you can often actually fix the problem. In this case, you know it's inside your own network because hop 1 is your router - and any device with a 0ms normal latency is most likely pretty close to you.
In this case, the most likely culprits are: a network cable; your switch/hub/router; a network card in your computer or a similar piece of hardware or cable. Look for anything between you and the router at hop 1.
This could also be a bad power supply (especially if the red periods are just about as long as it takes to reboot a device), or even bad/noisy power or bad grounds.
One way of isolating the problem is to trace to a target inside your own network (another computer, your TV, Roku, DVD player, or anything else you know the IP address for) and see if the problem shows up then. If you can trace to another device and the problem doesn't happen, you can eliminate any hardware or wiring that's involved in that scenario and focus on other spots.
Internet Service Provider Bad Hardware
Low levels of packet loss at the first hop inside your providers network can sometimes be indicative of a connection that's struggling to maintain service. This might be because of noise on the line or marginal hardware. Water in a junction box is one example, or maybe a bad splitter or terminator on a cable modem line.
This diagnosis is valid when there is consistent packet loss pattern at downstream hops starting inside your provider and following through all the way to the final destination. If you're only seeing the packet loss pattern at a single hop, then that's not indicative of an issue.
In cases like this, your ISP can often measure the signal quality from their data center and may be able to see the problem from their end, too.
Low levels of packet loss like this can sometimes make your job harder because if your provider doesn't see the problem, they may not believe there is a problem at first. If that happens, then try looking for time-based or weather-based problems that might help accentuate the pattern. Also, make sure you're keeping track of the affect this problem is having on your experience - if you're losing connection or having freezing or buffering.
Destination Address Unreachable
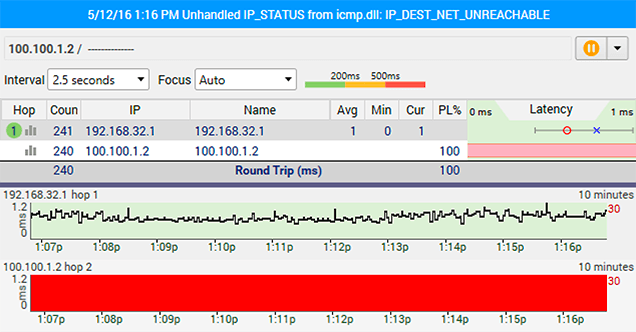
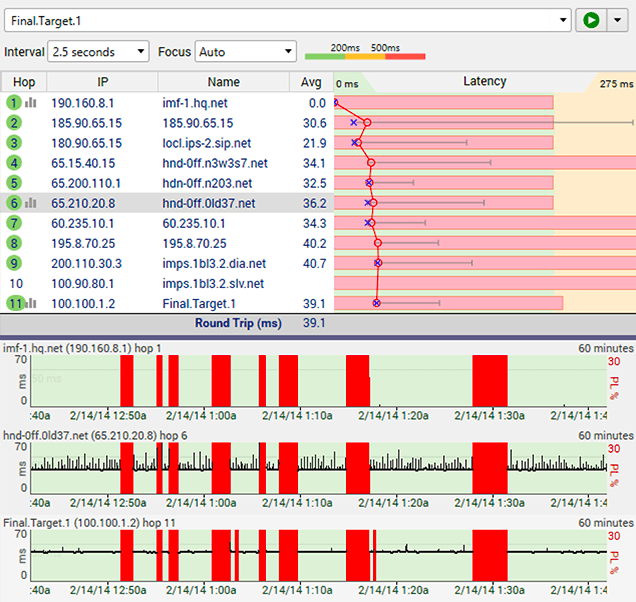
The fact that the graph is this screen shot is returning a "Destination Address Unreachable" message doesn't necessarily mean that the target website is down. One of the routers between the computer running Ping Plotter, and the destination is not passing through ICMP echo requests, or not allowing ICMP TTL expired packets to return.
The first first thing that should be tried here is to see if switching to TCP or UDP packets returns any results.
The first first thing that should be tried here is to see if switching to TCP or UDP packets returns any results.
Even if the target here doesn't respond to any of the different packet types - the information from the rest of the route can still be useful. Most chronic reoccurring network problems (more than 90%) happen closer to home - like in hop #1, #2, or #3 - all of which can still easily be monitored from here.
No Hops Showing
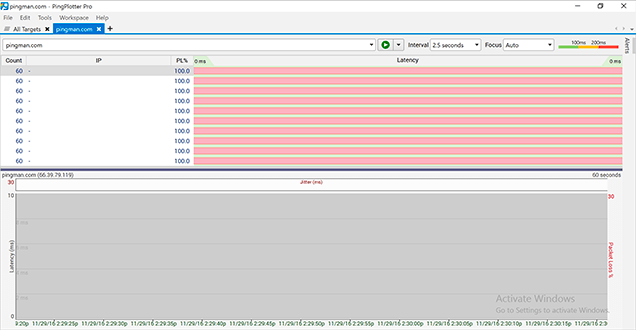
If you're seeing symptoms that are shown in the above screen shot - odds are you probably have some kind of network firewall software installed on your computer. Many of these firewalls use "by application" network blocking - meaning you need to flag specific applications that you want to access the internet.
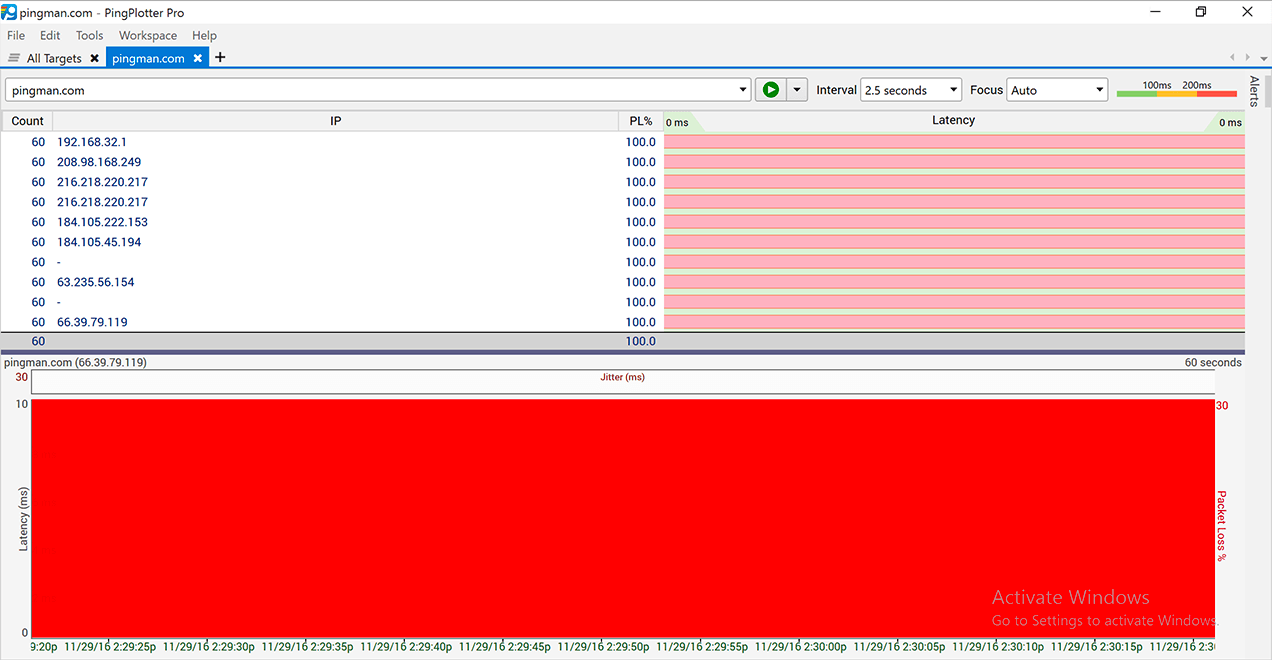
The fact that none of the intermediate hops seen in this screen shot are returning any information tells us that the culprit here is something close to the computer that is running the trace. This could be firewall software on the computer itself, a firewall or router between the computer and the first hop or a handful of other things.
The packets that are being dropped are ICMP TTL Expired packets returning from the internet back to you.
The packets that are being dropped are ICMP TTL Expired packets returning from the internet back to you.
This screenshot is taken from a computer that is actually running Ping Plotter with through Parallels. Both VMware and Parallels (for Mac) have issues when the VM is set up using NAT, because of shortcomings in their network stack (which results in only the final hop showing up - as shown in the screenshot). If you switch your VM network configuration to "bridged" mode, the full route should display.
XXX . XXX 4%zero null 0 Does Ping Plotter work in a virtual machine environment?
Can I run Ping Plotter in a virtual machine environment such as Parallels, or VMware?
Answer
Absolutely! We've tested our products pretty thoroughly in both Parallels, and VMware - without any sort of issues. That being said - some adjustments need to be made in the network settings of both of these environments in order to get things working.If you're running Ping Plotter inside of a virtual machine, you need to make sure that you don't have the network configuration set up to use NAT. VMware and Parallels both have issues with this setting because of shortcomings in their network stack (they rewrite TTL packets in a way that Ping Plotter isn't able to query any intermediate hops). This results in Ping Plotter only showing the final hop, like so:
Switching the network configuration to bridged mode gets things working as you'd expect - and it's pretty easy to accomplish.
In Parallels:
You can adjust your network configuration to use bridged mode by going to "Devices" -> "Network" -> Bridged Network," and then choosing the appropriate adapter (Default, Ethernet, Wi-Fi, etc)..png)
In VMware:
You can choose a bridged connection by going to "Virtual Machine" -> "Network Adaptor" -> "Bridged.".png)
Some notes about Wine/Crossover
Unfortunately, Ping Plotter doesn't work under Wine (or Cross Over - which is based off of Wine) - for a variety of reasons. The biggest show stopper with Wine is that it must be running as root to create the raw packets that Ping Plotter requires. This creates a pretty serious security problem that could allow Wine to corrupt your host machine. The Wine creators strongly advise against running Wine as root - and as a result of this, we've stopped supporting Ping Plotter in this scenario.Ping Plotter port use
we need to configure my firewall to not block PingPlotter data. Which ports do I need to open?
Solution
PingPlotter's port use varies depending on the packet type. We'll discuss the 3 primary packet types and the ports / protocols they use so you can configure your firewall to allow PingPlotter access.ICMP Types
ICMP packets do not use ports at all - ports are an attribute of both the UDP and TCP packet types, which are peers to ICMP. The packet type itself defines how it behaves, and ICMP functions without the need for ports.Outgoing packets use ICMP echo requests (type 8). Returning packets use ICMP echo replies (type 0) and ICMP time exceeded (type 11), TTL expired in transit (sub-type/code 0).
Summary:
- Outgoing: ICMP type 8 (echo request)
- Returning: ICMP type 0 (echo reply) and ICMP type 8 (sub-type 0), ICMP TTL expired in transit.
UDP Packet Type
UDP packets do use ports for outgoing - in a range from 33434 to roughly 33500. Response packets are similar to the ICMP type - where the intermediate hops use ICMP time exceeded (type 11, sub-type/code 0). The final destination response back with an ICMP Port Unreachable, though, rather than the echo reply of ICMP type.Summary:
- Outgoing: UDP Port 33434 to 33500
- Returning: ICMP type 3 sub-type 3, ICMP TTL expired in transit type 8 sub-type 0.
TCP Packet Types
The TCP packet type adds another capability - a reply type that isn't ICMP. The outgoing port is totally defined by you, the user, but most people use port 80 for outgoing requests. The reply is the other half of the TCP connect protocol (not ICMP!). Intermediate hops return the same data that the other packet types do - ICMP type 8, sub-type 0.Summary:
- Outgoing: TCP SYN - port 80 (or whatever port you specify)
- Returning: TCP ACK for final destination, ICMP TTL expired in transit type 8 sub-type 0.
Ping times - should they add up?
The ping times don't always seem to add up logically to me. For example, I commonly see the average time for a single hop being longer than the total return trip number. This doesn't make sense to me.
Solution
The latencies (average, current, minimum, maximum) do not need to be added together - each hop represents the total amount of time it takes for a packet to get to that hop/router, and then back to your computer. If you're collecting data for a route that is 10 hops long, the data at hop 10 has to go through all the previous hops too, and the round trip time represented in Ping Plotter is the time for it to make the entire trip.This starts to seem impossible, though, when an intermediate hop reports latencies higher than the final destination does. How can that be possible?
Some routers might down-prioritize ICMP requests that are 'expired'. Trace route (and Ping Plotter) uses expired packets to discover and measure intermediate hops. A router might be relatively lazy about responding to those packets, but pass other packets through to downstream packets quickly and with high priority. This sometimes manifests itself as packet loss or high latency while other hops further downstream don't have these symptoms. This might indicate that there is high load on this router, but doesn't mean that for sure.
Another thing to keep in mind is that each hop is being queried individually - we send a packet to each hop for each sample set. This means that you might see lost packets at an intermediate hop that might not be lost further downstream. Often, you'll see statistical similarities, though, where the packet loss percentage is similar through all downstream hops, even if the packet loss (or latency problems) don't happen at exactly the same time point.
Packet loss not seen with ping -t
A 'pure ping' using -t switch shows no problems, but PingPlotter shows many packet losses. What would cause that?
Solution
If the final destination is showing different results than ping -t, then here are some possibilities:- First, make sure that you’re comparing the results from the final destination of your trace in PingPlotter with the “pure ping” results. When a device is an intermediate hop in a route, the request it’s receiving is expired (the TTL on the packet equals 0). When a device is being targeted directly, the request it’s receiving isn’t expired (the TTL doesn’t equal zero).
- Because Ping Plotter sends out packets for every hop, Ping Plotter may be saturating your bandwidth, while ping -t doesn't (because it only sends out a packet to the final destination). Make sure your packet size is set to 56 bytes or less (lower = less bandwidth), and that your packet send delay is at 50 ms or higher (higher = less bandwidth).
- The packet size could be different, and that different packet size in Ping Plotter may be causing some packet loss. Note that this is a problem with the router, not Ping Plotter, but you can change the packet size to something smaller than default to see if this affects it. . A bios update to your router or broadband device might help this - check with your hardware manufacturer for a new firmware version. Note that ping -t (no options) will send out packets with 32 bytes of data, plus 28 bytes of header, so set Ping Plotter / Multi Ping to 60 byte packet size to be equivalent.
- Having multiple simultaneous outstanding ICMP echo requests may be causing a problem in one of the routers. This isn't too common, but is almost always traced back to a router/device on the local side (check with your hardware manufacturer for BIOS/firmware updates).
- In some very isolated cases, we've seen a difference in packet loss based on the contents of the packets. Ping -t uses a repeating sequence of 'abcdefghijklmnopqurstuvw' while Ping Plotter uses a repeating sequnce of PingPlotter and then the version number. You can change Ping Plotter to be the same as Ping by creating a text file with the same thing that PING sends (i.e.: create the file with abcdefghijklmnopqrstuvw in it), and then go to Advanced options and change the packet cargo to use this file. This is kind of a long shot, though, as in all cases where we've seen this make a difference, Ping Plotter was used to simulate and extraordinary bytes sequence that stimulated the packet loss. This is worth trying though since it's quite easy to do.
- Sometimes if there is an oscillating route where the route length changes regularly, Ping Plotter might not properly detect it, and might show packet loss. To check if this is the case, go to View -> Ignore First Hops -> Ping Final Hop Only. If this makes a difference, feel free to contact us and we'll help determine if there is a solution.
Ping times - should they add up?
The ping times don't always seem to add up logically to me. For example, I commonly see the average time for a single hop being longer than the total return trip number. This doesn't make sense to me.
Solution
The latencies (average, current, minimum, maximum) do not need to be added together - each hop represents the total amount of time it takes for a packet to get to that hop/router, and then back to your computer. If you're collecting data for a route that is 10 hops long, the data at hop 10 has to go through all the previous hops too, and the round trip time represented in Ping Plotter is the time for it to make the entire trip.This starts to seem impossible, though, when an intermediate hop reports latencies higher than the final destination does. How can that be possible?
Some routers might down-prioritize ICMP requests that are 'expired'. Trace route (and Ping Plotter) uses expired packets to discover and measure intermediate hops. A router might be relatively lazy about responding to those packets, but pass other packets through to downstream packets quickly and with high priority. This sometimes manifests itself as packet loss or high latency while other hops further downstream don't have these symptoms. This might indicate that there is high load on this router, but doesn't mean that for sure.
Another thing to keep in mind is that each hop is being queried individually - we send a packet to each hop for each sample set. This means that you might see lost packets at an intermediate hop that might not be lost further downstream. Often, you'll see statistical similarities, though, where the packet loss percentage is similar through all downstream hops, even if the packet loss (or latency problems) don't happen at exactly the same time point.
XXX . XXX 4%zero null 0 1 2 Ping Plotter Manual
Introduction
A network connection probably isn’t something you think about on a regular basis. When it isn’t working right (or stops working all-together)… well, that’s a completely different story. At that point, it’s *all* you can think about. The only thing that’s worse than your network connection not working? Trying to figure out why it’s not working.
If you’re reading this, odds are you’ve encountered (or are currently encountering) this exact situation. Or maybe you’re just preparing yourself ahead of time (go you!). No matter your current network situation, Ping Plotter can help you get to the bottom of these kinds of problems faster, so you can find a solution and get back to not having to think about your connection.
Ping Plotter was originally created in 1998 to troubleshoot unacceptable lag in an online game (a problem which that particular ISP was claiming no responsibility for at the time). Over the years, the program has grown, and added a variety of features and capabilities. Today, it’s a very powerful network monitoring, troubleshooting, and diagnostic tool, which is used by a variety of users - from the “weekend troubleshooter” to full-time network administrators.
Ping Plotter can help with a variety of different network related woes - and can be a great help to you if:
- You rely on a network or internet service, which happens to be having problems - such as slow performance, random disconnects, or other similar issues.
- You’re a systems administrator - and you need to know when connectivity to one of your severs go down (and want some evidence of where/when/why it went down).
- A provider is telling you that they can’t see any problems (when you’re clearly having issues) - and you need to show them where the problem really is.
- A web browser
- VoIP services/video chat
- Online gaming
- Streaming audio/video
- An ASP for your business (such as payroll, accounting, human resources, etc)
- Home automation products
90 Second Overview
Once you've got PingPlotter downloaded and installed, starting to collect data is a breeze.


If you’re not new to this space (and possibly just rolled your eyes at the idea of reading though an analogy), feel free to skip to the technical details toward the bottom of this section.
Network traffic is a bit like freeway traffic
A network can operate a bit like a freeway; things are great when everyone is going the speed limit and we only have 50% of the maximum traffic that’s designed to go on that freeway. When we start to add more and more traffic, though, at some point the freeway won’t have the capacity for any more.Problems will start to arise as new drivers try to merge on the freeway. People that are already on the freeway will sometimes slow down and cause traffic jams. If it gets too bad, some people may give up all together - and decide not to continue their journey.
On a freeway, this might be referred to as “congestion” - and this “congestion” happens on networks as well (in pretty much the same way). Packet loss and latency (two terms you’ll be getting very familiar with) are both symptoms of congestion - when there’s too much traffic for the network to handle.
Lets say this proverbial freeway is the one we take to get home from work everyday. Let’s also say (for this example) that between work and home there are 15 off-ramps with turnaround points off of the freeway. Lets also say that we’ve got a team of 15 people, each with their own car, ready to do whatever we ask of them (again, for the sake of this example. Stick with us here).
If we want to find out the conditions on the freeway for our drive home from work, we could send out 15 cars, and assign each driver to one of those 15 off-ramps. The instructions for each driver are the same: get you your assigned off-ramp, turn around, and come back. Then we’ll measure the time it takes each car to get from us, to their off-ramp, and then back to us.
The most important car is the one that goes all the way to your target (or home) - that 15th car. If it makes it there and back again in the expected time, then we know that the traffic on the freeway is running pretty well.
If that 15th car takes longer than expected (or if it never returns), then we can look at the results for the other off-ramps to find a likely place where problems could be occurring. Maybe all the cars through off-ramp #9 had no problems (and returned quickly) - but the cars that went through off-ramp #10 (and beyond) started getting delays (or didn’t return). From this, we can see that there is some kind of problem happening past off-ramp #9.
PingPlotter operates *very* similar to this; it sends out data packets that go all the way to a target destination (as well as each stop in between), and measures the amount of time it takes to get there. It also measures how often a packet (or a router) gives up. This information can be used to figure out where (and when) problems are occurring.
For the sake of taking this analogy too far, lets look at one other scenario. Let’s say that off-ramp #5 is in a small town where the police are are of a disposition to pull people over for no reason (this is all theoretical, of course - we would never imply that any police actually do this). Each car that we send to off-ramp #5 have to pass buy these police officers, and 20% of the time, they get pulled over. Another 15% of the time, there’s someone else pulled over there, and our car has to wait while that car moves off the road. Meanwhile, traffic is whizzing by on the freeway, unrestricted.
This situation can happen on a network with PingPlotter as well - where the packets going to hop 5 might get waylaid by some local rules and show packet loss, latency, and jitter that are not being experienced by packets destined for other places.
Technically speaking…
At its heart, PingPlotter is a trace route utility. It's souped up and on steroids, but the basic data it collects is based on the theory of trace route.A ping packet is an IP packet requesting that a copy of its contents be echoed back to the sender. When you "ping" a site, you send over an echo request and that site responds back that it received it.
One of the parameters on a ping packet is something called "Time to live" (TTL) - which is an IP header field designed to keep packets from running in loops (essentially forever) throughout a network (this can happen when there is a route change, and the routers involved don't all know the same information as new information is being replicated out). Initially it's usually set to somewhere between 64 and 255, and is reduced by 1 every time it passes through a server. If the TTL should ever reach zero, the packet has expired, and the router that it's passing through will send it back to the source.
Trace route plays with this TTL number on outgoing packets. It first sends out a packet with a TTL of 1. The first router that sees this and decrements it to 0, and then sends it back. It also sends back its own IP address with the packet, and DNS is used to do a lookup for an actual domain name.
Next, traceroute sends out a packet with a TTL of 2 so it can find out what the next computer in the route is. Then it sends out a packet with a TTL of 3. This process is repeated until the final destination is reached. At that point, you know the entire path the packet has traversed to reach the destination computer/router. Each server/router in this chain is called a hop.
This method can help us determine the route a packet takes, but if we time each of these packets, we also know how long it takes for a packet to make it from our source PC, to that router, and then back again. This is called latency.
The last hop in a (successful) trace route is actually the round-trip time to the destination server. This is an important concept to understand. You don't add up all the times between you and the destination host - as that time has already been added. The time to the last hop in the chain is exactly the same as is if you'd used a ping utility to that host. So a trace route utility is actually two utilities - ping AND trace route.
Ping Plotter speeds up this process by sending out packets to the first 35 servers in the route all at the same time. This makes a HUGE difference in overall speed. It also means that the network conditions for each hop are very similar - so the numbers are better compared.
Downloading and Installing
Windows
Once downloaded and launched, the Ping Plotter installer starts a wizard driven install that steps through the installation process. We suggest leaving all the settings at their defaults ).At the end of the install, you'll be asked if you want to "Run Ping Plotter now". If for some reason you don't want to at that time, uncheck that checkbox. Otherwise congratulations, you now should have a Ping Plotter group in with the rest of your installed applications (i.e.: Start menu, Programs group, Ping Plotter folder) and are ready to go!
If this procedure doesn't work for you for some reason (if you get a weird error, etc.).
Uninstalling
To uninstall Ping Plotter - just locate your Ping Plotter directory in the start menu and run "Uninstall or Modify Installation." Once the setup wizard launches, click "next" and then choose the "remove" option. On the next screen, you'll be prompted with options to keep or remove your Ping Plotter license key; as well as any settings, directories, and log files (note: if you are uninstalling through Add/Remove programs these options are only available though the "Change" option. The "Uninstall" option does not provide these options). After your preferred boxes are checked or unchecked, click "Remove," and then "Finish" to complete the uninstall.
If you can't find the Modify or Remove option in the Ping Plotter start menu or in Add/Remove programs, try installing the latest version, then uninstalling. This might also help solve missing installer errors (like "File {7c7a8eba-cb1a-4626-aa2d-8311b84092ab}.msi not found") during uninstall.
Mac
PingPlotter for Mac downloads in a .zip file. After downloading and extracting the file, a prompt will come up asking if you want to move the program to the application folder (which we recommend doing). Once the file is extracted to the application folder (or any other location you may have chosen to keep it), it will automatically launch - and you're all set from there.Uninstalling
Uninstalling is a fairly straight forward process; simply move the application from wherever you're keeping it (application folder, or elsewhere), and move it to the recycle bin. The program does store it's configuration files and data in a separate location, though. To find these files, open a new Finder window, click on the "Go" option in the menu, and choose the "Go to Folder" option. From there, enter "~/Library/Application Support/Ping Plotter" (minus the quotes), which will direct you to the directory where Ping Plotter stores all of its' info (and you can move all of this to the recycle bin as well).
Target Bar
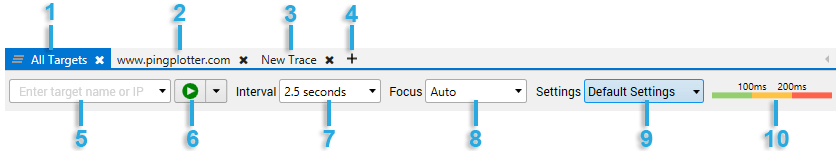
#2 - Trace Target Tab*: Target windows can be opened for any target from a summary screen by either right clicking on a target and choosing "Show Target Window," or by clicking on the IP address for a target.
#3 - New Trace Tab*: A blank tab ready for a new target entry. If you try to start a second "New Trace", the old "New Trace" is replaced with a new one.
#4 - Add New Trace Button*: This button will open a "New Trace" window.
#5 - Target Entry Field: This field is where a new target can be entered (either by IP address, or DNS name). Clicking the dropdown button on this field will bring up a history pane showing all of the previous targets that have been traced to.
#6 - Start/Pause Button: This button can start a new trace (after a target name/IP address has been entered), or pause an existing trace. Clicking the dropdown option on this button will also provide options to "Reset & Restart" a target (which begins a completely fresh trace session to that target, and clears out all old trace data), as well as an option to create a "New Target" window.
#7 - Trace Interval Setting: This setting dictates the amount of time that Ping Plotter will wait between sending out sample sets. The dropdown menu provides several different options - but values can be manually typed in here as well.
#8 - Focus Setting: This field dictates how much recent data Ping Plotter use to calculate the statistics displayed in the trace grid. If set to "auto" - then the focus time will automatically adjust to what is displayed in the time graphs (for example, if a time graph is set to 1 hour, then Ping Plotter will automatically display the statistics for the last hour). If set to a value (i.e. - 60 seconds), then Ping Plotter will display the most current samples within the timeframe that is set (double-click the time graph to change focus in non-auto mode). If set to "Auto" - Ping Plotter will base its statistics off of whatever is displayed in the time graphs (and the statistics will update if you scroll back and forth on the time graph).
#9 - Settings Dropdown: If you're using Pro and have more than one named configuration, you'll have a "Settings" selector here, too. This lets you switch a target (or summary graph) to a different set of parameters.
#10 - Good/Warning/Bad Color Legend: This shows the thresholds that have been set for the colors in the graph background. The values here can be adjusted by going to either "Edit" -> "Options" -> "Display" (for Windows), or "Ping Plotter" -> "Preferences" -> "Display" (for Mac).
*Tabs are currently only available in the Windows version of Ping Plotter (however, if you're running Sierra on Mac, you can make use of the tabs feature)
Trace Graph

The upper graph is called the Trace Graph. All columns on the trace graph are re-sizable. The lower horizontal graph is called Timeline Graph.
All numbers on the trace graph use the "Focus" setting to control how many samples are used in the calculations. By default, you're looking at the most recently collected samples - but you can also focus on samples that are not the most recent samples by double-clicking on the time graph. This will focus the upper graph on that period you double-clicked (we cover this topic in a bit more detail below).
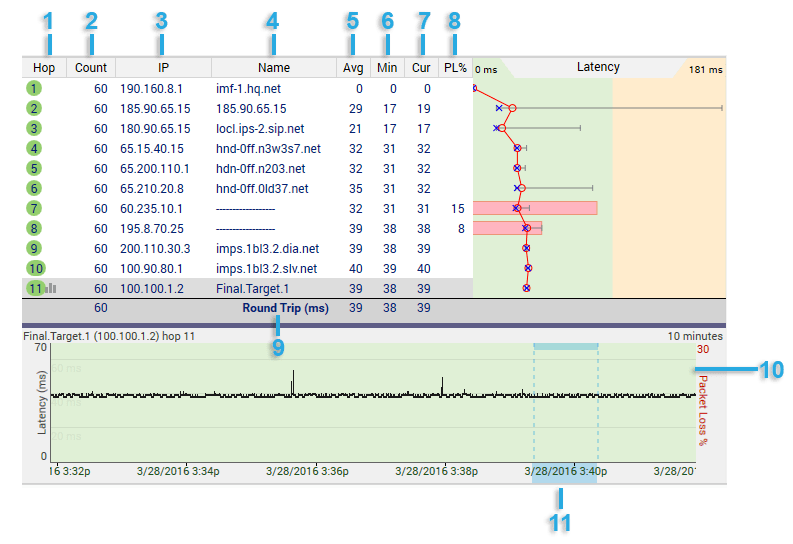
1 - The number of hops that device in the route is from your computer. If a hop a bell icon next to it, this means that hop is being monitored for an alert (alerts are covered in the advanced settings section of this tutorial). Multiple alerts can be configured for the same IP, and alerts don't work unless some IP in your current route is being monitored. If a hop has an graph icon next to it (like hop #11), that hop is being traced on a time-line graph.
2 - The Count column displays how many packets have been sent for the current focus period.
3 - The IP address column shows the IP addresses of the routers that reported back for each hop.
4 - This column shows the DNS name of the device for that hop. A "----------" in this column indicates that PingPlotter was unable to resolve a name for that device's IP address. This is not a flaw in PingPlotter, it just means that your DNS server doesn't have a name for that IP address (or that address just doesn't have a DNS name, period).
5 - The Avg column shows the average response time of the last "X" samples (where "X" is the "Focus Time"). Any timeouts/lost packets are not included in this value.
6 - The Min column shows the minimum response time for the current focus period.
7 - The Cur column shows the individual sample time of the most recent sample included in the set. If a number is displayed as ERR, that means the packet was lost (i.e.: a packet was sent out, but never made it back).
8 - The PL% indicates the number of packet(s) that have been lost in the current sample set. If you're only including the last 10 samples, then only the number of lost packets in the last 10 samples are shown here. If you want to find out how many time-outs have happened over the entire session, change the "Focus Time" to "0" or "All."
9 - The Round Trip line is basically there for ease of reading. It's the same value as the last server in the route. This is the time it takes for a ping to get from your computer to the target device and back.
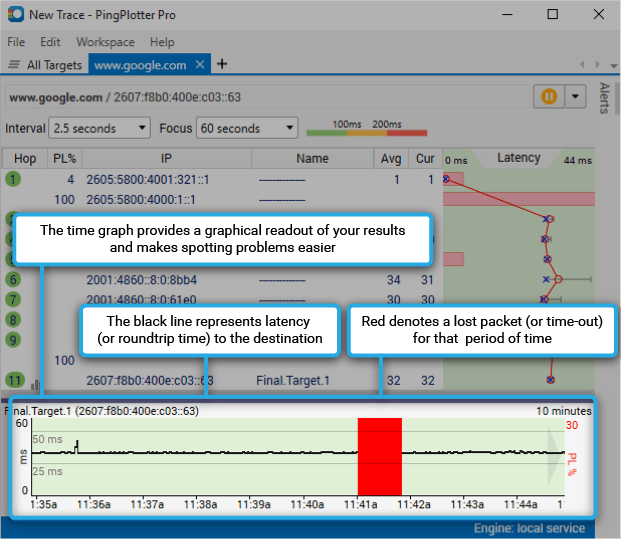
10 - The Timeline Graph (TG) is one of the most powerful features in PingPlotter, and great for long-term monitoring projects you may be doing. We discuss time graphs a bit more in the "Timeline Graphing" section.
11 - Double clicking anywhere on the timeline graph will bring up a Focus Area, which will focus the trace data graph (top graph) to that particular point in time. This is particularly useful for investigating spikes or time-outs
Tools and other options available for the Trace Graph
- You can display the Minimum and Maximum columns by right clicking on the upper trace graph and selecting them (via the "Customize View..." option).
- You can copy the IP address or DNS name for a hop to the clipboard by right-clicking on that hop, selecting the Clipboard option and then clicking on what you want to save.
In PingPlotter Standard and Pro you can also display a timeline graph for any of the other hops in a route by either double clicking on that hop, or right clicking and selecting “Show this timeline graph.” You can also turn off any graph by these same mechanisms.
The amount of data displayed on the graph can be changed, too - just right click anywhere on the graph and select the amount of time you’d like to display (this will affect all timeline graphs and is saved when you shut down PingPlotter).
Navigation
If there is more data collected than we can show on a timeline graph (for example, if you’ve got 48 hours worth of data, but have your graph scale set to “10 minutes”), you can click (and hold down) your mouse button on the graph, and drag it back and forth. This allows you to move back in history and examine the samples during those times.On Windows, if you click on a graph and scroll down, you’ll move back on the time graph, scrolling up will move the graph forward. If you click the scroll wheel, scrolling up or down will toggle through the time period options on the graph (so you can basically zoom in, or zoom out using this method). On Mac, with a magic mouse you can hold a left click and scroll to zoom in/out on the timeline graph.
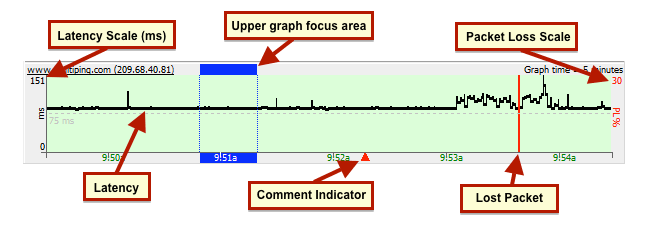
Comments
If you’re using PingPlotter for long-term monitoring, you may sometimes run across a situation where your network was effected by something you know about (power outage, big file download, that time you threw your router out the window, etc). You may also run into situations that you don’t control, but know the cause of (or can speculate on). Being able to take notes about these situations and tie it to your data can prove to be very, very helpful.To create a note, all you need to do is right click on a timeline graph (at a point you want to create a note), and select the “Create Comment” option. A prompt will appear asking you to create your comment, and then PingPlotter will draw a red triangle on the lower edge of the timeline graph. If you float your mouse over the triangle you can see the note:
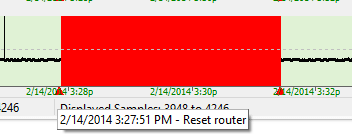
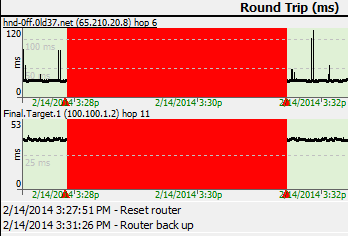
When you save data as an image from PingPlotter, your comments will get attached to the image (along with the times they happened). If you’re sending a image to a network provider, this can be especially valuable - as it helps explain the events on the data that you’re sending to them:
The Focus Area
Any time you double click on a timeline graph, a blue “Focus Area” will appear, which focuses the upper graph to that point in time. This focus area is based off of the “Focus Time” value (and this won’t work if you have this value set to “ALL”).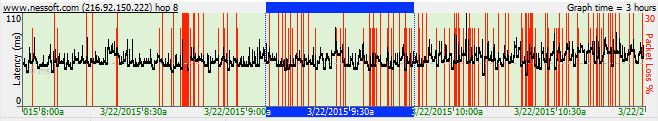
When you’re finished going through your graph history, you can reset everything to display your current results by right clicking on a timeline graph and selecting “Reset focus to current.” This returns both of the graphs to, you guessed it, the current time.
Summary Graphs
The "All Targets" summary
The All Targets summary is a special summary. It's all the final destinations you're tracing / monitoring. This summary is automatically maintained by PingPlotter - when you add a target it shows up, when you close, it's removed. You can rename the tab (and any other summary) by right-clicking on its tab, but it's always maintained. If you hide, it'll be there (in the Workspace menu) when you're ready for it again.Adding targets to the summary screen
If you want to manually add a target (or any intermediate hop) to a custom summary graph (which we cover below), just right-click on that hop in the trace graph and select "Show (target) on summary" -> (then pick a summary).From the summary screen, you can switch to the trace graph by right-clicking on a host and selecting the menu option "Show trace graph," or by simply clicking on target's IP address. You can sort the list of targets by clicking on a graph heading. Clicking again reverses the sort order.
Creating custom summary screens
You can create multiple custom summary screens, making it easy to group certain targets together. To create a new summary screen simply right click on a target (or you can select multiple targets by holding down either the "CTRL" key (on Windows) or the Command key (on Mac), and clicking on them, and then right click) and under "Show on Summary Screen" select "(New Summary)" and a new tab will open up with your target(s).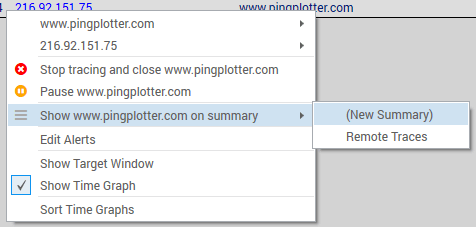
Summary screens that have been hidden can always be reopened by going to the "Workspace" -> "Summaries" menu option - which will display a list of any active summary screens that are set up. If you want to auto-maintain a summary screen based on performance, you can use an alert to add or remove from a summary.
Time periods on the summary screen (or, "Focus")
A summary screen is a collection of targets, possibly with different trace intervals, latencies ranges or problem / performance characteristics. The "Focus" always applies the same time period to all targets, even if the trace interval is different. Some targets may be paused while others are running - they're all compared at the same time, so your statistics may be blank for some targets, and your "Count" column may have different numbers for each target.As in the Trace window, the "Auto" focus mode is pretty awesome - you can scroll through time and get a quick summary of what you're looking at.
Using the Target Bar on a summary screen.
A great way to enter new targets is to do it from a summary screen. When you do this, the settings and interval from the summary target bar is used - and that target is automatically added to that summary screen. When you do this, a target tab is not opened for each target you're adding, but the data is being collected. Just click on the blue IP address link to open up the full trace graph.Another cool thing about the target bar is you can easily change interval or settings - just select a target (or 10 via multiselect) and then change the setting.
On a related note, multi-selected targets have a variety of options available on the right-click menu, too. You can close, start, stop. etc all the listed targets; the right-click menu will show you the affect you're going to have.
Workspaces
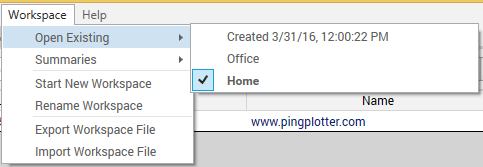
PingPlotter v5 always has a workspace running by default. If a separate workspace is needed (for example, if we'd like to set up a "home" and an "office" workspace), one can be created by going to "Workspace" -> "Start New Workspace."

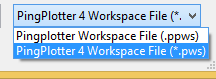
*Importing/exporting of workspaces is currently only available in Windows versions of PingPlotter.
Running as a service and workspaces
When running as a service, there are some complications with workspaces if you're in a multi-user environment. On startup, the service automatically starts, and any user on that machine can close targets, switch workspaces, or add new targets.The list of running targets is stored separately from the "layout" of a workspace. The list of targets is tightly tied to the data we're collecting for those targets, and will always win over your layout workspace. It's possible that starting PingPlotter will connect to a different list of targets than last time - in this case, PingPlotter will do its best to give you something meaningful (like a nice All Targets summary) - and your collected data will be there, read to review and analyze.
Web Interface
**Note: the information in this section is specific to the Windows version of PingPlotter.
PingPlotter Pro has a built in web interface, which allows you to view data and access quite a few options of PingPlotter Pro from a web browser - without having to be local on the machine that is collecting data.
Enabling the built-in web interface
| We recommend using PingPlotter as a Windows Service if you're going to use the web interface. This will make sure it's always running, and makes security permissions slightly easier to configure. |
We recommend leaving the port at 7464 (although you’re free to change it) - and if you’re doing some local testing, it’s best to turn off the “Use Security” checkmark (once your testing is finished, you can go back and re-enable this option). Apply your changes, and close down the options dialogue.
We want to make sure that the web interface is running correctly - so in PingPlotter Pro, make sure you’re tracing to at least one target, and then move on to the next section.
Accessing the web interface
To access the web interface from your local machine, fire up your favorite web browser (if you’re wondering about browser requirements, we cover that further down this page) and enter the following address (or click it, if you're reading this on your computer):http://localhost:7464
This should open your browser to the PingPlotter Pro web interface - which will list all of your targets. You can click on a target to open a trace graph for it, stop tracing (and close down a target), add a new target, change some basic settings, and do some basic examination of data.
Doing Basic analysis
You can do quite a few things from the web interface - but *some* actions do require the local PingPlotter Pro client. Wondering what’s possible to do with the web interface? Well, we’ve compiled a list:- Add/remove targets
- Create a custom summary screen (and add/remove targets from it)
- Add/remove columns, customize widths.
- Examine a target’s data by:
- Changing the focus period
- Changing the period of time on the timeline graph
- Turn on/off time graphs
- Download sample data for more analysis within a local instance of PingPlotter
- Do whois lookups through www.whois.sc
Sharing targets between the Windows GUI and the web interface
Good news here - everything "just works". If you're running as a service, booting your machine will start the web interface and load a workspace (based on your preferences). You can use the main PingPlotter GUI to create alerts, add/remove targets, create summary screens. Your changes will be reflected on the web interface (which is a big improvement from V4 of PingPlotter). This means someone accessing the web interface can close targets created on the GUI and create targets that show up on the GUI.Named configurations need to be created with the GUI, but then will show up on the web automatically.
Browser Requirements
PingPlotter 5's web interface requires that Javascript be enabled. We recommend using at least IE11, Firefox 10+, or any other browser that is less than a couple of years old.Using IIS as a web server
PingPlotter 4's web interface used Classic ASP with VBScript, which is now pretty old and doesn't make sense to duplicate. The good thing about this tech is that it worked OK with IIS as a backend web server.PingPlotter 5 uses a completely different architecture - one that does not work with VBScript or Classic ASP. Currently, it also doesn't work with IIS. If you need IIS (for security, stability, scalability reasons), you might want to keep using PingPlotter V4. If you're using IIS so you can use https, that is coming to PingPlotter 5 (and should be possible today, although not documented or tested). Support for other web servers (IIS, Apache on Mac, and others on other platforms) is on the roadmap but is not immediately possible. Please contact us and let us know how you're using PingPlotter web and we'll help come up with best solution.
Advanced configurations
Over the years, we know our users have customized the web interface to do things we didn't really design PingPlotter to do - and we've helped with some of this. PingPlotter 5 changes what's possible here. If you're using V4 with modifications to the web interface to allow read-only views, REST calls to add targets, surfacing custom data and similar, please contact us for help. Many things are possible, but it's different than V4.Creating / Configuring Alerts
What is an alert?
Alerts basically monitor the conditions of a specific IP address, and then do something when those conditions exceed a specific range. The things you can do with an alert are:- Play a sound or .WAV file
- Send an email
- Log to a text file
- Change the tray icon / show a message
- Execute a web REST call
- Add/Remove a target from a summary screen
Another possible alert condition to check for is if the average for the last 10 samples is > 500 (or any other number). You can send an email alert, maybe play a .WAV file (if you're usually within hearing distance) or both. Also, if you're trying to show your ISP there's a problem, you might log the data to a file so you have records of every time it happened over a time period.
Setting up an alert.
PingPlotter v5 introduces a new guided alert setup process. To start setting up a new alert, either select a target from a summary screen, or open a trace window for a target, and click on the "Alerts" tab - which can be found on the right hand side of the application.

Setting up a New Alert
For this example, we'll be setting up an alert that will play a buzzer sound anytime our target experiences latency higher that 250 milliseconds for 10% (or more) of a 10 minute timeframe. First, we'll select the "Play a Sound" option from the "Create a New Alert section, which will prompt us to enter our alert conditions.
- Latency and Packet Loss Over Time - (the option we're using in this example)
- Latency and Packet Loss Over a Sample Count - (which allows us to look at a certain number of samples, and trigger an alert when a set amount of samples exceed our desired latency)
- Route Changed - (which triggers the alert if any hop within the route changes)
- IP Address in Route - (which triggers the alert when the user provided IP becomes part of the route)

If we'd like our sound to play when alert conditions start, and then have a different sound play when the conditions end, this is totally possible (and encouraged!). We'll go ahead and select "When alert conditions start" for the first part of this alert, and then choose the sound file we'd like to play and click "Next."


Once we've finished setting up our alert, we'll land back on the original alert screen, which will now show our new alert under the "Alerts for this Target" section. If we want to change anything about the alert (pick a different sound file, adjust the alert conditions, etc), we can click on the edit button. We can also remove the alert from a target by clicking on the delete button. Clicking on the delete button in the "Your Alert Library" section will completely remove the alert from the program (as well as from any targets it happens to be associated with).


Alerting on packet loss.
A common condition to want to alert on is packet loss. The fields you need to manipulate are in the Alert setup screen is the "Alert conditions" portion.Example: Let's say you want to notify when packet loss equals or exceeds 40%.
To do this, set "Samples to Examine" to 10, and Alert when "4" or more samples are over 9999ms. A lost packet always exceeds any number you enter in the threshold area, so if you want to consider only explicitly lost packets, set this to 9999. If you want to consider any really high latency packets as well, set this to something lower (maybe 1000 or 1500).
This only examines the last 10 packets, but let's say you want to examine a higher period - and notify on a lower packet loss percentage.
Set Samples to examine to 10000 (or some other high number). Alert when "500" or more samples are over 2500ms. This will alert when you hit 5% packet loss over a period of a few hours (depending on what trace interval you use).
A note about "average" response times.
Average response times are a problem. The real problem with mean averages is when a server stops responding - what is the average of the last 10 samples if the last 10 were timeouts? Because of the problem with this we always do "when X or more samples is > Y" (this is a median average). You can still get your alert to work like an average - by saying "when 5 or 10 samples exceeds 300 ms" (this would be like a mean average over 300ms, but would also fire when there were lost packets).
Email Setup (for alerts)
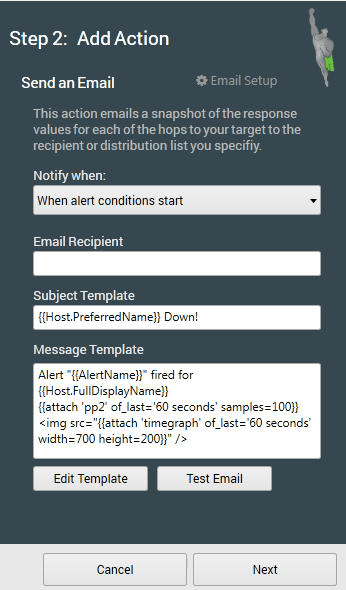
On the screen for step 2, there is an option to edit our email setup if we need to make some adjustments (just click on the "Email Setup" icon).
Next we'll need to set up our notification preferences, and choose the address (or addresses) we'd like to send the alert email to. If we need to send the email to multiple people, we can enter multiple addresses in the "email recipient" field, each one separated by a comma.

Event Notification
Each time alert conditions are met (repeating)
The event will happen every time conditions are met. This means the event will happen over and over again – on each sample that causes the alert to fire. In previous versions, this was the only supported notification type.When alert conditions start (enters alert state)
The first time alert conditions occur, the event will happen. As long as the conditions continue, though, the event won't be repeated. This is a popular use – as you find out about new conditions when they happen, but don't have to be bothered again. As soon as the alert stops happening, then as soon as it starts again, this event will happen again.When alert conditions end (leaves alert state)
This happens when network conditions improve so that the alert is no longer firing. As soon as the conditions move from bad to good (based on your settings), then this event will happen. A use of this is to have PingPlotter email you each time conditions go bad (see above), and then when they improve again – but not to tell you anything in between.Each time alert conditions are *not* met
This is the exact opposite of the first notification type above. As long as things are good on the network, this event will fire each time a sample is collected.Troubleshooting Alerts
View the Alert Events Log
The alert events log ("File" -> "View Alert Events Log") provides a summary of any recent alert activity. This prompt will display the date/time of any alert occurrence, the target the alert fired for, as well as a description of the alert. This can be a great help in troubleshooting alerts, as it allows you to see if/when an alert attempted to fire.
Make sure the alert is tied to the correct target
By far, the most common reason that an alert isn't working is because it isn't tied to the correct IP address. If you suspect this may be the case, select the target you're troubleshooting the alert for, and open the alert panel. Here, you should see any active alerts for the target (and if there are no active alerts, you can add them from the alert library from here).Set up an alert that will fire instantly, with an event that is very evident.
If you have an alert set up – and tied to a host (see above), but it seems like the alert isn't working, then changing your alert parameters (or create a new "test" alert). Set up "Traces to Examine:" to 10. Alert when "1" or more traces are over 1ms. Unless your network is responding in 1ms or less, this alert will fire on the first collected sample with the alert enabled.For an event type, use "Play a sound", or "Tray icon change/notification" as both of these events happen immediately with no wait. In addition, for the "Play a sound", use "each time alert conditions are met (repeating)", as this will continuously make sound, rather than just when conditions start / stop. Using this sequence, you should be able to tie an alert to just about any host and have the alert conditions fire immediately. Now, add on another event type (IE: email). You can leave multiple events tied to a single alert – that way you can continue to hear the sound while you're troubleshooting another event type.
Play a Sound
This event can happen based on the standard notification rules, and can play anything that Windows multimedia sound function wants to play.
Clicking on the "Browse file" option when setting up this alert will lead to a default directory, which contains a few sound files that are included with the installation of PingPlotter. Clicking on the "Test Call" button will play the sound file that has been selected.
Send Email
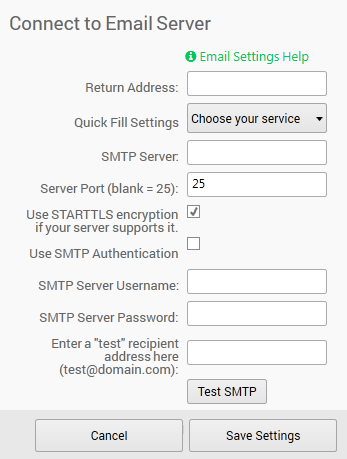
Before you can create an event to send an email, you must configure your SMTP server and return email address. Note that your SMTP server must be accessible on the network to be able to send emails, so it's possible a network failure may not be able to email you. PingPlotter will continue to try to send emails once a minute until it is able to get an email out.
Emails are a bit more complicated to set up than most Event types – as it is dependant on your SMTP server, and you don't want to be overwhelmed with emails when conditions are bad, but you *do* want to know what's going on.
First off, you can fire emails based on the standard PingPlotter notification types. See the associated documentation for more details.
Send e-mail to:
This can be an individual email address, or a list of addresses separated by either a , or a ; (both work equally well). Please do not set this up to be someone at your ISP unless they have agreed that they want to see this information. A huge portion of getting problems solved is playing the game right, and overwhelming people with automated emails is almost certainly going to work against you.Testing and error messages
Many of the errors that occur during testing can be attributed to incorrect email setup – so go there and validate your settings.
Here are some specific knowledge base articles on possible error numbers:
Socket error 10053
Socket error 10060
Socket error 11004
Any Socket error is being generated by the SMTP server itself, not PingPlotter, so if you're getting an error number not listed here, or in our knowledge base, try doing a search on your favorite search engine to see if you can find more information about the error you're getting.
Log to file
The "Log to File" alert writes data to a text file whenever alert conditions are met.
Filename:
The filename is required to have a full path specified (for example: "C:\ppdata\Alert.log") in order to save the log file properly.Tray Icon Change
This is a great event to add to most of your alerts. It's helpful to be able to see if there's an alert condition under way, and a quick glance at the tray can let you know by using the event.
The notification will do one or both of the following:
Change default icon to red during alert conditions
If you already have PingPlotter showing in the tray, this will change the existing green icon and add red to indicate that an alert has fired. If you don't have PingPlotter in the tray already, then a red icon will be added to the tray. When the alert condition(s) are over, the icon will change back to blue.Popup message in tray
This shows a "balloon" message coming out of the tray. Not all versions of Windows support this message (ie: some versions of Windows 95), in which case no balloon will show. Only one balloon can be shown at a time, so the newest balloon always wins (a new balloon message will replace an older one).Web REST Call
When you create a Web REST alert event for the first time, you'll notice that there's a "place-holder" example already in place:

Add/Remove from Summary
This event type gives you the capability to place (or remove) targets into custom summary screens based off of their performance (which you can specify when entering your alert conditions). To set up this alert event, you'll want to be sure to have a custom summary screen already set up.
One of our favorite setups with this alert type is to have two events: one that will add a target to a custom summary, and another that will remove it. Using this alert, anytime a target starts to experience high latency (we have the alert set to look at the last 100 samples, and notify us if 50 or more are over 500ms), that target is moved into our "High Latency!" summary screen. If the target falls back under that threshold, then it's then removed from the summary screen. This gives us a quick view into any of our targets that are currently experiencing issues.
Launch Executable
This alert type gives you the ability to run any executable file type when the alert conditions are met. This allows users to create their own scripts, batch files, etc that can perform many actions.
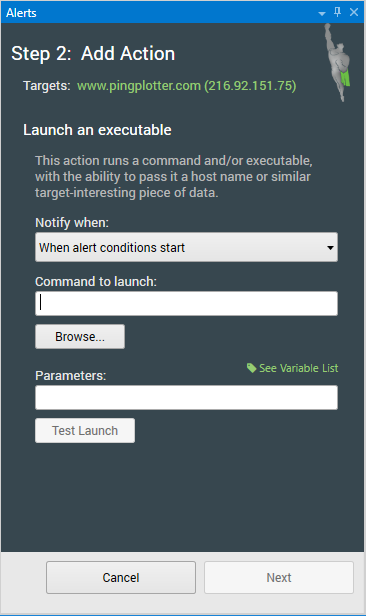
Command to launch
This is where users can select what will be executed when the alert fires.Parameters
If the command to be executed accepts parameters, users can add those here.Security Advisory
Due to the security implications regarding this alert event, when running PingPlotter as a Windows service, this alert event must first be enabled by a system administrator.Discovering a route between you and a target
Let's run through a basic scenario where we discover the route between your computer and an interesting destination (maybe one you're having a problem with).
Normally, when troubleshooting a problem, you want to run PingPlotter against the server where you're experiencing problems. Maybe that's a web server (in which case, you'll want to enter that web server's address); maybe it's a game server (in which case you'll want to enter that game server's address). If you aren't experiencing problems with your network connection or something you access with it currently, no worries! Just try and think of something you access regularly with your Internet connection (such as www.PingPlotter.com. or www.Google.com) to use in the exercise below.
We're assuming here that you've downloaded and installed PingPlotter. If you haven't, please see the Downloading and Installing PingPlotter section for instructions on how to do so.
So load up PingPlotter, and let's get started!
1. Enter the IP Address (i.e. 129.41.62.29) or the DNS Name (i.e. www.PingPlotter.com) of a destination you may be having problems with into PingPlotter's Address to Trace: input box. Note: we just want the name of the destination. You would not enter http://www.problemserver.com/index.html here. What we want is between the "http://" and the "/index.html."
For now let's leave all the other settings you see on the screen as they are.
2. After you've typed in the address, either press the "Start" button, or press the "enter" key on your keyboard. The trace then starts, and you'll see the upper Trace Graph populate with the route information to the target you entered. The Timeline Graph for that target will be displayed also below the Trace Graph.
One thing that is kind of an 'ah ha!' moment for a lot of first time PingPlotter users is seeing that you really do have that many devices your network traffic passes through to get to web sites, servers, etc. If you click on a web page link, that 'click' is passed on by all those hops to that final web server/page, that web server executes that click, passes the information back to you through all those hops and you see it on your browser.
It's important to cover the concept of a "Sample Set," because we're going to be mentioning it a lot. The sample set is defined by the "Focus Time" value (which is right under the "Address to Trace" and "Trace Interval" fields). The "PL%" and "Avg" columns in your trace graph are all computed off of this number. If this value is set to 10, PingPlotter uses the last ten samples it's done and bases everything off that number. If it's set to 20, PingPlotter uses the last twenty traces it's done, etc. As we go through what you're actually seeing on the graphs, just remember that the "Sample Set" is based off the value in the "Focus Time" value, and that number represents the number of samples - starting with the most recent and working backwards.
Some things to consider before we move on:
- We cover what's "normal" for latency and packet loss in a knowledge base entry at http://www.pingman.com/kb/42
- If you get a "Destination Address Unreachable" message at the last hop in the trace graph, this means something between your computer and the final destination isn't receiving and/or returning packets. We cover this in detail in the PingPlotter section of our knowledge base at http://www.pingman.com/kb/8. If some hops are responding, you might try using a different target address (i.e.: try www.PingPlotter.com instead of the address you entered the first time).
- If the final destination is working (i.e.: the Round Trip row is showing), but some of the earlier hops are not, then don't despair! This could be normal. See knowledge base articles http://www.pingman.com/kb/24 and http://www.pingman.com/kb/29 for possible causes of this behavior.
- If you're entering an IP address and would like to "label" that address, or give it a "friendly name" to make it easier to find in history later, you can do that by entering the IP Address, then a space, and then the label. For instance, if you have a core router that you'd like to see displayed in PingPlotter as "Core Router" (minus the quotes), you'd enter it as "192.168.0.1 Core router" (omitting the quotes and substituting the 192.168.0.1 for the IP Address for the actual IP Address for your router). For more details on this, see http://www.pingman.com/kb/23..
For the first example, you're getting intermittent packet loss to www.nessoft.com. What can we determine from the graph below?
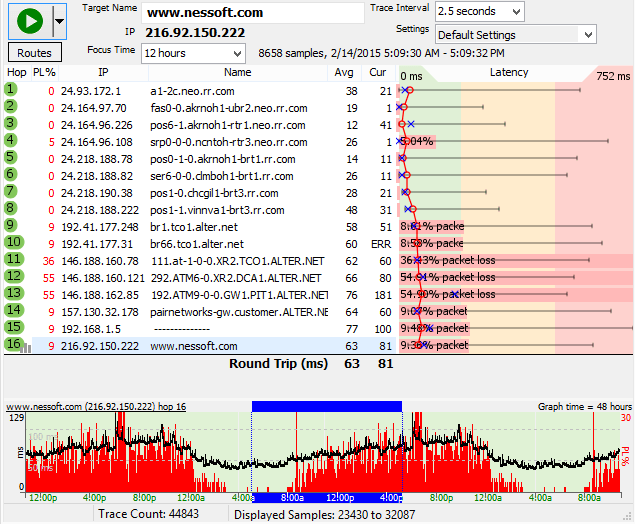
Hop 4 shows 5% packet loss. Hop 5 doesn't show packet loss, though, so you know that the problem in hop 16 isn't because of hop 4. Hop 4 is likely just a router using a different CPU path for TTL=0 packets than it does for routing data through.
Hop 9, however, shows 9% packet loss, and this packet loss is carried on through to the final destination. This is a huge indication of where the problem lies.
Now, all we know from this is that the problem happens after hop 8. We don't know if it actually happens because of CPU overloading in hop 9, a router problem in hop 9 (or even on the exit side of hop 8), or if it's the connection between hop 8 and 9. A little bit more troubleshooting is needed for this.
Digging deeper, we can see (from the domain names) that hop 8 is in the rr.com domain, while hop 9 is in the alter.net domain. Also, the IP addresses show decidedly different ranges. This is a strong clue that it's actually the connection between hop 8 and 9 that's causing the problem. It's likely that there's not enough bandwidth between those two locations.
Finding the source of the problem
We learned how to do a basic PingPlotter trace in the previous exercise. What we want to do now is take a pre-prepared save file that contains about 2 ½ days worth of fictional data and do more hands-on work with PingPlotter.
First off, you need to get the data file downloaded for this exercise. The file you need to download is at www.pingplotter.com/gsg/www.nessoft.com.pp2. Save this file to your desktop so it will be easy to find (of course you can select another location - just remember what you specified).
Load up the save file in PingPlotter by going to "File" -> "Load Sample Set," and then browse to your desktop (or wherever you saved the nessoft.pp2 file) and select the www.nessoft.com.pp2 file, then click the "Open" button. Ta da! Two and a half days worth of data for us to play with.
Let’s go over some concepts concerning the Timeline Graph.
- Let’s start out with this concept – red on a graph is bad. All those red lines you see on the Timeline Graph indicates Packet Loss for that particular time period. Remember, that means that PingPlotter didn’t get an answer back. There are times where you could have a flaky router, or even a server that is de-prioritizing ICMP packets. If you’ll remember from the How PingPlotter Works section, this is how PingPlotter gets its information. You could have a perfectly fine connection through that router, but PingPlotter will show it at 100% packet loss. For the most part though, when you see red on the Timeline Graph it means PingPlotter wasn't able to get to that server.
- The black line on the Timeline Graph is average latency for the time period you’re looking at. When you zoom in on the graph throughout the next two steps you’ll be able to see the individual pixel-wide points on the graph.
- The default Timeline Graph scale is 10 minutes - but what if we want to see more? Right-Click with your mouse button on the Timeline Graph, and you’ll see that you can show anywhere from 60 seconds on up to 48 hours worth of data within the Timeline Graph. Go ahead and select 6 hours. Notice that you’re now looking at six hours worth of trace data.
- The "focus area" on the Timeline Graph (which is brought up by double clicking anywhere on a timeline graph) shows you the current sample set that you’re viewing.
You can change the focus of the Timeline graph, and subsequently the data in the Trace Graph, by double-clicking on any area of the Timeline Graph you want to look at. In case you’re wondering, you can have an active trace going while you move around the Timeline Graph. You do not need to save the data, stop the trace or do anything else for that matter. Just double-click on the area you want to see.
Now change the Focus Time to 150 samples. See how the values in the Trace Graph change to reflect those additional 150 samples/traces? Change the Focus Time to ALL, or 0 (0=ALL in this context). Whoa! If you look at the Sample Set Time above the Trace Graph you’ll now see that you’re looking at a lot of data. In fact, you’re looking at all 44,843 traces, or ALL of the traces that were in the file we loaded. Your PL% and Avg columns in the Trace Graph now reflect all those traces. Now you can change it back to something smaller (100 is generally a good value to use).
- If you’re not there already, right-click on the Timeline Graph and set the time you want to see to 6 hours. To move back through the data you click-drag, or left-click, and while the left button on your mouse is held down you move the graph to the right. To move forward in time, you click-drag to the left. Are things starting to “click," as far as how you can move back and forth through time on the Timeline Graph? If you have a lot of samples to move through, do yourself a favor and set the graph scale accordingly (again, by right-clicking and choosing a time) before you do. For instance, if you’ve zoomed in to where you’re looking at 5 minutes worth of data and then need to go back twelve hours – set your graph scale to something like 3 or 6 hours before you start.
Hopefully by now you’ve been clicking all over the Timeline Graph, and seeing that the Timeline Graph does indeed change when you select a new sample set to look at. So how do you get back to the current time/date? Bring up the Timeline Graph’s right-click menu and select "Reset Focus to Current." If you don’t see that listed in your right-click menu….well, then, you’re already current.
At this point if you’re thinking, “Hmmm, this Timeline Graph stuff is cool, but I want to see a Timeline Graph for Hop 1 too!”, then today is your lucky day. You can do this by double-clicking on that (or any) hop - or by right-clicking and selecting "Show this Timeline Graph." Double-clicking again will hide that same graph. If you have a lot of Timeline Graphs open, clicking once on the hop for that Timeline Graph will cause that Timeline Graph to flash briefly so you can pick it out of the list.
Checkpoint
So let’s summarize what we’ve done, and what we know at this point about the Timeline Graph.
- You can change the scale by right-clicking and selecting one of the values listed.
- The focus area on the Timeline Graph shows you the current sample set, and you can change it easily to reflect the time period you want included in the Trace Graph.
- You can move around within the Timeline Graph by click-dragging or using the shortcut keys.
- By changing the graph scale, click-dragging then changing the scale back, you can zoom in and out of different time periods you want to analyze.
- PingPlotter tries to keep your "focus period" in view on the timeline graph, and you can use this if you're zooming in on a period. Focus the period you're interested in (double click on it), and then zoom in.
- If you want to get up to the very last sample set in a save file, or the last sample done if PingPlotter is actively tracing a target site for you, “Reset Focus to Current” on the right-click menu for the Timeline Graph will get you there.
- If you want to turn on or off visibility for a Timeline Graph for a hop, you can do so by double-clicking that hop, or by right-clicking on that hop and selecting “Show this Timeline Graph”.
- To quickly find a Timeline Graph for a particular hop, if you have a lot of Timeline Graphs showing for instance, click once on that hop and the associated Timeline Graph will flash.
Let’s apply and build on what we've learned and dig deeper.
The black line on the Timeline Graph shows you the latency over time. As you zoomed in on the graph earlier you saw that really what you’re seeing is pixel-wide entries that represent the round trip time, or latency for the host/device who's Timeline Graph you’re looking at.Red, on the other hand, represents packet loss (PingPlotter didn’t get anything back). We have numerous articles that go over different reasons why you could see packet loss in the Knowledge Base at www.pingman.com/kb. Our goal here is to help you understand at a basic level how PingPlotter can help you figure out why that loss is happening.
Packet loss, of course, isn’t the only thing that can cause poor performance for your particular application. The other big factor is latency. For online games, for instance, latency is a killer. Let’s review our sample data, and look at a trouble spot so we can learn more how to interpret what PingPlotter gives us that no other tool can.
Let’s look at the time period between 11am and 12pm on February 14, 2015. Let’s take the approach that we were browsing the web at that time and were running pcAnywhere into our computer at work. The pcAnywhere session goes to pot.

2. Change the Timeline Graph scale to 24 hours (remember: right-click then pick 24 hours), and then scroll all the way to the beginning of the graph
3. Take a look around at that time between 11:00 am and 12:00 pm. Double-click a time period somewhere around the 12:00 pm time. You'll notice the focus lines appear on the time graph, and the upper graph will show packet loss.
4. Wow, look at that packet loss! 13% at hop 9, 14% at hop 16. Notice how the packet loss is added at hop 9, and then all the downstream hops also show high packet loss. This is a strong (compelling, in this case) indicator that hop 9 (or the link between hop 8 and hop 9) is the reason we're seeing packet loss.
5. Notice the packet loss trending over time. This indicates some kind of time-based load problem. Also, the fact that the packet loss starts at the junction point between rr.com and alter.net indicates a possible problem at the connection between these two providers. It's possible that rr.com doesn't have enough bandwidth to service needs.
6. Let's turn on a couple more timeline graphs. Double-click on hop 9 and hop 8. Notice the difference in packet loss. Notice, too, that the latency is still relatively high, even at hop 8, and it's also showing time-based problems. Double-click on hop 1, and notice that that *to* also shows a time-based latency problem. This is a separate problem from what we're seeing at the hop 8 to hop 9 junction point! Looks like we should contact rr.com and find out if they can help us solve this problem!
7. Try zooming in on a problem-period by changing the timeline graph scale to something lower. When you see an interesting period, double-click on it to "focus" it, and then change the timeline graph scale to zoom in or out. This gives you a close-up view of the data with more detail.
Now, it should be noted that spikes on your graph may not be really high latency. A spike in the graph is high latency for that period displayed on the graph. The Timeline Graph auto-scales itself, so to see what that high spike is you need to look to the left-most part of the Timeline Graph. In this case the value we’re looking for is 87ms.
This was a really quick example of moving around within PingPlotter and digging out information about not only what’s going on with a connection, but really focusing in on a problem. Let’s move on now and talk about collecting this data over time and preparing a good case for your ISP (or someone able to solve this problem!).
Interpreting Results - Longterm Monitoring
The Scenario:
You're having outages (or situations you want to communicate to your ISP) randomly throughout the day (let's say twice a day). The problem is that you can't be there every time an outage happens so you can save a graph image.For this example, you're keeping 24 hours of data in memory or even more. We suggest that you normally use 2.5 second trace intervals and keep 200,000 samples in memory (this is almost a week's worth of data). You can change the number of samples to keep in memory in the Auto-Save section under the Edit/Options menu selection.
Using PingPlotter's timeline graph, you can see over the past X time period (see below) to identify a time period where there was problems. Problems will demonstrate themselves as packet loss (red), or high latency.
Now you want to show the route, and the packet loss/latency in the upper graph for that time period. Since that time has already passed, you need to change the focus of the upper graph to that time in the past.
Double-click on the "problem period" in the lower graph. You'll see a focus rectangle appear on the lower time graph, and the upper graph will change to represent the data you have "focused" in the lower graph. Once you've done this, you might want to change the scale of the lower graph to show more detail. Right-click on the lower time graph again and change the scale to an hour (or maybe even 30 or 10 minutes depending on how long the outage was). The focus rectangle should still be visible. You can fine tune the data being displayed in the upper graph by double-clicking on the lower graph again.
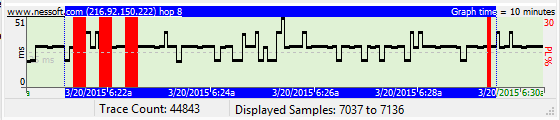
You can auto-save that data by for instance having the auto-save function in PingPlotter create new files every day, and then load up a prior day to do the same thing you did above for a particular time. This gives you the capability to have pretty close to 100% coverage of your network performance and be able to zoom in on any particular outage, period of slow response, etc.
The options in the alert setup do allow you to have the .PP2 file (trace data) emailed, and then you can use these same capabilities to zoom in on that data.
Interpreting Results - Gamers
The first thing you need is the IP addresses or DNS names for the two servers. You'll launch PingPlotter, enter the IP address of the first server into the Address to Trace box and click the Trace button. 2.5 seconds is a good value for the trace interval, and the # of times to trace should be unlimited (we're gonna watch it for awhile). Then, start a trace to your second server's IP address using the same settings you used for the first server.
You then go get yourself a Diet Pepsi, do some stretches or whatever in preparation for a night of gaming. When you get back to your computer you'll have two graphs that look similar to the ones below. Let's analyze both and see which server you want to play on.
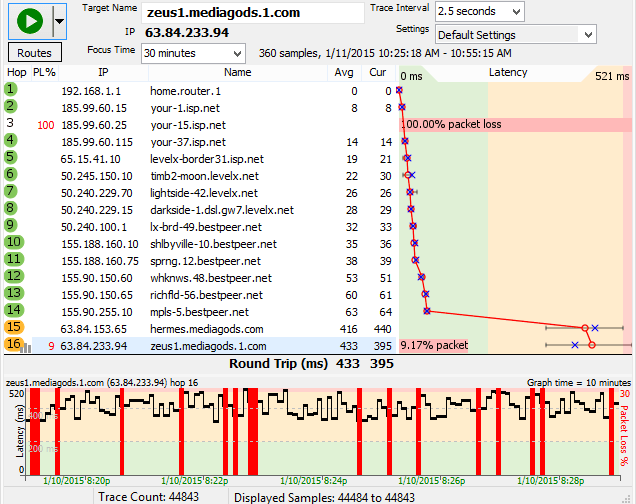
Red is bad. Every time you see red on the history graph you had a timeout, or in other words there's dropped packets. Packet loss is the bane for most online games. When you're running across a big open area and then all the sudden *blip,* you're on the other side (and most likely dead), that was more than likely caused by timeouts, or packets you didn't get to (or back from) the server. Besides the red lines on the history graph, you can also see your packet loss in the PL% column and, if you look at hop 16, the horizontal red line contains your packet loss value.
Digging a bit deeper, you can see that you're running under 100ms all the way down until you hit hop 15. Notice that you move off of LevelX's backbone into BestPeer between hops 8 and 9. No problem there, there's plenty of bandwidth between those two providers since the time doesn't really go up. From the DNS on hop 8, we can see that hop is a gateway (thus the "dsl-gw7" part of the name) to some DSL customers. Where we start running into problems is when we get off of BestPeer and hit the Mediagods domain that's hanging off the DSL link. All the sudden your latency goes up to 400+ms at hop 15. That DSL connection is busy. Once you make it to the server at hop 16, not only is your latency still way up there, but you're getting 9 to 10% packet loss. That server is a busy bee also it seems. So busy that he's not keeping up. Combined with the bandwidth saturation we're getting on the DSL line itself, it's best to try later. We don't want to play here.
Now let's look at our second server.
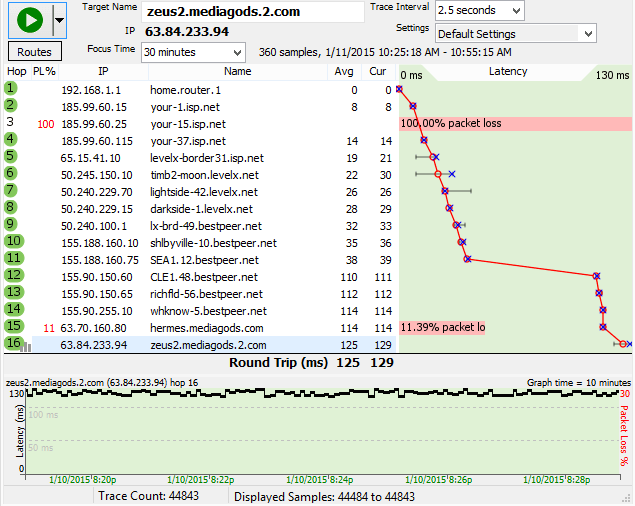
Let's look at that connection between hops 11 and 12. Notice from the DNS names that you actually go from Seattle across Global Crossing's backbone to Cleveland. When you factor in speed of light latency, you can account for about 40-50ms of your latency to hop 17 with that hop across the backbone between hops 11 and 12. So you've got a 120-130ms ping to hop 16. That's pretty good. If you didn't have that fat pipe installed (and were instead running a modem) you'd probably be running at about 220-230ms for your latency.
"What about that 11% packet loss at hop 15?", you ask. Judging from the numbers for that hop and hop 16, what we're most likely dealing with here is a router that probably has a low priority for ICMP packets. A lot of network admins will set a router up to drop ping/ICMP packets first if it starts getting busy - have a look here for more details
So which server are you going to play? Obviously it's the second server above.
Other considerations
Your graph results can be affected by a number of things that are out of PingPlotter's control.- In the analysis of the second graph above, we mentioned that hop 15 is more than likely just a problem with that router not giving us back good information. Many routers put a low priority on ICMP traffic. Others don't even echo back ICMP requests (this will show up as a blank entry for that hop). Obviously, PingPlotter has no control over these situations.
- PingPlotter can't track the route that your traffic takes on the return trip from the server back to you. If your inbound traceroute traffic is taking a different route back to you than the outbound traffic to the server, this is called an asymmetrical route. By definition traceroute doesn't take these types of routes into account and, unfortunately, PingPlotter isn't going to be able to tell you about problems with the return route in these cases. One clue that this is happening is that you'll have a great trace up until the last one or two hops on your trace. In other words, you don't have an easily identifiable problem at hop X further up the route that is mucking up the rest of the route downstream.
There are some sites that can do traceroutes back to you if you want to investigate on your own. They can be found here.
In closing, we can't emphasize this enough: latency is the bane of online gaming. Much more so than bandwidth limitations. The good thing is that PingPlotter can tell you this latency, and provide you with ammo in the way of trace and graph data when you're beating up on your ISP.
Interpreting Results - ISP Problems
Before continuing, if you're not familiar with how the graphs work in PingPlotter please make sure you've read the introduction to graphs earlier in this tutorial.
One common mistake we see folks make is that they'll trace to their ISP's border router. This is a bad thing. If you're tracing to the border router and your route changes (i.e. they take that router down for maintenance or you get load balanced onto another router) you really have no idea what happened. If you want to keep your traces local to your ISP, trace to an address that isn't going to change on you like you're ISP's mail server. This is actually a good thing to do if you're having mail problems and it's your ISP's mail server going down. Otherwise just pick a destination that you know has a reasonably good chance of always being up. This is a better choice since routes within your ISP can change, and PingPlotter keeps track of those route changes. The cool thing is that you're doing a traceroute here, not a ping, so even if that destination host goes down you can drill down on the timeline graph and see if it's your connection, or if it's just the destination being down (as in all hops but the destination don't show timeouts).
Another problem with tracing to your ISP's border router is that your ISP will not respect the data that you collect this way. No application targets a border, so they have no reason to trust this data. For best results, you want to pick a target that is one you use and are having problems with.
Note: For clarity, all the graphs below show us ignoring Hop 1 which you to can do from the View Menu. All the graphs were saved with the File/Save Image command within PingPlotter then converted to .gif for this tutorial.
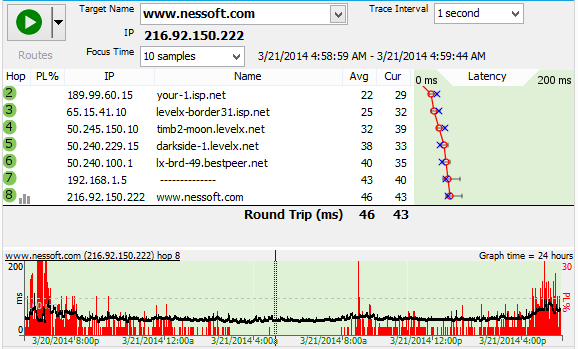
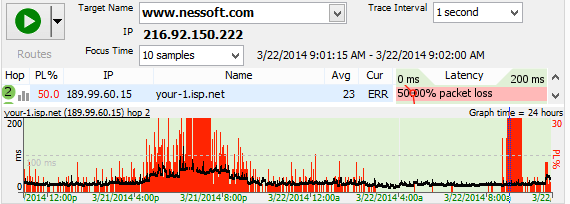
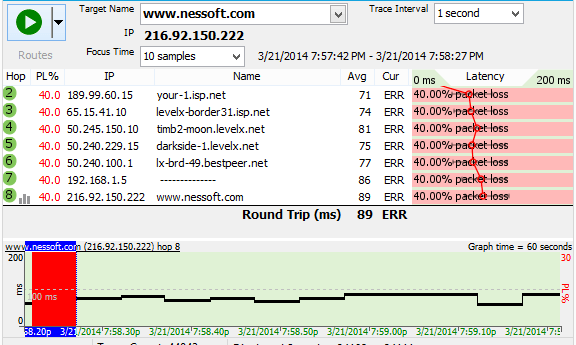
So in summary, PingPlotter allows you to show your ISP where the problem's are. In the these examples, we were essentially showing the whole link going down. However, we could've just as easily seen if the ISP's connection to the Internet was down at Hop 4, because we were tracing to a destination not on our ISP's local network. If there was indeed a problem at Hop 4, we would've had good trace data at Hops 2 and 3, timeouts at Hop 4 and possibly no trace data past Hop 4. If the router at Hop 3 was being flaky, and for instance you saw a lot of packet loss, it's easy to save an image showing just that so you can email it. When sending graphs to your ISP, we've found it's best to send one graph showing data for an extended time period, and then drilling down on the timeouts and sending graphs that truly show them what's going on. PingPlotter allows you to save in .png or .bmp format. We recommend .png because they're smaller.
Interpreting Results - Bad Hardware
Scenario: External customer has problems using your network resources.
A customer (not inside your network) has problems losing connecting to services inside your network. In this scenario, you are acting as a service provider for some network service. This might be provided via HTTP, or possibly through something like Citrix or Windows Terminal services.Your customer (possibly employees of your company, or maybe subscribers of your service if you’re an ASP-based service) is complaining of frequent disconnects, and possibly slow performance sometimes. How do you troubleshoot this kind of a problem? Where is the problem; at the entry point to your network, in the customer network, or possibly in one of the providers in between?
One way to pinpoint the problem is to have your customer run PingPlotter against your service. They can easily download PingPlotter, capture data, and then either analyze that data themselves, or email the data back for you to analyze. This information can be used to pinpoint which hop (or router) in the chain is adding latency or losing packets that might be causing problems back to your ASP.
Analysis:
Here’s an example extracted from a real-world customer situation. We’ll walk through some of the symptoms, collected data, then analysis and how we came to the proper conclusion.Our ASP (we’ll call the ASP "CitServeCo" - a totally fictitious company) is accessed via Citrix, which is relatively sensitive to high latency and packet loss. The customer (who uses financial applications served by CitServeCo) was frustrated by disconnects during the day, which lasted anywhere from a few seconds to a minute or two, interrupting their ability to do business.
The customer will almost certainly blame CitServeCo initially for a problem like this – but we need a way to determine where the problem is being caused, and help the customer solve the problem. Any reliable ASP will get numerous complaints like this – that they *know* are the fault of something beyond their control (like the customer’s cable connection, or similar). Most ASPs will attest to the fact that customer connections are a prime source of network problems, but we can’t just tell the customer "It’s your problem."
When the customer contacted CitServeCo, they suggested that they download PingPlotter, install it onto the workstation they normally work with, and configure it to monitor the Citrix server inside CitServeCo’s network.
If a disconnect or slowdown occurs in Citrix, we suggest to the customer that the right-click on the lower “time-graph” in PingPlotter and create a comment at the point that the problem occurred. This correlates real world symptoms with the collected PingPlotter data (a crucial part of the troubleshooting process).
A day of collecting data resulted in only a single disconnect, and the customer dutifully recorded that for us. They then sent us the saved data for analysis. Because PingPlotter data is already compressed, there is no need to .zip up the file, making it easier to send data.
Here is the result of that day.
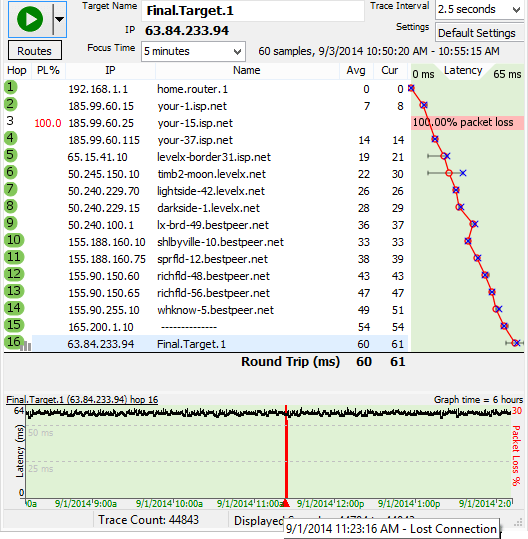
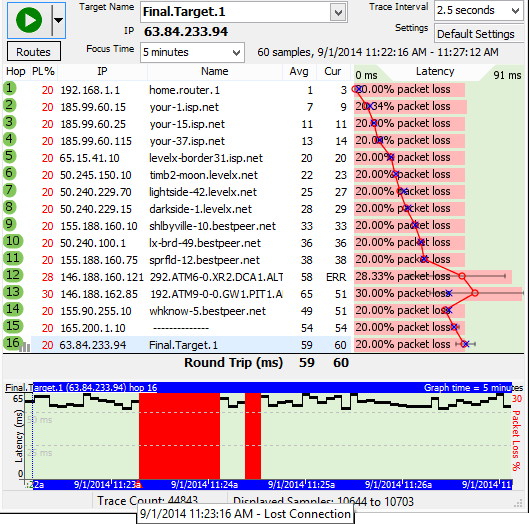
It looks like hop 1 lost just as many packets as hop 16. Since every piece of data needs to go through hop 1 to get to any of the other hops, a blockage there will look just like this. It looks like we’ve found a likely culprit – the router at hop 1, or possibly anything between the computer collecting data and hop 1. This might be as simple as a network cable, or it might be a significant amount of network equipment. We don’t know until we check with the customer to find out what’s here.
We asked the customer what kind of network hardware they have in place. While they were collecting this information for us, we had them continue to monitor their connection.
It turns out that all the computers at this location are hooked up to a "SOHO" router. This SOHO router is, in turn, connected to a cable modem provided by their ISP. From their ISP, the customer is uncertain as to the network configuration. We see some of this in the PingPlotter graph – a list of routers that are participating in sending data.
The customer was uncertain as to what the individual pieces of hardware reported in as, so we had them continue to monitor, but asked that they cycle the power for the devices if they had a disconnection problem. Several days later, they had an opportunity to do this, and captured the experience in PingPlotter.
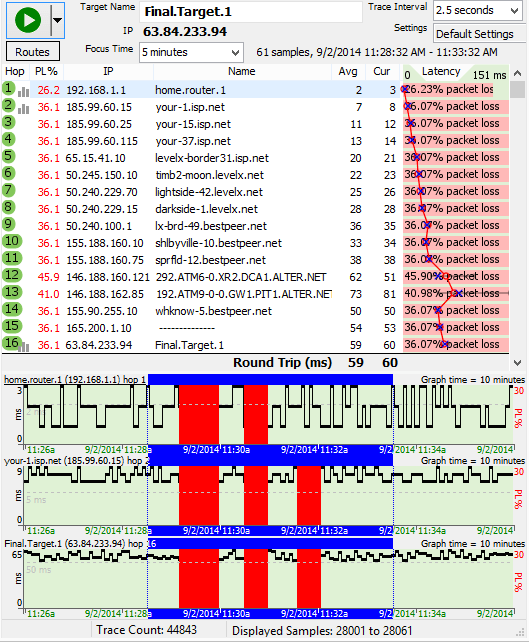
Maybe there was a bad power supply on the SOHO, or maybe a bad network cable someplace? The customer replaced the network cables, and the problem persisted. They then replaced the SOHO router and the problem was solved.
It’s not every case where the problem is so “in our control” as it was in this one. Sometimes, the problem requires talking an ISP into replacing some piece of their hardware, or replacing an ISP alltogether. PingPlotter can be just as effective locating the outages, packet loss, or latency on ISP equipment, though – it’s can sometimes just be harder to fix those problems.
Interpreting Results - Bandwidth Saturation
The scenario here is a 30Mbps downstream, 10Mbps upstream cable modem running a 2.5 second trace interval to our target. The computer running PingPlotter was connected to the cable modem via a wireless network card, which loses packets occasionally.
We're downloading a 2 gig file, and during this period the bandwidth of the cable modem should be completely saturated. This means that anyone else using this network connection is going to notice significant latency and possible packet loss. Any user might decide they want to troubleshoot this situation, and might run PingPlotter to do so.
A quick 10 minute trace might look something like this:
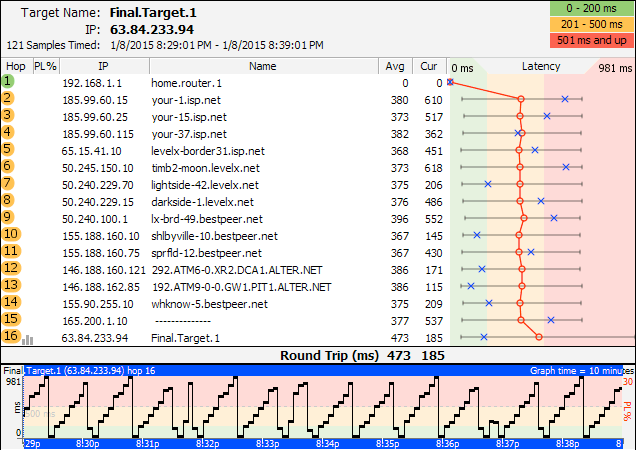
Now, the "Sawtooth" pattern in the timeline graph is a classic bandwidth saturation pattern. Anytime you see a pattern like this, think "bandwidth saturation". Keep in mind that bandwidth saturation is totally normal, and happens on just about every network. Consumer-grade DSL and cable modems have the highest chance of seeing a pattern like this, but it can happen on any connection where the bandwidth at a network point is being totally saturated.
Here is another example of bandwidth saturation (with more time shown on the graph):
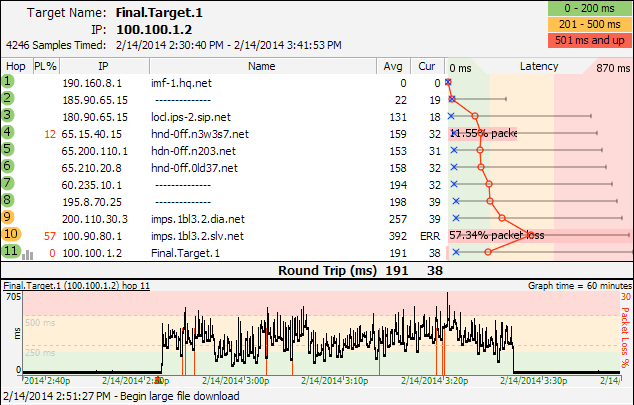
There are several solutions to the latency problem:
- Procure (buy) more bandwidth
- Don't transfer as much data
- Implement QoS
On your own network, the bandwidth saturation could be happening for a number of reasons: another user downloading something; temporarily restricted pipe size (problem with your Internet connection), p2p applications in use, or possibly even a virus/worm type application that is using bandwidth sending out new instances of itself.
In summary: Saturated bandwidth can be normal, and isn't always an easy problem to solve. It's often easy to recognize the symptoms though, especially if you look at the trend over time. PingPlotter can really help pinpoint the problem, giving you the ability to see trending over time, latency patterns short and long-term, and latency / packet loss correlations.
Voice over IP (VoIP) troubleshooting
Introduction
Using an IP Network (like the internet) to conduct a voice conversation (VoIP) is becoming easier and easier for people to do. It can be inexpensive and relatively reliable.It can, however, also be challenging - with poor voice quality, the inability to hear and communicate, delays and other problems.The underlying technology for VoIP is extremely network dependent. If you're having voice quality problems, the problem is often related to the network - maybe your internet provider or maybe some other component between you and the called party. This article will talk about some basic troubleshooting techniques that can be used to locate where the problem is occurring so you can make good decisions about how to solve the problem.
Network-related VoIP Symptoms
Many symptoms of VoIP problems are network related (although certainly not all of them). Here are some examples of symptoms that are often network related:- Garbled words ("blips" and clicks mixed in with the words)
- Parts of words missing
- Gaps where the other side is talking, but you don't hear any of it
- High "distortion"
- Delays between the time you talk and the other side hears you (and vice versa)
- You start talking not realizing that the other party has started talking already too, and you talk over each other for a few seconds
- Echo when you talk. This can be exacerbated by network problems, but constant echo is usually not caused by network problems.
- Inability to connect a call to some users while you can call others
Using PingPlotter to identify the source of network problems
PingPlotter has some unique capabilities in its ability to help you track down the source of network problems. What you really want to know is:- Can you fix the problem or do you need to call someone else to fix it?
- If you need to call someone else, who do you call? Your ISP? Your VoIP provider?
- When you call them, how do you convince them it's their problem to fix?
Collecting data with PingPlotter
Before we can do much analysis, we need some data to analyze. We cover some of these topics in earlier manual entries, so we won't cover *details* of how to set things up here.First, we need a target server to monitor. Ideally, this would be the actual VoIP server of your VoIP provider, or something on the same area of the network. If you called your VoIP provider and they asked you to collect PingPlotter data, they may have given you a server to use. In many cases, the use of any server can work, but this will only identify problems with your ISP - not with your VoIP provider. The good news here, though, is that the vast majority of VoIP problems are because of front-line service providers (like your ISP). If you don't know what address to use and you have no way of finding out what address your VoIP hardware or software is using, try using the web site of your provider.
For this discussion, we will be a fictitious server (Final.Target.1) as the server we're monitoring and using for troubleshooting.
In your instance of PingPlotter, enter your VoIP server (or related target in the "Target name" field, and set the trace interval to 2.5 seconds. Now, hit the "Trace" button (or the "enter" key on your keyboard), and you should see a picture appear that looks something like this:
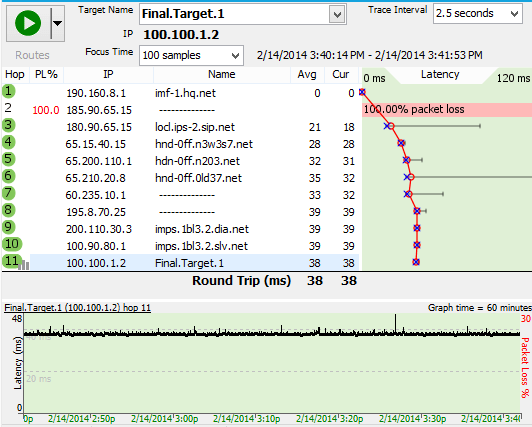
Now, let this run for at least 30 minutes - preferably, during a period where you're making a voice call. Ideally, you'll have a period where you have a voice call that's good and one that's bad, but that might be possible. If nothing else, just let it run for long enough to get a good sample of your network conditions.
A great thing to do while you're collecting data is to make notes in the PingPlotter data about what you're experiencing. You can see instructions on how to do this in our Timeline Graphing entry under the "Creating Comments" section.
The data we collected covers several days. PingPlotter works great to just run over a long period of time so you get a good idea of what network conditions look like - during good times and bad.
Examining data with PingPlotter
Once you've collected some data, it's time to have a look at what might be the problem. We cover some of the PingPlotter commands on zooming, focusing and digging in the Finding the source of the problem section.One of the key things to know here is that we're looking for problems at the last hop only - and then using the other hops to determine where the problem starts. Packet loss or latency that shows up only at an intermediate hop is not a problem!
Let's look at the graph above. Notice how hop 2 has a full 100% packet loss? The final destination looks rock-solid, though - no packet loss and the latency, and it is mostly nice and smooth. This is, in general, what you want to see - a mostly flat line at the final destination, no packet loss (red lines in the time graph).
So, what are we looking for, when it comes to problems?
The first place to look is the final destination. If the time graph looks like the graph above (straight line, no red), then PingPlotter is not finding network problems. Look for problems at the final destination. If you find a problem at the final destination, then look back until you find the first hop showing similar symptoms - that's who we probably need to contact to get the problem corrected.Example: Distributed packet loss
Let's look at an example, this time an example with problems: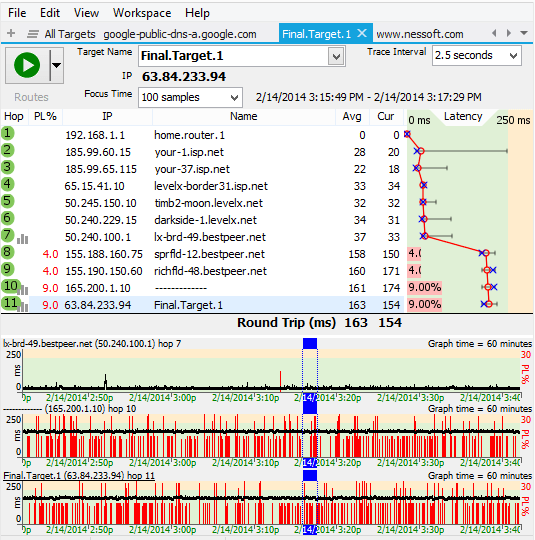
Notice how the packet loss is happening at all hops from hop 8 onward, while hop 7 looks relatively good. The packet loss percentage fairly similar all the way down (although, statistically, it would be just about impossible for all hops to have identical packet loss percentages with this kind of loss). To turn on and off time graphs like this, just double-click on the hop number in the trace graph.
So, in this situation, the problem looks to be between hop 7 and 8. It's pretty likely that Bestpeer knows about this problem - it's in the "middle" of their network - and it's all owned by Bestpeer (we can see that from the DNS Name column).
In this case, we would need to contact Bestpeer about this problem. The picture above is pretty compelling and would be a good communication tool to them.
Example: Local bandwidth saturation
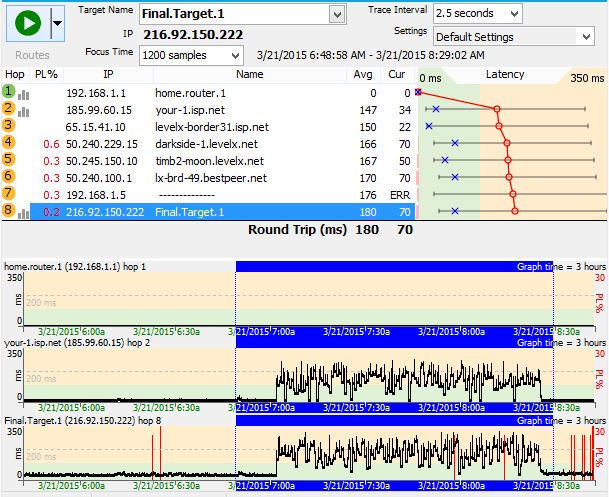
This is a case where we were transferring too much during this period - and we were using all of our available bandwidth. A VoIP call would suffer significantly during these periods - there is a lot of jitter (the "ragged" line is an easy way to see jitter - where packets take different amounts of time to arrive), higher latency and some packet loss. The voice quality would be bad, there would be additional lag, and it would probably have audio drops.
There are a few options for solving this one, but none of them involve complaining to anyone else:
- You can install a traffic shaping modem that gives higher priority to VoIP data (actually, unless you've configured PingPlotter packets to look like voice data, you might already have one of these in place - this article does not cover that topic, though).
- You can get more bandwidth (although that doesn't solve all problems - as you'll still be able to use all your bandwidth).
- You can use less bandwidth.
- You can get an additional broadband connection and dedicate it just to VoIP (this is an especially good idea for heavy VoIP users or businesses). The low cost of an additional broadband connection makes this viable in a lot of situations.
Example: Border congestion
Congestion often happens at network borders - where one network hands off to another. This is relatively common for small, growing ISPs - where they just do not subscribe to enough bandwidth to handle everything. Let's have a look at what this condition might look like.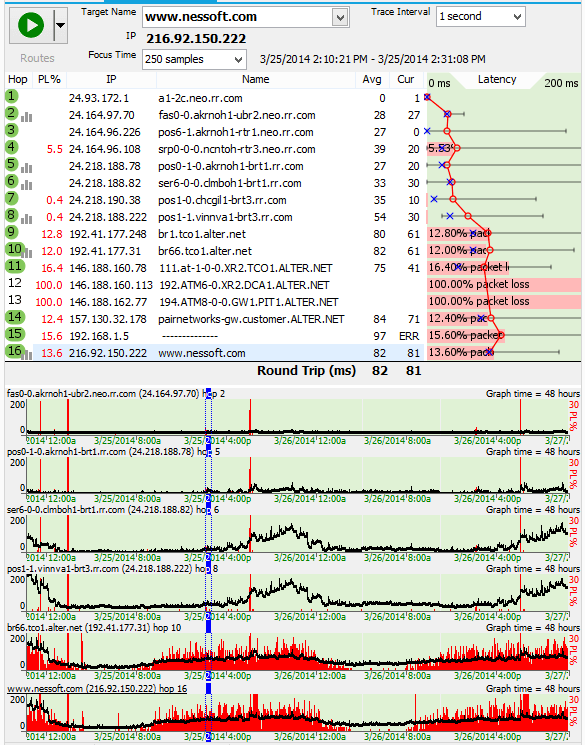
- During high load times, this connection would be completely unusable for VoIP. With 14% packet loss and really high jitter, this would be absolutely horrible for any kind of voice call.
- During the early mornings and late evening, it would be *bearable*, but the jitter would cause the words to be garbled sometimes, and not too fun.
An interesting part of this is how during heavy load times for home users (ie: evening hours), the packet loss and latency are worse. During early morning hours, it goes back to being OK again. This is a big sign that the problem is load related - and that this link is having congestion problems at "rush hours". Time to add some lanes!
Another problem, though, is inside the rr.com network there is significant latency and jitter. There are some slight symptoms at hop 2 (which is the border between our internal network and rr.com - so that's the cable modem), but starting at hop 6 there's some real bumps in latency and the jitter (latency variation) is also a big cause for concern.
In this case, both problems are inside the rr.com network, and since we are an rr.com customer, we would call them for help on this.
Example: 802.11b network near its range limit
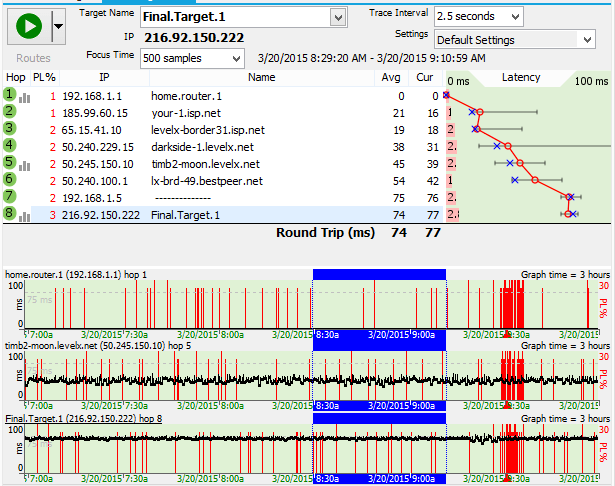
Here, we see a little bit of packet loss being added to every hop - our wireless network is losing a few packets (about 1 to 2 percent, it looks like), and this impacts everything this computer does - including our VoIP connection.
The call quality would be generally good here (probably better than acceptable - up to the "good" range, really). The latency is fine and there is very little jitter, but there is a little packet loss. There is a problem, though - at 9:31am, our call was interrupted - it looks like hop 1 lost a bunch of packets all together and during that period, we were unable to hear anything. Let's zoom in on that a bit.
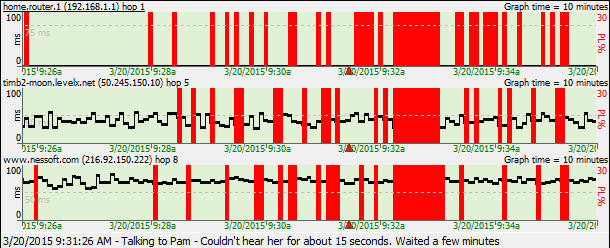
Here, the solution might be to move the wireless access point, or switch to wired on that computer.
Reporting problems, when you find them
If you're using PingPlotter, it's almost certainly because you're experiencing some kind of problem - and when you find something that you think might be the cause of that problem, you need to communicate that to the right party.We cover this topic in some depth in our Getting Started Guide. The piece we want to stress here is that the data in PingPlotter doesn't really mean anything unless you correlate it with a network problem (like poor VoIP quality). It's of paramount importance that your complaints include a description of how this problem is affecting you. Don't just send a graph from PingPlotter expecting them to be able to figure out what was wrong.
One great way of doing this is to put comments in the PingPlotter graph itself using the "Create Comment" feature of the time graphs. Make comments every time your VoIP quality is bad. Make comments when you give up on a conversation because they can't hear you at all (but you can hear them just fine - how frustrating!).
Troubleshooting PingPlotter
If you get "Destination Unreachable" at something beyond hop 3 or so, but can access that site via a web browser.Some sites do not respond to ICMP echo requests. See our knowledge base article for instructions on how to configure PingPlotter to use TCP packets instead of ICMP.
If you get "Destination Unreachable" at hop 1 for all targets
Make sure your software firewall (ie: ZoneAlarm, etc) is configured to allow PingPlotter to have access to the network.
If you only have the final hop visible - and all intermediate hops are empty
We cover this in this knowledgebase article.
Other questions
JitterJitter is the amount of variation in latency. If one packet takes 100ms and the next one takes 200ms, there's 100ms of jitter there. PingPlotter Pro offers jitter calculations and graphs, but PingPlotter Standard (and the 2.x line) still gives you an easy way to see the jitter by looking at the smoothness of the time graph, zoomed in a little. Here's an example:
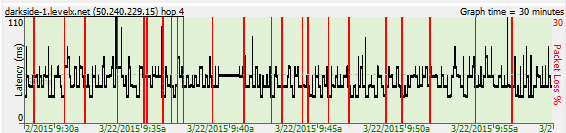
Other resources
This article introduces some concepts and ideas about VoIP troubleshooting. There are other resources online that provide more depth (albeit not within the context of PingPlotter).
www.whichvoip.com/voip-troubleshooting.htm - a great page with real-world solutions and suggestions. Targeted to residential, but useful everywhere.
www.voiptroubleshooter.com is a great site that has an enormous amount of content on which symptoms relate to what kinds of network problems. This site has a relationship with Telchemy, a leading VoIP provider of call quality monitoring tools.
Building a Compelling Case
In this section, we'll show you how to use some of the tools in PingPlotter to collect data, save and reload that data, and then cover areas to focus on to make a really convincing story.
A convincing story (when using PingPlotter to document a network problem) is one that has some (or most) of the following attributes:
- Correlates the problem description (i.e.: bad VoIP quality or slow game performance) with the supporting data (i.e.: packet loss in PingPlotter).
- Is clear about the actual problem being experienced. Bad PingPlotter data is meaningless unless there is some impact to other applications. Make sure you describe the affect this problem is having on your network experience.
- Includes solid supporting data, covering at least a few minutes and possibly several days
- Does not exaggerate the problem or the data. You can certainly zoom PingPlotter in to only the very worst 10 samples you collected, but that doesn't give a realistic picture of the problem
- Is concise and not argumentative.
Because many ISPs and providers don't give copies of PingPlotter to their front-line support technicians, you probably won't be able to just send a PingPlotter save file for them to analyze. You'll need to create an image they can easily see in their email, or attach to their support case.
Sharing information about your network
Showing PingPlotter graphs to the people you're working with is an excellent way to strengthen your case.PingPlotter's sharing service is the easiest way to show someone what you're seeing on your network. The service posts a screenshot and data file online. From there, you can share the link with the people you're working with to give them a look at what you're seeing.
If you need a sharing service alternative, you can use the "Save Image..." option in the File menu or the "Copy as Image" option in the Edit menu. Both options provide offline ways to show people your PingPlotter results.
IPv6 and IPv4
If you know specifically which protocol you want to use, you can prefix the name with the IP type, like this:
ipv4:www.google.com
or
ipv6:www.google.com
If your computer supports that IP type, then PingPlotter will use it. If not, you'll get an error.
Raw TCP sockets and WinPcap
TCP traceroute allows access to some targets that were not previously available, but this comes with some caveats.
One challenge that many users will face is that most operating systems today (all Windows versions XP or newer) block the ability to create TCP packets with the options needed for traceroute. See a Microsoft white paper for some more details on this.
The best way to get around this problem is to use a custom network driver. PingPlotter supports the use of WinPcap (and spinoff/clone variants) for this.
How to install the driver
Install steps:- Visit the WinPcap site so you know what you're installing.
- Download the driver. We recommend using the latest version. If you're using Windows Vista x64, then 4.0 or higher is required.
- Install the driver. The WinPcap download page has reasonably good instructions. Basically, run the installer.
- Use the TCP packet type in PingPlotter.
- You're done!
Shortcomings with WinPcap and PingPlotter
WinPcap allows PingPlotter to send packets directly to the network card. This is very powerful, but also means that the Windows protocol stacks don't help us with routing or validation of the packet. PingPlotter should do a good job with detecting if a gateway should be used and sending to that gateway, but might not work correctly with multiple gateways, or other complicated network setups.If you're not running as administrator (or using PingPlotter as a service), then you'll need to configure WinPCap to start automatically (which is its default install mode).
Tracing from a remote server
Using a remote server as the source of the trace
The basic concept of the remote trace agent is that it resides on a remote machine listening for a request for data from your local PingPlotter instance. When it receives a request, it does a single traceroute and returns the results back to PingPlotter, which then collects this data and displays it locally like any other trace data. The interval at which PingPlotter contacts the remote agent is controlled by the sampling parameters (trace interval) you've defined locally.
When using a remote agent, PingPlotter works and looks *exactly* the same as it does when you're using the local engine. Essentially the only difference is that the trace isn't originating from the workstation running PingPlotter, but instead the agent is allowing you to source and see the traceroute from the vantage point of the machine running the remote agent. You can even see the results from multiple remote sources/agents by defining and using Named Configurations.
Example:
Lets say that we have three offices: a "main" office in Boise, a branch in Amsterdam, and one in Tokyo. With a single instance of PingPlotter running at our Boise office, we already know that we can monitor the connection between us, and the other two offices. We can also monitor our connection from the Boise office to our business and VoIP server.When using remote agents deployed on machines in both the Amsterdam and Tokyo office, we can now also measure the connection from both of those offices to both the business server, and VoIP server as well - all from the single instance of PingPlotter that's running back at our headquarters in Boise!
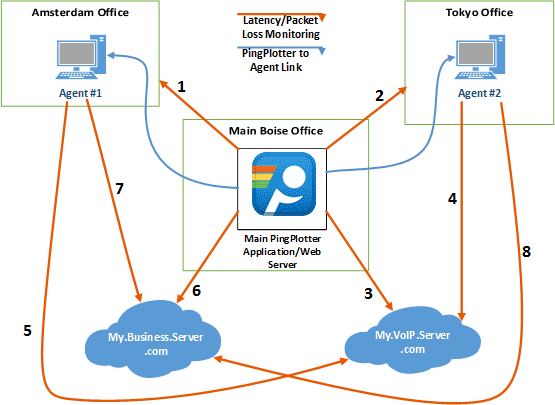
Our summary screen in PingPlotter would look something like this:
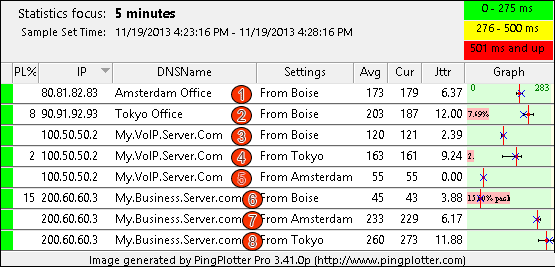
Requirements:
- PingPlotter version 3.10.0p or higher, installed.
- A Windows XP or higher workstation (Windows agent), or a UNIX machine with Apache, perl, and appropriate permissions (UNIX agent).
Installing the Windows Agent
The PingPlotter remote agent for Windows is a self-contained executable that includes a small server and some portions of the PingPlotter core trace engine. This agent can run as an application or as a service under Windows XP or newer.Note: Presently the Windows agent does not come packaged with an installer or uninstaller.
- Download the Windows remote agent from the agent download page.
- Extract the agent (PingPlotter_Remote_Agent.exe) to a working directory (e.g., c:\Program Files\PingPlotter Remote Agent).
- Browse to the directory where you extracted the agent and launch it. The agent will show up in the system tray.
- Ensure your firewall(s) allow access to the agent on TCP port 7465, or change the server port for the agent. To change the port, as well as other settings for the agent, double-click on the tray icon.
- From your PingPlotter machine, launch your web browser and access the agent at http://(your agent machine name):7465.
- Verify the output. It should look something like this (in your browser):
PingPlotter Pro Remote Windows Agent V0.8.2.18
Tracing to:
Error: Must specify an IP Address
Continue on to the Configuring PingPlotter to use a remote agent section.
The windows agent has a few options, to see about its use, see the configuring the Windows agent section.
Installing the UNIX Agent
The PingPlotter remote agent for UNIX is a perl or php script that uses the UNIX traceroute command to gather sample set(s) and pass the results to PingPlotter via a web server. Because of all the various flavors of UNIX that exist, and the possible differences when it comes to output of the traceroute command, you may need to modify the script for your particular source machine. We've primarily tested under FreeBSD and Debian. Contact us if you have problems here.- Download the unix agent script from the agent download page.
- Extract the perl script (trace.pl) or php script (trace.php) into a web-accessible directory on a UNIX web server that is capable of serving the appropriate script.
- If necessary, set the script to be executable by your web server, (chmod 755, or similar, and don't forget to check the permissions for the directory).
- Test it from a web browser to make sure it's accessible. Example: http://www.yourwebserver.com/pp_pro_agent/trace.pl (or trace.php if you're using the php version).
- Test a full trace from the web browser. This requires the ?IP= parameter (?ip=parameter will fail, the 'IP' needs to be capitalized). This would look like this to trace to 192.168.1.1: http://www.yourserver.com/pp_pro_agent/trace.pl?IP=192.168.1.1 Ideally you'll want to use a valid IP address here, of course - one that works on the remote agent's network.
- Verify the output. If it's working, you should get output that looks something like this:
PingPlotter remote trace agent, V0.4
1 192.168.1.1 0.684 ms
You'll probably have more hops than this. This is just an example if you were using an IP local to your server.
- If you have an error, look at the source code for the script for some different alternatives and help.
Configuring PingPlotter to use a remote agent
Once the remote server(s) are configured, we need to set up PingPlotter so it knows about those servers.Creating a named setting (configuration) to use a remote agent.
Named configurations are covered in more depth in the named configuration section.- Go back to the options dialog (Edit -> Options).
- Create a new configuration (Right-click on the "Default Settings" in the tree view and select "New Configuration").
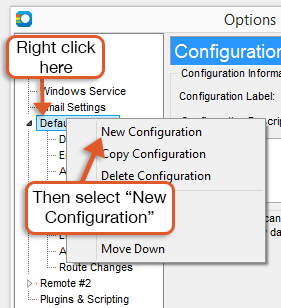
- In the newly created configuration, change the name in the main section (e.g., "via <your server name>").
- Go to the "Engine" section of this new configuration and select "Trace via Remote Server" from the dropdown.
- In the new section "Remote Server Source Settings", Enter the URL to the trace agent there. For a Windows based agent, the URL will look like this: http://yourservername:7465/. For a UNIX-based server, the URL will look something like this: http://yourservername/script_path/trace.pl (or trace.php, if you're using the php version).
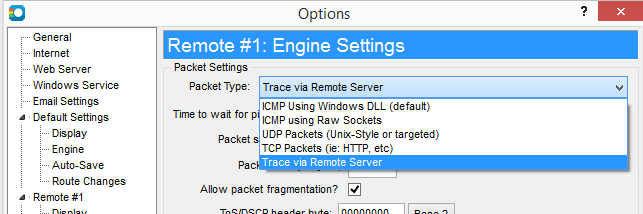
- Hit "OK" to close the options dialog and save your settings.
Usage Instructions
Now, on the main PingPlotter screen you'll see a "Settings" dropdown below the "Address to trace" field. Pick "via (servername) ..." there (or whatever you named your configuration). Enter your target, and then click on the Trace button.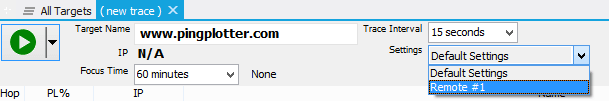
Warning: Your tendency will be to pick a server very familiar to you, which in a lot of cases is going to be the same server you just set up the script on. If you do this, your trace will only be one hop long!
Error handling and troubleshooting
A remote agent adds additional complexity to any deployment, and PingPlotter's is no exception to this. In an attempt to keep things as simple as possible, and still satisfy our needs, we use existing technologies - web servers, http, existing command-line tools (for UNIX, where good ones exist), etc.This means that in most cases we're dealing with familiar territory when troubleshooting. All the remote agent capabilities can be accessed via a web browser. If PingPlotter is having problems reaching a remote agent, then you can use your web browser to check and verify. You can also use PingPlotter (not the remote agent) to constantly monitor the availability of the server and route to the remote agent.
If the remote agent is inaccessible for some reason, there is a network failure between the PingPlotter machine and the agent for example, any alerts you have configured will not fire. If you want an alert to fire, you need to set up PingPlotter to monitor the agent machine itself.
There are a number of configuration challenges that might hit you here, but these should be familiar to you if you've done much network and/or application troubleshooting. ZoneAlarm, for example, might block access between PingPlotter and the agent machine. Other firewall issues could also come up. If you view the remote agent as a web server, the troubleshooting techniques you've used elsewhere should help you here too.
If PingPlotter is unable to reach the agent, because of an authentication problem or network failure, the error will appear above the trace window on the targets it applies to. This message might be an HTML error (e.g., 401 authentication failed), or a network failure message. These events will show up in PingPlotter's time graph the same way a route change does, with the background color on the time graph matching background colors elsewhere rather than having the graph scale colors painted on.
Notes, thoughts, shortcomings...
The Windows agent uses a fully threaded engine to make working with it just as responsive as working with the local engine (if there is a timeout, other hops will still report back). For the UNIX agent, though, if hop 1 times out hop 2 won't report back until the timeout period has elapsed. This means there may be times, when the trace interval is < 5 seconds, where you see empty spots in the data that later fill in with a lost packet or a good sample. Everything works, just the results get delayed a bit. The Windows agent shouldn't have this problem.Configuring the Windows agent
Because the Windows agent is a full-fledged server unto itself, you may want to have it behave differently depending on where you're installing it.Server Port
The default server port of the Windows agent is 7465. If this doesn't work for some reason in your network, you can change it by right-clicking on the tray icon and selecting the "Settings..." option. Clicking on the "Apply" button makes that change immediately, and if the server is unable to start on that port an error will occur.
Security
You might not want to expose the agent to anyone or limit access to it. This can be done via the username / password settings in both the agent and the remote trace setup in PingPlotter. The authentication system uses standard HTTP basic authentication. If the agent requires a username / password, and it doesn't match what's specified in PingPlotter, an error will show up in PingPlotter. If no username or password is required by the agent, then the username / password settings in PingPlotter will be ignored.
Running the agent as a service
If you want to be able to trace from a machine at any time, you can install the agent as a Windows Service.To install as a service, browse to the agent's install directory using a command prompt and then enter the following command:
PingPlotter_Remote_Agent /install
After doing this the agent will show up in the control panel services applet, or you can start the service manually with this command: net start PP_RemoteAgent
To uninstall the service (remember that because there is no installer / uninstaller for now, you'll need to manually remove it), stop the service, then run this command:
PingPlotter_Remote_Agent /uninstall
You can also use the "/reinstall" parameter to register the agent in a new location.
If any of these commands have an error, then you'll get a popup message telling you about that error. If you have no errors, then the command will complete with no popup messages. If you do get an error, you can check in the "PP_Remote_Agent_error.log" file to see what the error was.
Note that under Windows Vista and newer, you will not have access to the user interface when running as a service. For best results, stop the agent, run it as an application to change its settings and do testing. When you have everything working the way you expect, close the application and restart the service.
Configuring the UNIX agent
The UNIX agent is much simpler (more primitive?). It's a perl or php script that runs the traceroute command and shows the output on a web client. Because it uses an existing web server, all the settings need to be configured on that server including the server port and security.Security
Because PingPlotter uses standard basic authentication to secure access to the agent, you just need to password protect the agent application using an .htaccess security setting (if you're using apache, which most people are). PingPlotter will send the username and password to the web server using this protocol, and it should all just work.Command Line Arguments
You can have PingPlotter do a few things automatically on startup by specifying command line parameters. You can put these parameters in a shortcut - or enter them from a DOS command line window.
PingPlotter.exe [File to Load] [/TRACE:[Address To Trace]]
Loading a file at startup
If you enter a parameter without a / on it, PingPlotter will try and find a file by this name - and load it if it's found.Example:
PingPlotter.exe www.pingplotter.com.pp2
/TRACE
This option will start tracing automatically when PingPlotter loads. If use the option to load a save file on startup, then tracing will begin to this address. Otherwise, Add a colon (:) and the IP Address or server name you want to trace to.Example:
PingPlotter.exe www.pingplotter.com.pp2 /TRACE
or
PingPlotter.exe /TRACE:www.pingplotter.com
/?
Show this help screen.Example:
PingPlotter.exe /?
Ping Speed Test
BalasHapusGo Look Importantbook: Switch And Network And Wireless ( Ping ( Personal Identity Network Grew ) ) When The Connection Is Saturated Or Slow Need To Restart Again For Better If Then If As Like As Switch And Network And Wireless When The Connection Is Needed Restart Or On - Off - On Again Amnimarjeslow Government 91220017 Xi Xa Pin Ping Hung Chop 02096010014 Ljbusaf Switch ( Short Wave Interaction To Coupe Highway ) In Electronic Microwave Circuit As Like As Ping ( Personal Identity Network Grew ) In Wireless Internet Go Speed Global Contact Converse 2020 >>>>> Download Now
BalasHapus>>>>> Download Full
Go Look Importantbook: Switch And Network And Wireless ( Ping ( Personal Identity Network Grew ) ) When The Connection Is Saturated Or Slow Need To Restart Again For Better If Then If As Like As Switch And Network And Wireless When The Connection Is Needed Restart Or On - Off - On Again Amnimarjeslow Government 91220017 Xi Xa Pin Ping Hung Chop 02096010014 Ljbusaf Switch ( Short Wave Interaction To Coupe Highway ) In Electronic Microwave Circuit As Like As Ping ( Personal Identity Network Grew ) In Wireless Internet Go Speed Global Contact Converse 2020 >>>>> Download LINK
>>>>> Download Now
Go Look Importantbook: Switch And Network And Wireless ( Ping ( Personal Identity Network Grew ) ) When The Connection Is Saturated Or Slow Need To Restart Again For Better If Then If As Like As Switch And Network And Wireless When The Connection Is Needed Restart Or On - Off - On Again Amnimarjeslow Government 91220017 Xi Xa Pin Ping Hung Chop 02096010014 Ljbusaf Switch ( Short Wave Interaction To Coupe Highway ) In Electronic Microwave Circuit As Like As Ping ( Personal Identity Network Grew ) In Wireless Internet Go Speed Global Contact Converse 2020 >>>>> Download Full
>>>>> Download LINK 2u