In electronics engineering known as art and electronics design: in applying a series of electronics into a tool it is necessary a way or method in recognizing the electronic circuit in the form of images in my experience in the field of electronics engineering engineering then I can give the story that there are 4 engineering drawings electronics in order to see the real circuit:1. electronics circuits in the form of symbols form symbols symbol component electronics.2. electronics circuit in the form of the electronic component along with its wiring, the form of electronics in the form of 2 dimensions or in the form of photos.3. electronics circuit in the form of block diagram is the form of function of electronics circuits in the form of block blocks of signal flow, circuit electronics in the form of block diagrams are useful for observing circuits or in the care of electronic devices and materials.4. electronics circuits in the form of flowchart or work diagram usually electronic circuit diagram in the form of flowchart that is useful for manual hand book of electronic equipment in the form of workflow of the tool that is from on, timer, clock and off and router.
A block diagram is a specialized, high-level flowchart used in engineering. It is used to design new systems or to describe and improve existing ones. Its structure provides a high-level overview of major system components, key process participants, and important working relationships.
Types and Uses of Block Diagrams
A block diagram provides a quick, high-level view of a system to rapidly identify points of interest or trouble spots. Because of its high-level perspective, it may not offer the level of detail required for more comprehensive planning or implementation. A block diagram will not show every wire and switch in detail, that's the job of a circuit diagram.
A block diagram is especially focused on the input and output of a system. It cares less about what happens getting from input to output. This principle is referred to as black box in engineering. Either the parts that get us from input to output are not known or they are not important.
How to Make a Block Diagram
Block diagrams are made similar to flowcharts. You will want to create blocks, often represented by rectangular shapes, that represent important points of interest in the system from input to output. Lines connecting the blocks will show the relationship between these components.
In SmartDraw, you'll want to start with a block diagram template that already has the relevant library of block diagram shapes docked. Adding, moving, and deleting shapes is easy in just a few key strokes or drag-and-drop. SmartDraw's block diagram tool will help build your diagram automatically.
Symbols Used in Block Diagrams
Block diagrams use very basic geometric shapes: boxes and circles. The principal parts and functions are represented by blocks connected by straight and segmented lines illustrating relationships.
When block diagrams are used in electrical engineering, the arrows connecting components represent the direction of signal flow through the system.
Whatever any specific block represents should be written on the inside of that block.
A block diagram can also be drawn in increasing detail if analysis requires it. Feel free to add as little or as much detail as you want using more specific electrical schematic symbols.
Block Diagram: Best Practices
Identify the system. Determine the system to be illustrated. Define components, inputs, and outputs.
Create and label the diagram. Add a symbol for each component of the system, connecting them with arrows to indicate flow. Also, label each block so that it is easily identified.
Indicate input and output. Label the input that activates a block, and label that output that ends the block.
Verify accuracy. Consult with all stakeholders to verify accuracy.
Block Diagram Examples
The best way to understand block diagrams is to look at some examples of block diagrams.
Click on any of these block diagrams included in SmartDraw and edit them:
Block diagrams solution extends ConceptDraw PRO software with templates, samples and libraries of vector stencils for creating the block diagram. Create block diagrams, electrical circuit diagrams, schematics, and more in minutes with ConceptDraw PRO. Read more
What is a Cross Functional Flow Chart? For those who want to know what is a cross functional flowchart and how to draw it, we preared a special library and professional looking templates. Take all the advantage of your drawing software to learn and create such a well-designed flowcharts. Watch the HowTo video to learn more. Read more
Don't let your first glance fool you. ConceptDraw is a lot easier to use than it looks. Use its cross-functional templates and library as basics to get started. All you need to know are a few basic steps and terms. ConceptDraw Arrows10 Technology is a new age in drawing software. Use it for process flows and its new rapid draw feature enables to draw an impressive charts in a seconds. Read more
Flowchart Symbols
Flowcharts use special shapes to represent different types of actions or steps in a process. Lines and arrows show the sequence of the steps, and the relationships among them. These are known as flowchart symbols.
The type of diagram dictates the flowchart symbols that are used. For example, a data flow diagram may contain an Input / Output Symbol (also known as an I/O Symbol), but you wouldn't expect to see it in most process flow diagrams.
Over the years, as technology has evolved, so has flowcharting. Some flowchart symbols that were used in the past to represent computer punch cards, or punched tape, have been relegated to the dustbin of history.
Let's go over each symbol individually.
Start/End Symbol
The terminator symbol marks the starting or ending point of the system. It usually contains the word "Start" or "End."
Action or Process Symbol
A box can represent a single step ("add two cups of flour"), or and entire sub-process ("make bread") within a larger process.
Document Symbol
A printed document or report.
Multiple Documents Symbol
Represents multiple documents in the process.
Decision Symbol
A decision or branching point. Lines representing different decisions emerge from different points of the diamond.
Input/Output Symbol
Represents material or information entering or leaving the system, such as customer order (input) or a product (output).
Manual Input Symbol
Represents a step where a user is prompted to enter information manually.
Preparation Symbol
Represents a set-up to another step in the process.
Connector Symbol
Indicates that the flow continues where a matching symbol (containing the same letter) has been placed.
Or Symbol
Indicates that the process flow continues in more than two branches.
Summoning Junction Symbol
Indicates a point in the flowchart where multiple branches converge back into a single process.
Merge Symbol
Indicates a step where two or more sub-lists or sub-processes become one.
Collate Symbol
Indicates a step that orders information into a standard format.
Sort Symbol
Indicates a step that organizes a list of items into a sequence or sets based on some pre-determined criteria.
Subroutine Symbol
Indicates a sequence of actions that perform a specific task embedded within a larger process. This sequence of actions could be described in more detail on a separate flowchart.
Manual Loop Symbol
Indicates a sequence of commands that will continue to repeat until stopped manually.
Loop Limit Symbol
Indicates the point at which a loop should stop.
Delay Symbol
Indicates a delay in the process.
Data Storage or Stored Data Symbol
Indicates a step where data gets stored.
Database Symbol
Indicates a list of information with a standard structure that allows for searching and sorting.
Internal Storage Symbol
Indicates that information was stored in memory during a program, used in software design flowcharts.
Display Symbol
Indicates a step that displays information.
Off Page
Indicates that the process continues off page.
Common flowchart symbols
These flowchart shapes and symbols are some of the most common types you'll find in most flowchart diagrams.
Flowchart Symbol
Name
Description
Process symbol
Also known as an “Action Symbol,” this shape represents a process, action, or function. It’s the most widely-used symbol in flowcharting.
Start/End symbol
Also known as the “Terminator Symbol,” this symbol represents the start points, end points, and potential outcomes of a path. Often contains “Start” or “End” within the shape.
Document symbol
Represents the input or output of a document, specifically. Examples of and input are receiving a report, email, or order. Examples of an output using a document symbol include generating a presentation, memo, or letter.
Decision symbol
Indicates a question to be answered — usually yes/no or true/false. The flowchart path may then split off into different branches depending on the answer or consequences thereafter.
Connector symbol
Usually used within more complex charts, this symbol connects separate elements across one page.
Off-Page Connector/Link symbol
Frequently used within complex charts, this symbol connects separate elements across multiple pages with the page number usually placed on or within the shape for easy reference.
Input/Output symbol
Also referred to as the “Data Symbol,” this shape represents data that is available for input or output as well as representing resources used or generated. While the paper tape symbol also represents input/output, it is outdated and no longer in common use for flowchart diagramming.
Comment/Note symbol
Placed along with context, this symbol adds needed explanation or comments within the specified range. It may be connected by a dashed line to the relevant section of the flowchart as well.
Additional flowchart symbols
Many of these additional flowchart symbols are best utilized when mapping out a process flow diagram for apps, user flow, data processing, etc.
Flowchart Symbol
Name
Description
Database symbol
Represents data housed on a storage service that will likely allow for searching and filtering by users.
Paper tape symbol
An outdated symbol rarely ever used in modern practices or process flows, but this shape could be used if you’re mapping out processes or input methods on much older computers and CNC machines.
Summing junction symbol
Sums the input of several converging paths.
Predefined process symbol
Indicates a complicated process or operation that is well-known or defined elsewhere.
Internal storage symbol
Commonly used to map out software designs, this shape indicates data that is stored within internal memory.
Manual input symbol
Represents the manual input of data into a field or step in a process, usually through a keyboard or device. Example scenario includes the step in a login process where a user is prompted to enter data manually.
Manual operation symbol
Indicates a step that must be done manually, not automatically.
Merge symbol
Combines multiple paths to become one.
Multiple documents symbol
Represents multiple documents or reports.
Preparation symbol
Differentiates between steps that prepare for work and steps that actually do work. It helps introduce the setup to another step within the same process.
Stored data symbol
Also known as “Data Storage” symbol, this shape represents where data gets stored within a process.
Delay symbol
Represents a segment of delay in a process. It can be helpful to indicate the exact length of delay within the shape.
Or symbol
Just as described, this shape indicates that the process flow continues two paths or more.
Display symbol
This shape is useful to indicate where information will get displayed within a process flow.
Hard disk symbol
Indicates where data is stored within a hard drive, also known as direct access storage.
Standard vs. non-standard flowchart symbols
While various standards for symbol usage and flowchart creation have been established, it’s okay to ignore the rules. Use the symbols in a way that makes sense to your audience. But if you use symbols in a non-standard fashion, be sure to do it consistently so your readers understand your meaning for that symbol each time they see it.
Five Basic Flowchart Symbols
Flowcharts are the ideal diagrams for visually representing business processes. For example, if you need to show the flow of a custom-order process through various departments within your organization, you can use a flowchart. This paper provides a visual representation of basic flowchart symbols and their proposed use in communicating the structure of a well-developed web site, as well as their correlation in developing on-line instructional projects. A typical flowchart from older Computer Science textbooks may have the following kinds of symbols: Start and And, Process, Decision, Document and Sub Process. Flowcharts may contain other symbols, such as connectors, usually represented by circles, to represent converging paths in the flow chart. Circles will have more than one arrow coming into them but only one going out. Some flow charts may just have an arrow pointing to another arrow instead. These are useful to represent an iterative process (in Computer Science this is called a loop). A loop may, for example, consists of a connector where control first enters, processing steps, a conditional with one arrow exiting in the loop, and one going back to the connector. Off-page connectors are often used to signify a connection to a (part of a) process held on another sheet or screen.
A flowchart is described as "cross-functional" when the page is divided into different "lanes" describing the control of different organization units. An unit appearing in a particular "lane" is within the control of that organizational unit. This technique allows the analyst to locate the responsibility for performing an action or making a decision correctly, allowing the relationship between different organizational units with responsibility over a single process.
Standard Flowchart Symbols
Flowcharts use special shapes to represent different types of actions or steps in a process. Lines and arrows show the sequence of these steps, and the relationships between them.
Flowchart Symbols and Their Usage
Name
Flowchart Symbol
Usage
Process
represents a step in your process.
Predefined process
indicates a set of steps that combine to create a sub-process that is defined elsewhere, often on another page of the same drawing.
Decision
indicates a point where the outcome of a decision dictates the next step. There can be multiple outcomes, but often there are just two - yes and no.
Start points
indicates the starting of a process.
Terminal points
indicates the ending points of a process.
Data shape
indicates that information is coming into the process from outside, or leaving the process.
Delay shape
represents a waiting period where no activity is done. In Process Mapping, delays are often important as they may result in adding to the cost of the product or simply delaying its production.
Database shape
Use this shape for a step that results in information being stored.
Step
represents a single step within a process, and usually contains the name of a specific action. Page symbols refer to individual web pages, which may or may not contain multiple elements.
File symbols
represent those data elements that exist independently of navigational properties outside of that page, e.g., audio sounds, movie clips, or a portable document file (PDF).
Decision point
indicates a sequence in the process at which the end user chooses an option, i.e., a "yes-no", or "true-false" response, and then branches to different parts of the flowchart.
Arrows and connecting lines
diagram the logical progression through the course, subject to the choices made at decision or action points within the process.
Input/action symbol
represents a user response that directs the course flow from that point onwards, i.e., an online test or questionnaire form.
Conditional selector
is similar to the conditional branch except that the user has the option to choose from a number of paths that will fulfill the requested conditions, e.g., the results of a search engine request.
Annotations
provide helpful comments or explanations, e.g. denoting the location where an undeveloped new page/process will fit into the navigational flow structure, or notes for specific team members for further development.
Flow references and flow areas
are symbols for reusable sequences, such as logging in with a specific user id and password to enter the course or to initiate an on-line quiz. The flow reference symbol acts as a placeholder for the flow area sequence in the chart in every situation in which it is repeated. Flow area is used as a flow area. It documents sections that share similar components/repeated steps within that flow, and requires the use of the following two symbols: entry and exit points.
Exit point
concludes the subroutines, such as when the proper user id and password are verified, and documents where the user re-enters the master flowchart.
Entry point
documents the place within the master flowchart where the process deviates into a subroutine.
Reference
is used as a connecting point when the flowchart necessitates using more than one page, or refers to a complicated subroutine that would be impossible to contain on the main flowchart page.
On-page reference
indicates that the next or previous step is somewhere else on the flowchart. It is particularly useful for large flowcharts.
Off-page reference
use a set of hyperlinks between two pages of a flowchart or between a sub-process shape and a separate flowchart page that shows the steps in that sub-process.
Flowchart Shapes
The designers can click this multi-shape to set to any of the following shapes: Data, Document, Decision, or Process. Any text you type onto the shape, or information you add to its Shape Data, remains with the shape.
Document
represents a step that results in a document.
Workflow Shapes
Workflow relationships are where work is done by different departments in a fixed sequence. This means that one department needs to finish its job before work can continue in another department. The development and maintenance of these work flow relationships is very important for managers because they depend on the preceding areas for his or her own work, and responsible for managers and workers at different stages further down the chain.
Audit Flowchart Shapes
The following shapes are similar to the basic flowchart symbols but are specially used in the audit flowchart.
Circuit Diagram
The circuit diagram (also known as elementary diagram; electrical diagram; and electronic schematic) is generally a graphical representation of an electrical circuit. It visualizes the interaction between circuit components, by showing the actual electrical connections. Circuit diagrams visualize the physical arrangement of wires and the components that connect them within different electronic systems.
What are circuit diagrams used for?
Circuit diagrams are used for illustrating different kinds of electrical circuits. Very similar to the network diagrams, the circuit diagrams are providing a visual representation of the schematic arrangement of all components, and the wire relationships between them. This is very helpful when preparing a project for an electrical system which should be build or when trying to track down an issue in an already existing one.
Understanding circuit diagrams
As mentioned above, the circuit diagram visualize electrical circuits. This is achieved by providing a schematic illustration where each component integrated in the electrical circuit is represented through an iconic symbol. For one to be able to read and understand the circuit diagrams, it is necessarily to know what icon represents each component.
For example a simple circuit diagram of an electric torch would look like:
To be able to read and understand this diagram it is necessarily to be familiar with the symbols used in this example - bettery, lamp, and switch.
Circuit Diagrams Symbols
All of the symbols used in circuit diagrams represent a specific electronical component
Cross-Functional Diagram
A cross-functional diagram, sometimes referred to as deployment flowchart or swimlane flowchart, is a type of process mapping flowchart. It diagrams a process from beginning until end, but also divides the tasks to categories to help when distinguish which employee or department is responsible for each step of the process. This clarity is accomplished through the usage of columns (also called lanes). Each column contains a related to the process department’s or employee’s name and the activities within the process are located in the columns under the name of the responsible for them company segment or person.
What are Cross-functional diagrams used for?
Identifying a problematic steps within a process
Cross-Functional diagrams are mainly used during the process of improvement a workflow within an organization. The cross-functional diagrams help not only to identify the bottleneck of a process, but also to show which department is responsible for it. This allows the company to clearly identify the origin of a problem. Whether it’s due to lack of clarity or because of a rude to the customers employee - a well-detailed cross-functional diagram can perfectly highlight the problematic activity.
Clarifying the employees' responsibilities
The cross-functional diagram is a really helpful tool for clarifying the responsibilities within the company. With its main purpose, to differentiate who is responsible for which step along the working process, they are very useful for helping departments work together in a better cooperation.
Where are Cross-functional diagrams suitable for?
Cross-functional diagrams: general business use
Cross-functional diagrams can be used for a large number of business purposes. Examples are improving an already existing process within the company or implementing a new process and distributing the activities amongst the personnel. They can also be used for precise scheduling of the company’s activities or working projects, like in the example below:
Cross-functional diagrams: uses in financial management
The financial aspect of a company’s commitments is perhaps one of the most complicated organizational tasks. A simple process like expense reimbursement in a large firm can consist of a dozen steps and engage over half a dozen of the company’s departments to complete.
Cross-functional diagram: uses in HR
The work of the HR department is usually tightly related to the processes in other departments. For example, when a recruitment process begins, the HR department needs to work together with at least few different sides: the candidate, who’s applying for the open position; the department that is seeking to fill up a role; and the manager who's responsible for approving every new hire.
Cross-functional diagram: uses in Service
The more services a company offers, the more complicated serving a customer might become. For example: in a software firm a customer's request might be solvable by a salesman, or it might require the assistance of the technical support department. A simple request might show a bug in the software which the customer has purchased, which might result in a task that have to be fulfilled by the development department. Having a detailed cross-functional diagram of the process can help the organization define and direct each customer’s request more precisely, and thus achieve better customer service and save precious working hours.
Workflow Diagram
Workflow diagrams visualize the steps of a work process completed either by people or machines. The main purpose of workflow diagrams is to help both teams, and systems avoid mistakes, as well as crystallize workflow processes to improve performance.
What are workflow diagrams used for?
Workflow diagram: general business use
Workflow diagrams are often used when describing an existing process within a company or an organization for the purpose of improving it, or sometimes - completely re-designing the steps. If, for example, a company receives many complains of the speed of services, the responsible manager can use a workflow diagram to visualize what happens when a customer's request (order) is received. When the information is visualized it is then much easier to see which steps of the process can be eliminated or speeded up in order to receive better customer feedback.
Workflow diagram: software development
Another domain which often uses the advantages of the workflow diagram is the software industry. Whether an online purchasing process needs to be designed or a more complicated application, the software developer can sketch each stage of the process prior to beginning. This can help eliminate the possibility of errors and ensure that the application is user friendly.
Workflow diagram: uses in HR
Workflow diagrams are widely used in Human Resources departments for many purposes, including evaluating new candidates, assessing the performance of employees, and many other. This is a sample HR workflow diagram, describing the evaluation of staffing needs and the process of recruiting new candidates within, and outside the organization.
Workflow diagram: uses in finance departments
Workflow diagrams have a widespread use in financial departments for both internal needs, and when the finance director of the company needs to provide instructions to other departments. The example below demonstrates only one of these uses, describing the process of receiving an order paid via a credit card.
Data Flow Diagram
Data flow diagram, also often referred to as DFD are diagrams that visually represent the flow of data through a system. They allow the user to see what kind of information will be input to and output from the system and where the data will be stored.
What are data flow diagrams used for?
A system can be quite complicated especially when it contains a lot information and processes. Here is how data flow diagrams come in handy. Their purpose is to show the systems as whole with its scopes and boundaries while it illustrate the movement of information between its elements. The DFD diagram differentiate from any other kind of diagrams with its concentrate focus on the flow of date throughout the system allowing the user to easily see how the system will operate, what is the system purpose and how it will accomplish it. They also illustrate how the data will enter, how it will be process within the system and where it will be stored.
DFD Types
Data flow Diagrams are divided into two main types: Physical and Logical. The Physical DFD represents “how” the system will be implemented, while the Logical DFD focusses on the system itself and “what” it will achieve.
Data Flow Diagram Levels
There are different levels of DFD according to the purpose they are drawn to serve.
Context Data Flow Diagram
The top level diagram that illustrates the entire system in its relationship to any external entities is called a Context Diagram and also referred to as Data Flow Diagram Level 0.
Data Flow Diagram Level 1
DFD Level 1 illustrate the main functions within the system. This level shows more detailed breakout of the Context Level Diagram, representing how the data enters and exits the system, where it is stored and how the basic processes convert it from one form to another.
Data Flow Diagram Level 2
DFD Level 2 or higher go into deeper details showing how the data flows inside the main process of the system
Floor Plan Diagram
Floor Plans are scaled diagrams of rooms, buildings, or outdoor areas as seen from atop. They represent the distribution of rooms and spaces along with the windows and doors plus all the furniture and appliances, and the way they are arranged.
What are Floor Plans used for?
Floor Plans are really handy way of presenting any kind of indoor or outdoor spaces with many different purposes such as:
Architect projects when needed to construct a building;
Engineer projects for constructing the electrical installations, lighting and security systems, etc.;
When furnishing a house, villa, office, restaurant, shop, hotel, school, and so on;
In real estate for presenting the place to future tenants or buyers;
In event organizing, when needed to rearrange a place for a special occasion;
When planning a renovation or improvements of a room or a building;
In government organizations - for calculating applicable taxes.
The main purpose of Floor Plans is to give the viewer a clear idea of the available space within a room, building, or an outdoor location, as well as help measure distances between objects.
Types of Floor Plans
There are different types of floor plans which differ based on the purpose they serve. Some of the main types of floor charts are:
Interior Design Floor Plan - used to visualize the distribution of rooms, along with furniture and appliances. It serves for better understanding of the relationship between all different spaces and items included in the plan, and provides valuable information for the dimensions of the each area and object.
Construction Design Floor Plan - used for architectural purposes to help the process of planning a building with the distribution of windows and doors, while making sure to keep the correct size of each room or hallway.
Wire Design Floor Plan - The wire design floor plan represents the whole electricity system of a place, showing all wires and connections between them.
Cause and Effect Diagram
The basic concept of the Cause and Effect diagram was first used back in the 1920's as a method for product quality control. The fishbone diagram is, however, officially created almost half a century later (1968) by Kaoru Ishikawa to serve as quality management procedure control in Kawasaki. The Cause and Effect diagram can also be found under the name – Ishikawa diagram, named after its official creator, or as Fishbone diagram - based on its fishbone-like looking structure.
What are Cause and Effect diagrams used for?
As the name suggests, this type of diagrams are used to describe an effect, and the conditions that cause it. The Fishbone diagram is the initial step in the screening process, when trying to find a solution to a problem. It helps us begin by defining the problem and noting it down. Then draw the “backbone of the fish” to which we attach all main categories related to the issue. In the end, we assign all possible aspects of each category that might have gone wrong and caused the problem. Once we have the diagram ready, we can easily see the whole picture and track down the possible issues.
Types of Cause and Effect diagrams
Fishbone diagrams are used for monitoring the quality and services across industries. Generally, we can categorize all industries in 3 major groups - services, manufacturing and management (marketing / business management). Each of those groups has several categories that influence its results.
1. Within the service industry we can talk about the 4 S's:
Surrounding – meaning the market needs, requests, and the competition.
Suppliers – the organizations delivering supplies and their characteristics.
System – the methods used for providing the service.
Skills – the qualifications of the employees and co-workers in the organization.
2. Within the management industry we can talk about the 8 P's:
Product – referring to all aspects of the product or service offered by the organization.
Price – the price range of the kind of product/service the company provides.
Place – the distribution of your product and the location of the working place.
Promotion – the strategies used for gaining new customers and involving the ones, that the organization already has.
People/personnel – as it is no secret, the employees of a company can make it "fly or die", based on their qualification and motivation to work.
Process – the procedures used for completing the work/service.
Physical Evidence – everything visible to the eye that can be directly related to the provided product or service.
Publicity - all the information about the provided product or service and the method used for presenting it to the company’s target customers.
3. Within the manufacturing industry we can talk about the 8 M's:
Machine – the technology and machines used for the production.
Method – the processes used by the company.
Material – it applies to everything needed for manufacturing the company’s products.
Man/Mind power – the working force of the organization.
Measurement – the technicians used for planning the manufacturing processes, and for monitoring the same.
Mother Nature – all the parameters of the environment that are able to affect the production.
Management – the way the production is handled and finances are managed, according to the manufacturing needs.
Maintenance – referring to keeping up the production line in the necessary working conditions, as well as to the support and warranties provided to customers.
Network Diagram
In the 21st century, most work is done via computers and machines. The large administration offices where people used to work mainly with paper-printed documents and written data are now replaced by digital libraries and laptops. Instead of having storage rooms, nowadays we have servers and virtual storages. Moreover, today people who work together as a team can be physically miles away from each other, yet that won’t be a problem. Their working machines can be connected to a computer network, allowing them to collaborate. This is where Network Diagrams come in handy. Whether large or small the organization, there is always a need to visualize the connection between the servers and the computers, as well as the various access levels.
What are Network diagrams used for?
Network Diagrams provide a visual representation of the virtual reality of any network. Every kind of network can be easily illustrated, showing clearly all users. Network diagrams also serve to show the exact type of connection they have with the rest of the machines in the network, as well as the data storage units.
Network Diagram Topology
When it comes to networks there are several different main topologies which differ mainly by the manner of connecting:
Fully Connected Network
Ring Network Topology
Mesh Network Topology
Star Network Topology
Common Bus Topology
Network Diagrams can also help when needed to detect an issue in the network hierarchy. By being able to see the exact topology of connections used for building the network and all the machines connected in it, one can track down the problem much easily.
XXX . XXX Components of a Computer System - Input, Process, Output
Components of a Computer System - Input, Process, Output
Conventional and assistive computer technologies are similar in that both employ the core concepts of input, informationprocessing, and output (ATA, 2000). Understanding these concepts is essential to understanding how AT helps individuals with disabilities access a computer. Each system first must have a means to input information. This information is then processed. From the processed information, the computer produces some type of output. Input or output devices can be modified to provide access to individuals with disabilities who cannot use standard input or output devices. To provide a better understanding of input, output, and processing, these concepts are defined as follows.
Input - the information entered into a computer system, examples include: typed text, mouse clicks, etc.
Processing - the process of transforming input information into and output.
Output – the visual, auditory, or tactile perceptions provided by the computer after processing the provided information. Examples include: text, images, sound, or video displayed on a monitor or through speaker as well as text or Braille from printers or embossers.
InputDevice – any device that enters information into a computer from a external source. Examples include: keyboards, touch screens, mouse, trackballs, microphones, scanners, etc.
Processing Device – the electronics that process or transform information provided as an input to a computer to an output. Examples include: the Central Processing Unit (CPU), operating systems (e.g. Windows, Apple software), microprocessors (e.g. Intel, Pentium), memory cards (RAM), graphic and other production application or programs (Adobe, Microsoft Word, etc).
Output Device - a device used by a computer to communicate information in a usable form. Examples include: monitors, speakers, and printers, etc.
The following is an example showing how these three concepts work together: To access a website, the user opens an internet browser and, using the keyboard, enters a web address into the browser (input). The computer then uses that information to find the correct website (information processing) and the content of the desired site is displayed in the web browser (output).
AT for computer access can be applied by adapting either the input or output component of a computer system. Doing this provides an individual with a disability with a tool that utilizes his or her abilities to access a computer. An example of adapting an input device is providing an individual who does not have use of his or her hands with speech recognition software to enter text into a computer as opposed to a keyboard. As for adapting an output device, an individual with a visual impairment can use either a screen magnifier or screen reader to access output on a computer screen. Information processing, in terms of a computer, does not involve a human element and thus does not require assistive technology adaptations.
Windows 8.1
There are a few different kinds of keyboards. The most common is a physical, external keyboard that you plug into your PC.
XXX . XXX 4 zero How Computer Keyboards Work
An average Windows keyboard.
When you look at all the extras and options that are available for new computer keyboards, it can be hard to believe that their original design came from mechanical typewriters that didn't even use electricity. Now, you can buy ergonomic keyboards that bear little resemblance to flat, rectangular models with ordinary square keys. Some flashier models light up, roll up or fold up, and others offer options for programming your own commands and shortcuts.
But no matter how many bells and whistles they offer, most keyboards operate using similar technology. They use switches and circuits to translate a person's keystrokes into a signal a computer can understand. In this article we will explore keyboard technology along with different key layouts, options and designs.
Keyboard Basics
Keyboards differ by manufacturer and the operating system they are designed for.
A keyboard's primary function is to act as an input device. Using a keyboard, a person can type a document, use keystroke shortcuts, access menus, play games and perform a variety of other tasks. Keyboards can have different keys depending on the manufacturer, the operating system they're designed for, and whether they are attached to a desktop computer or part of a laptop. But for the most part, these keys, also called keycaps, are the same size and shape from keyboard to keyboard. They're also placed at a similar distance from one another in a similar pattern, no matter what language or alphabet the keys represent.
Most keyboards have between 80 and 110 keys, including:
Typing keys
A numeric keypad
Function keys
Control keys
The typing keys include the letters of the alphabet, generally laid out in the same pattern used for typewriters. According to legend, this layout, known as QWERTY for its first six letters, helped keep mechanical typewriters' metal arms from colliding and jamming as people typed. Some people question this story -- whether it's true or not, the QWERTY pattern had long been a standard by the time computer keyboards came around.
Keyboards can also use a variety of other typing key arrangements. The most widely known is Dvorak, named for its creator, August Dvorak. The Dvorak layout places all of the vowels on the left side of the keyboard and the most common consonants on the right. The most commonly used letters are all found along the home row. The home row is the main row where you place your fingers when you begin typing. People who prefer the Dvorak layout say it increases their typing speed and reduces fatigue. Other layouts include ABCDE, XPeRT, QWERTZ and AZERTY. Each is named for the first keys in the pattern. The QWERTZ and AZERTY arrangements are commonly used in Europe.
The numeric keypad is a more recent addition to the computer keyboard. As the use of computers in business environments increased, so did the need for speedy data entry. Since a large part of the data was numbers, a set of 17 keys, arranged in the same configuration found on adding machines and calculators, was added to the keyboard.
The Apple keyboard's control keys include the "Command" key.
In 1986, IBM further extended the basic keyboard with the addition of function and control keys. Applications and operating systems can assign specific commands to the function keys. Control keys provide cursor and screen control. Four arrow keys arranged in an inverted T formation between the typing keys and numeric keypad move the cursor on the screen in small increments.
Other common control keys include:
Home
End
Insert
Delete
Page Up
Page Down
Control (Ctrl)
Alternate (Alt)
Escape (Esc)
The Windows keyboard adds some extra control keys: two Windows or Start keys, and an Application key. Apple keyboards, on the other hand, have Command (also known as "Apple") keys. A keyboard developed for Linux users features Linux-specific hot keys, including one marked with "Tux" the penguin -- the Linux logo/mascot.
The microprocessor and controller circuitry of a keyboard
A keyboard is a lot like a miniature computer. It has its own processor and circuitry that carries information to and from that processor. A large part of this circuitry makes up the key matrix.
The key matrix is a grid of circuits underneath the keys. In all keyboards (except for capacitive models, which we'll discuss in the next section), each circuit is broken at a point below each key. When you press a key, it presses a switch, completing the circuit and allowing a tiny amount of current to flow through. The mechanical action of the switch causes some vibration, called bounce, which the processor filters out. If you press and hold a key, the processor recognizes it as the equivalent of pressing a key repeatedly.
When the processor finds a circuit that is closed, it compares the location of that circuit on the key matrix to the character map in its read-only memory (ROM). A character map is basically a comparison chart or lookup table. It tells the processor the position of each key in the matrix and what each keystroke or combination of keystrokes represents. For example, the character map lets the processor know that pressing the a key by itself corresponds to a small letter "a," but the Shift and a keys pressed together correspond to a capital "A."
The key matrix
A computer can also use separate character maps, overriding the one found in the keyboard. This can be useful if a person is typing in a language that uses letters that don't have English equivalents on a keyboard with English letters. People can also set their computers to interpret their keystrokes as though they were typing on a Dvorak keyboard even though their actual keys are arranged in a QWERTY layout. In addition, operating systems and applications have keyboard accessibility settings that let people change their keyboard's behavior to adapt to disabilities.
Keyboard Switches
This keyboard uses rubber dome switches.
Keyboards use a variety of switch technologies. Capacitive switches are considered to be non-mechanical because they do not physically complete a circuit like most other keyboard technologies. Instead, current constantly flows through all parts of the key matrix. Each key is spring-loaded and has a tiny plate attached to the bottom of it. When you press a key, it moves this plate closer to the plate below it. As the two plates move closer together, the amount of current flowing through the matrix changes. The processor detects the change and interprets it as a key press for that location. Capacitive switch keyboards are expensive, but they have a longer life than any other keyboard. Also, they do not have problems with bounce since the two surfaces never come into actual contact.
All of the other types of switches used in keyboards are mechanical in nature. Each provides a different level of audible and tactile response -- the sounds and sensations that typing creates. Mechanical key switches include:
Rubber dome
Membrane
Metal contact
Foam element
This keyboard uses rubber dome switches.
Rubber dome switches are very common. They use small, flexible rubber domes, each with a hard carbon center. When you press a key, a plunger on the bottom of the key pushes down against the dome, and the carbon center presses against a hard, flat surface beneath the key matrix. As long as the key is held, the carbon center completes the circuit. When the key is released, the rubber dome springs back to its original shape, forcing the key back up to its at-rest position. Rubber dome switch keyboards are inexpensive, have pretty good tactile response and are fairly resistant to spills and corrosion because of the rubber layer covering the key matrix.
Rather than having a switch for each key, membrane keyboards use a continuous membrane that stretches from one end to another. A pattern printed in the membrane completes the circuit when you press a key. Some membrane keyboards use a flat surface printed with representations of each key rather than keycaps. Membrane keyboards don't have good tactile response, and without additional mechanical components they don't make the clicking sound that some people like to hear when they're typing. However, they're generally inexpensive to make. Metal contact and foam element keyboards are increasingly less common. Metal contact switches simply have a spring-loaded key with a strip of metal on the bottom of the plunger. When the key is pressed, the metal strip connects the two parts of the circuit. The foam element switch is basically the same design but with a small piece of spongy foam between the bottom of the plunger and the metal strip, providing a better tactile response. Both technologies have good tactile response, make satisfyingly audible "clicks," and are inexpensive to produce. The problem is that the contacts tend to wear out or corrode faster than on keyboards that use other technologies. Also, there is no barrier that prevents dust or liquids from coming in direct contact with the circuitry of the key matrix.
Different manufacturers have used these standard technologies, and a few others, to create a wide range of non-traditional keyboards. We'll take a look at some of these non-traditional keyboards in the next section.
The SafeType keyboard places the two halves of the keyboard perpendicular to the desk surface.
A lot of modifications to the traditional keyboard design are an attempt to make them safer or easier to use. For example, some people have associated increased keyboard use with repetitive stress injuries like carpal tunnel syndrome, although scientific studies have produced conflicting results. Ergonomic keyboard designs are intended to keep a person's hands in a more natural position while typing in an attempt to prevent injuries. While these keyboards can certainly keep people from holding their hands in a "praying mantis" position, studies disagree on whether they actually prevent injury.
The simplest ergonomic keyboards look like traditional keyboards that have been divided down the middle, keeping a person's hands farther apart and aligning the wrists with the forearms. More complex designs place the two halves of the keyboard at varying angles to one another and to the surface on which the keyboard rests. Some go even further, placing the two halves of the keyboard on the armrests of chairs or making them completely perpendicular to the desk surface. Others, like the Datahand, don't look much like keyboards at all.
Saitek Truview backlit keyboard buttons
Some modifications, while not necessarily ergonomic, are designed to make keyboards more portable, more versatile or just cooler:
Das Keyboard is a completely black keyboard with weighted keys that require more pressure from a person's strongest fingers and less pressure from the weaker ones.
The Virtual Laser Keyboard projects a representation of a keyboard onto a flat surface. When used successfully, a person's fingers pass through the beam of infrared light above the projected surface, and a sensor interprets it as a keystroke.
The True-touch Roll-up keyboard is flexible and can be rolled up to fit in a backpack or bag. Blue backlit keyboard 'on'Blue backlit keyboard 'off'
The Optimus keyboard has organic light-emitting diodes (OLEDs) in the keys. Users can change what letter, command or action each key represents, and the OLED can change to display the new information.
This Optimus keyboard is set for keystrokes used to play Quake.
With the exception of the Virtual Laser Keyboard, which has its own sensing system, each of these keyboards uses the same type of technology as traditional models do to communicate with the computer. We'll look at that technology next.
From the Keyboard to the Computer
A PS/2 type keyboard connector.
As you type, the processor in the keyboard analyzes the key matrix and determines what characters to send to the computer. It maintains these characters in its memorybuffer and then sends the data.
Many keyboards connect to the computer through a cable with a PS/2 or USB (Universal Serial Bus) connector. Laptops use internal connectors. Regardless of which type of connector is used, the cable must carry power to the keyboard, and it must carry signals from the keyboard back to the computer.
Wireless keyboards, on the other hand, connect to the computer through infrared (IR), radio frequency (RF) or Bluetooth connections. IR and RF connections are similar to what you'd find in a remote control. Regardless of which sort of signal they use, wireless keyboards require a receiver, either built in or plugged in to the USB port, to communicate with the computer. Since they don't have a physical connection to the computer, wireless keyboards have an AC power connection or use batteries for power.
Microsoft wireless keyboard
This Microsoft wireless keyboard is battery-powered.
Whether it's through a cable or wireless, the signal from the keyboard is monitored by the computer's keyboard controller. This is an integrated circuit (IC) that processes all of the data that comes from the keyboard and forwards it to the operating system. When the operating system (OS) is notified that there is data from the keyboard, it checks to see if the keyboard data is a system level command. A good example of this is Ctrl-Alt-Delete on a Windows computer, which reboots the system. Then, the OS passes the keyboard data on to the current application.
The application determines whether the keyboard data is a command, like Alt-f, which opens the File menu in a Windows application. If the data is not a command, the application accepts it as content, which can be anything from typing a document to entering a URL to performing a calculation. If the current application does not accept keyboard data, it simply ignores the information. This whole process, from pressing the key to entering content into an application, happens almost instantaneously.
Computer Concepts and Terminology
Input and Output Devices
Links to topics on this page:
Before a computer can process your data, you need some method to input the data into the machine. The device you use will depend on what form this data takes (be it text, sound, artwork, etc.).
Similarly, after the computer has processed your data, you often need to produce output of the results. This output could be a display on the computer screen, hardcopy on printed pages, or even the audio playback of music you composed on the computer. The terms “input” and “output” are used both as verbs to describe the process of entering or displaying the data, and as nouns referring to the data itself entered into or displayed by the computer.
Below we discuss the variety of peripheral devices used for computer input and output.
The computer keyboard is used to enter text information into the computer, as when you type the contents of a report. The keyboard can also be used to type commands directing the computer to perform certain actions. Commands are typically chosen from an on-screen menu using a mouse, but there are often keyboard shortcuts for giving these same commands.
In addition to the keys of the main keyboard (used for typing text), keyboards usually also have a numeric keypad (for entering numerical data efficiently), a bank of editing keys (used in text editing operations), and a row of function keys along the top (to easily invoke certain program functions). Laptop computers, which don’t have room for large keyboards, often include a “fn” key so that other keys can perform double duty (such as having a numeric keypad function embedded within the main keyboard keys).
Improper use or positioning of a keyboard can lead to repetitive-stress injuries. Some ergonomic keyboards are designed with angled arrangements of keys and with built-in wrist rests that can minimize your risk of RSIs.
Most keyboards attach to the PC via a PS/2 connector or USB port (newer). Older Macintosh computers used an ABD connector, but for several years now all Mac keyboards have connected using USB.
Pointing Devices
The graphical user interfaces (GUIs) in use today require some kind of device for positioning the on-screen cursor. Typical pointing devices are: mouse, trackball, touch pad, trackpoint, graphics tablet, joystick, and touch screen.
Pointing devices, such as a mouse, connected to the PC via a serial ports (old), PS/2 mouse port (newer), or USB port (newest). Older Macs used ADB to connect their mice, but all recent Macs use USB (usually to a USB port right on the USB keyboard).
Mouse
PC Keyboard (you have one in front of you that you can see for a closer look)
The mouse pointing device sits on your work surface and is moved with your hand. In older mice, a ball in the bottom of the mouse rolls on the surface as you move the mouse, and internal rollers sense the ball movement and transmit the information to the computer via the cord of the mouse.
The newer optical mouse does not use a rolling ball, but instead uses a light and a small optical sensor to detect the motion of the mouse by tracking a tiny image of the desk surface. Optical mice avoid the problem of a dirty mouse ball, which causes regular mice to roll unsmoothly if the mouse ball and internal rollers are not cleaned frequently.
A cordless or wireless mouse communicates with the computer via radio waves (often using BlueTooth hardware and protocol) so that a cord is not needed (but such mice need internal batteries).
A mouse also includes one or more buttons (and possibly a scroll wheel) to allow users to interact with the GUI. The traditional PC mouse has two buttons, while the traditional Macintosh mouse has one button. On either type of computer you can also use mice with three or more buttons and a small scroll wheel (which can also usually be clicked like a button).
Touch pad
Two-button mouse with scroll wheel
Wireless Macintosh mouse
Most laptop computers today have a touch pad pointing device. You move the on-screen cursor by sliding your finger along the surface of the touch pad. The buttons are located below the pad, but most touch pads allow you to perform “mouse clicks” by tapping on the pad itself.
Touch pads have the advantage over mice that they take up much less room to use. They have the advantage over trackballs (which were used on early laptops) that there are no moving parts to get dirty and result in jumpy cursor control.
Trackpoint
Touch pad of a PC laptop
Some sub-notebook computers (such as the IBM ThinkPad), which lack room for even a touch pad, incorporate a trackpoint, a small rubber projection embedded between the keys of the keyboard. The trackpoint acts like a little joystick that can be used to control the position of the on-screen cursor.
Trackball
Trackpoint
The trackball is sort of like an upside-down mouse, with the ball located on top. You use your fingers to roll the trackball, and internal rollers (similar to what’s inside a mouse) sense the motion which is transmitted to the computer. Trackballs have the advantage over mice in that the body of the trackball remains stationary on your desk, so you don’t need as much room to use the trackball. Early laptop computers often used trackballs (before superior touch pads came along).
Trackballs have traditionally had the same problem as mice: dirty rollers can make their cursor control jumpy and unsmooth. But there are modern optical trackballs that don’t have this problem because their designs eliminate the rollers.
Joysticks
Trackball
Joysticks and other game controllers can also be connected to a computer as pointing devices. They are generally used for playing games, and not for controlling the on-screen cursor in productivity software.
Touch screen
Some computers, especially small hand-held PDAs, have touch sensitive display screens. The user can make choices and press button images on the screen. You often use a stylus, which you hold like a pen, to “write” on the surface of a small touch screen.
Graphics tablet
A graphics tablet consists of an electronic writing area and a special “pen” that works with it. Graphics tablets allows artists to create graphical images with motions and actions similar to using more traditional drawing tools. The pen of the graphics tablet is pressure sensitive, so pressing harder or softer can result in brush strokes of different width (in an appropriate graphics program).
Scanners
A scanner is a device that images a printed page or graphic by digitizing it, producing an image made of tiny pixels of different brightness and color values which are represented numerically and sent to the computer. Scanners scan graphics, but they can also scan pages of text which are then run through OCR (Optical Character Recognition) software that identifies the individual letter shapes and creates a text file of the page's contents.
Microphone
A microphone can be attached to a computer to record sound (usually through a sound card input or circuitry built into the motherboard). The sound is digitized—turned into numbers that represent the original analog sound waves—and stored in the computer to later processing and playback.
MIDI Devices
MIDI (Musical Instrument Digital Interface) is a system designed to transmit information between electronic musical instruments. A MIDI musical keyboard can be attached to a computer and allow a performer to play music that is captured by the computer system as a sequence of notes with the associated timing (instead of recording digitized sound waves).
Graphics tablet.
Output Devices
CRT Monitor
The traditional output device of a personal computer has been the CRT (Cathode Ray Tube) monitor. Just like a television set (an older one, anyway) the CRT monitor contains a large cathode ray tube that uses an electron beam of varying strength to “paint” a picture onto the color phosphorescent dots on the inside of the screen. CRT monitors are heavy and use more electrical power than flat panel displays, but they are preferred by some graphic artists for their accurate color rendition, and preferred by some gamers for faster response to rapidly changing graphics.
Monitor screen size is measured diagonally across the screen, in inches. Not all of the screen area may be usable for image display, so the viewable area is also specified. The resolution of the monitor is the maximum number of pixels it can display horizontally and vertically (such as 800 x 600, or 1024 x 768, or 1600 x 1200). Most monitors can display several resolutions below its maximum setting. Pixels (short for picture elements) are the small dots that make of the image displayed on the screen. The spacing of the screen’s tiny phosphor dots is called the dot pitch (dp), typically .28 or .26 (measured in millimeters). A screen with a smaller dot pitch produces sharper images.
Your computer must produce a video signal that a monitor can display. This may be handled by circuitry on the motherboard, but is usually handled by a video card in one of the computer’s expansion slots; often the slot is a special one dedicated to video use, such as an AGP slot (Accelerated Graphics Port). Video cards are also called video display adapters, and graphics cards. Many video cards contain separate processors and dedicated video memory for generating complex graphics quickly without burdening the CPU. These accelerated graphics cards are loved by gamers.
Flat Panel Monitor
CRT monitor
A flat panel display usually uses an LCD (Liquid Crystal Display) screen to display output from the computer. The LCD consists of several thin layers that polarize the light passing through them. The polarization of one layer, containing long thin molecules called liquid crystals, can be controlled electronically at each pixel, blocking varying amounts of the light to make a pixel lighter or darker. Other types of flat panel technology exist (such as plasma displays) but LCDs are most commonly used in computers, especially laptops.
Older LCDs had slow response times and low contrast, but active matrix LCD screens have a transparent thin film transistor (TFT) controlling each pixel, so response, contrast, and viewing angle are much improved.
Flat panel displays are much lighter and less bulky than CRT monitors, and they consume much less power. They have been more expensive than CRTs in the past, but the price gap is narrowing. You will see many more flat panels in the future.
As with CRTs, the display size of a flat panel is expressed in inches, and the resolution is the number of pixels horizontally and vertically on the display.
Ink Jet Printer
Flat panel display (LCD)
For hardcopy (printed) output, you need some kind of printer attached to your computer (or available over a network). The most common type of printer for home systems is the color ink jet printer. These printers form the image on the page by spraying tiny droplets of ink from the print head. The printer needs several colors of ink (cyan, yellow, magenta, and black) to make color images. Some photo-quality ink jet printers have more colors of ink.
Ink jet printers are inexpensive, but the cost of consumables (ink cartridges and special paper) make them costly to operate in the long run for many purposes.
Laser Printer
Inkjet Printer
A laser printer produces good quality images by the same technology that photocopiers use. A drum coated with photosensitive material is charged, then an image is written onto it by a laser (or LEDs) which makes those areas lose the charge. The drum then rolls through toner (tiny plastic particles of pigment) that are attracted to the charged areas of the drum. The toner is then deposited onto the paper, and then fused into the paper with heat.
Most laser printers are monochrome (one color only, usually black), but more expensive laser printers with multiple color toner cartridges can produce color output.
Laser printers are faster than ink jet printers. Their speed is rated in pages per minute (ppm). Laser printers are more expensive than ink jets, but they are cheaper to run in the long term if you just need good quality black & white pages.
Other Printers
Laser Printer
Multi-function printers are available that not only operate as a computer printer, but also include the hardware needed to be a scanner, photocopier, and FAX machine as well.
Dot matrix printers use small electromagnetically activated pins in the print head, and an inked ribbon, to produce images by impact. These printers are slow and noisy, and are not commonly used for personal computers anymore (but they can print multi-layer forms, which neither ink jet or laser printers can).
Sound Output
Computers also produce sound output, ranging from simple beeps alerting the user, to impressive game sound effects, to concert quality music. The circuitry to produce sound may be included on the motherboard, but high quality audio output from a PC usually requires a sound card in one of the expansion slots, connected to a set of good quality external speakers or headphones.
Multimedia is a term describing computer output that includes sound, text, graphics, movies, and animation. A sound card is an example of a multimedia output device (as is a monitor that can display graphics).
Introduction to Computers
The Big Picture
A computer system has three main components: hardware, software, and people. The equipment associated with a computer system is called hardware. Software is a set of instructions that tells the hardware what to do. People, however, are the most important component of a computer system - people use the power of the computer for some purpose. In fact, this course will show you that the computer can be a tool for just about anyone from a business person, to an artist, to a housekeeper, to a student - an incredibly powerful and flexible tool. Software is actually a computer program. To be more specific, a program is a set of step-by-step instructions that directs the computer to do the tasks you want it to do and to produce the results you want. A computer programmer is a person who writes programs. Most of us do not write programs, we use programs written by someone else. This means we are users - people who purchase and use computer software.
Hardware: Meeting the Machine
What is a computer? A six-year-old called a computer "radio, movies, and television combined!" A ten-year-old described a computer as "a television set you can talk to." The ten-year-old's definition is closer but still does not recognize the computer as a machine that has the power to make changes. A computer is a machine that can be programmed to accept data (input), process it into useful information (output), and store it away (in a secondary storage device) for safekeeping or later reuse. The processing of input to output is directed by the software but performed by the hardware. To function, a computer system requires four main aspects of data handling: input, processing, output, and storage. The hardware responsible for these four areas operates as follows:
Input devices accept data in a form that the computer can use; they then send the data to the processing unit.
The processor, more formally known as the central processing unit (CPU), has the electronic circuitry that manipulates input data into the information people want. The central processing unit executes computer instructions that are specified in the program.
Output devices show people the processed data-information in a form that they can use.
Storage usually means secondary storage. Secondary storage consists of devices, such as diskettes, which can store data and programs outside the computer itself. These devices supplement the computer's memory, which, as we will see, can hold data and programs only temporarily.
Now let us consider the equipment related to these four aspects of data handling in terms of what you would find on a personal computer.
Your Personal Computer Hardware
Let us look at the hardware in terms of a personal computer. Suppose you want to do word processing on a personal computer, using the hardware shown in Figure 1.
Figure 1: Personal Computer
Word processing software allows you to input data such as an essay, save it, revise and re-save it, and print it whenever you wish. The input device, in this case, is a keyboard, which you use to type in the original essay and any changes you want to make to it. All computers, large and small, must have a central processing unit within the personal computer housing. The central processing unit under the direction of the word processing software accepts the data you input through the keyboard. Processed data from your personal computer is usually output in two forms: on a screen and eventually by a printer. As you key in the essay on the keyboard, it appears on the screen in front of you. After you examine the essay on the screen, make changes, and determine that it is acceptable, you can print the essay on the printer. Your secondary storage device in this case is a diskette, a magnetic medium that stores the essay until it is needed again. Now we will take a general tour of the hardware needed for input, processing, output, and storage. These same components make up all computer systems, whether small, medium, or large. In this discussion we will try to emphasize the types of hardware you are likely to have seen in your own environment. These topics will be covered in detail in later chapters.
Input: What Goes In
Input is the data that you put into the computer system for processing. Here are some common ways of feeding input data into the system:
Typing on a keyboard. Computer keyboards operate in much the same way as electric typewriter keyboards. The computer responds to what you enter; that is, it "echoes" what you type by displaying it on the screen in front of you.
Pointing with a mouse. A mouse is a device that is moved by hand over a flat surface. As the ball on its underside rotates, the mouse movement causes corresponding movement of a pointer on the computer screen. Pressing buttons on the mouse lets you invoke commands.
Scanning with a flatbed scanner, wand reader or bar code reader (Figure 3).
Figure 3: Flatbed Scanner
Flatbed scanners act like a copying machine by using light beams to scan a document or picture that is laid upon its glass face. A great way to send pictures through email! Bar scanners, which you have seen in retail stores, use laser beams to read special letters, numbers, or symbols such as the zebra-striped bar codes on many products.
You can input data to a computer in many other interesting ways, including writing, speaking, pointing, or even by just looking at the data. We will examine all these in detail in a later chapter.
The Processor and Memory: Data Manipulation
In a computer the processor is the center of activity. The processor, as we noted, is also called the central processing unit (CPU). The central processing unit consists of electronic circuits that interpret and execute program instructions, as well as communicate with the input, output, and storage devices. It is the central processing unit that actually transforms data into information. Data is the raw material to be processed by a computer. Such material can be letters, numbers, or facts like grades in a class, baseball batting averages, or light and dark areas in a photograph. Processed data becomes information, data that is organized, meaningful, and useful. In school, for instance, an instructor could enter various student grades (data), which can be processed to produce final grades and perhaps a class average (information). Data that is perhaps uninteresting on its own may become very interesting once it is converted to information. The raw facts (data) about your finances, such as a paycheck or a donation to charity or a medical bill may not be captivating individually, but together, these and other acts can be processed to produce the refund or amount you owe on your income tax return (information). Computer memory, also known as primary storage, is closely associated with the central processing unit but separate from it. Memory holds the data after it is input to the system and before it is processed; also, memory holds the data after it has been processed but before it has been released to the output device. In addition, memory holds the programs (computer instructions) needed by the central processing unit.
Output: What Comes Out
Figure 3: Monitor
Figure 4: Printer
Output, the result produced by the central processing unit, is a computer's whole reason for being. Output is usable information; that is, raw input data that has been processed by the computer into information. The most common forms of output are words, numbers, and graphics. Word output, for example, may be the letters and memos prepared by office people using word processing software. Other workers may be more interested in numbers, such as those found in formulas, schedules, and budgets. In many cases numbers can be understood more easily when output in the form of charts and graphics. The most common output devices are computer screens (Figure 3)and printers (Figure 4). Screens can vary in their forms of display, producing text, numbers, symbols, art, photographs, and even video-in full color. Printers produce printed reports as instructed by a computer program, often in full color. You can produce output from a computer in other ways, including film and voice output. We will examine all output methods in detail in a later chapter.
Secondary Storage
Secondary storage provides additional storage separate from memory. Secondary storage has several advantages. For instance, it would be unwise for a college registrar to try to keep the grades of all the students in the college in the computer's memory; if this were done, the computer would probably not have room to store anything else. Also, memory holds data and programs only temporarily. Secondary storage is needed for large volumes of data and also for data that must persist after the computer is turned off.
Figure 5: Hard Disk
Figure 6: Hard Disk Pack
The two most common secondary storage mediums are magnetic disk and magnetic tape. A magnetic disk can be a diskette or a hard disk. A diskette is usually 3-1/2 inches in diameter (in some rare cases older disks are 5-1/4 inches). A diskette is removable so you can take your data with you. Hard disks, shown in Figure 5, have more storage capacity than diskettes and also offer faster access to the data they hold. Hard disks are often contained in disk packs shown in Figure 6 that is built into the computer so your data stays with the computer. Disk data is read by disk drives. Personal computer disk drives read diskettes; most personal computers also have hard disk drives. Modern personal computers are starting to come with removable storage media, like Zip disks. These disks are slightly larger than a diskette and can be inserted and removed like a diskette, but hold much more data than a diskette and are faster for the CPU to access than a diskette. Most modern computers also come with a CD-ROM drive. A CD is an optical disk, it uses a laser beam to read the disk. CD's are removable and store large volumes of data relatively inexpensively. Some CD drives are read only memory (ROM), which means that your computer can read programs from CD's, but you can not save data to the CD yourself. Recently CD-RW drives and disks have become widely available that allow you to create your own CDs by "writing" data such as music and photos to the CD. Magnetic tape, which comes on a reel or cartridge shown in Figure 7,
Figure 7: Magnetic Tape
is similar to tape that is played on a tape recorder. Magnetic tape reels are mounted on tape drives when the data on them needs to be read by the computer system or when new data is to be written on the tape. Magnetic tape is usually used for creating backup copies of large volumes of data because tape is very inexpensive compared to disks and CDs. We will study storage media in a later part of the course.
The Complete Hardware System
The hardware devices attached to the computer are called peripheral equipment. Peripheral equipment includes all input, output, and secondary storage devices. In the case of personal computers, some of the input, output, and storage devices are built into the same physical unit. In many personal computers, the CPU and disk drive are all contained in the same housing; the keyboard, mouse, and screen are separate. In larger computer systems, however, the input, processing, output, and storage functions may be in separate rooms, separate buildings, or even separate countries. For example, data may be input on terminals at a branch bank and then transmitted to the central processing unit at the headquarters bank. The information produced by the central processing unit may then be transmitted to the international offices, where it is printed out. Meanwhile, disks with stored data may be kept in bank headquarters and duplicate data kept on disk or tape in a warehouse across town for safekeeping. Although the equipment may vary widely, from the simplest computer to the most powerful, by and large the four elements of a computer system remain the same: input, processing, output, and storage. Now let us look at the way computers have been traditionally classified.
Classification of Computers
Computers come in sizes from tiny to monstrous, in both appearance and power. The size of a computer that a person or an organization needs depends on the computing requirements. Clearly, the National Weather Service, keeping watch on the weather fronts of many continents, has requirements different from those of a car dealer's service department that is trying to keep track of its parts inventory. And the requirements of both of them are different from the needs of a salesperson using a small laptop computer to record client orders on a sales trip.
Supercomputers The mightiest computers-and, of course, the most expensive-are known as supercomputers (Figure 1-6a). Supercomputers process billions of instructions per second. Most people do not have a direct need for the speed and power of a supercomputer. In fact, for many years supercomputer customers were an exclusive group: agencies of the federal government. The federal government uses supercomputers for tasks that require mammoth data manipulation, such as worldwide weather forecasting and weapons research. But now supercomputers are moving toward the mainstream, for activities as varied as stock analysis, automobile design, special effects for movies, and even sophisticated artworks (Figure 1-7).
Mainframes
Figure 8: Mainframe Computer
Figure 9: Mainframe Computer
In the jargon of the computer trade, large computers are called mainframes. Mainframes are capable of processing data at very high speeds-millions of instructions per second-and have access to billions of characters of data. The price of these large systems can vary from several hundred thousand to many millions of dollars. With that kind of price tag, you will not buy a mainframe for just any purpose. Their principal use is for processing vast amounts of data quickly, so some of the obvious customers are banks, insurance companies, and manufacturers. But this list is not all-inclusive; other types of customers are large mail-order houses, airlines with sophisticated reservation systems, government accounting services, aerospace companies doing complex aircraft design, and the like. In the 1960s and 1970s mainframes dominated the computer landscape. The 80s and early 90s had many people predicting that, with the advent of very powerful and affordable personal computers, that mainframes would become extinct like the huge dinosaurs in nature's progression. However, with the incredible explosion of the Internet in the mid 90s, mainframes may have been reborn. The current World Wide Web is based on the client/server paradigm, where servers on the Internet, like LL Bean's Web Server, provide services, like online shopping, to millions of people using personal computers as clients. The capacity required of these servers may be what saves the mainframe!
Personal Computers Personal computers are often called PCs. They range in price from a few hundred dollars to a few thousand dollars while providing more computing power than mainframes of the 1970s that filled entire rooms. A PC usually comes with a tower that holds the main circuit boards and disk drives of the computer, and a collection of peripherals, such as a keyboard, mouse, and monitor. In the new millennium there are two main kinds of PCs: the Apple Macintosh line, and "all of the others". The term "PC" or "IBM" refers to "all of the others", which is a historical artifact back to the days when IBM and Apple were the two main competitors in the market and IBM called its machine a "personal computer". So, although a Macintosh is a personal computer, the term "PC" often means a machine other than a Macintosh. Macintoshes and PCs, in general, can not run software that was made for the other, without some special technology added to them. They run on different microprocessors. A PC is based on a microprocessor originally made by the Intel company (such as Intel's Pentium, although other companies such as AMD now make "Pentium clones" that can run PC software.). Macintoshes use a PowerPC processor, or on older Macintoshes a processor made by Motorola. Also, the operating system software that runs the two kinds of computers is different. PCs usually use an Operating System made by Microsoft, like Windows98 or Windows2000. Macintoshes use a different operating system, called MacOS, made by Apple. There are efforts to make the two kinds of computers compatible. As Apple continues to lose its share of the market, Apple has the incentive to either join the rest or disappear.
Figure 10: Notebook Computer
Notebook Computers A computer that fits in a briefcase? A computer that weighs less than a newborn baby? A computer you do not have to plug in? A computer to use on your lap on an airplane? Yes, to all these questions. Notebook computers, also known as Laptop computers, are wonderfully portable and functional, and popular with travelers who need a computer that can go with them. Most notebooks accept diskettes or network connections, so it is easy to move data from one computer to another. Notebooks are not as inexpensive as their size might suggest; many carry a price tag equivalent to a full-size personal computer for business. They typically have almost as much computer capacity in terms of speed and storage. They do not offer the full expandability for supporting peripherals as a personal computer. For instance a MIDI computer music keyboard may not be adaptable to a notebook computer. However, more and more peripherals are providing connectivity to laptops through a technology called PCMCIA which allows peripherals to be plugged into notebook computers through credit card sized cards that easily slip into the side of a notebook computer. Normal sized PCs are still more powerful, flexible, and cheaper, but notebooks are becoming more competitive every day.
Figure 11: Handheld Computer
Getting Smaller Still Using a pen-like stylus, pen-based computers accept handwritten input directly on a screen. Users of the handheld pen-based computers, also called personal digital assistants (PDA), like the Palm, enjoy having applications such as calendars, address books, and games readily available. Recent PDA's offer Internet access, email, and cellular telephoning.
Internet and Networking
The Internet is the most widely recognized and used form of computer network . Networks connect computers to each other to allow communication and sharing of services. Originally, a computer user kept all the computer hardware in one place; that is, it was centralized in one room. Anyone wanting computer access had to go to where the computer was located. Although this is still sometimes the case, most computer systems are decentralized. That is, the computer itself and some storage devices may be in one place, but the devices to access the computer-terminals or even other computers-are scattered among the users. These devices are usually connected to the computer by telephone lines. For instance, the computer and storage that has the information on your checking account may be located in bank headquarters. but the terminals are located in branch banks all over town so a teller in any branch can find out what your balance is. The subject of decentralization is intimately tied to data communications, the process of exchanging data over communications facilities, such as the telephone. A network uses communications equipment to connect computers and their resources. In one type of network, a local area network (LAN), personal computers in an office are hooked together so that users can communicate with each other. Users can operate their personal computers independently or in cooperation with other PCs or mainframes to exchange data and share resources. We discuss computer networks in detail in a later chapter.
Software: Telling the Machine What to Do
In the past, when people thought about computers, they thought about machines. The tapping on the keyboard, the clacking of the printers, the rumble of whirling disk drives, the changing flashes of color on a computer screen-these are the attention-getters. However, it is really the software- the planned, step-by-step instructions required to turn data into information-that makes a computer useful. Categories of Software. Generally speaking, software can be categorized as system software or applications software. A subset of system software is an operating system, the underlying software found on all computers. Applications software, software that is applied, can be used to solve a particular problem or to perform a particular task. Applications software may be either custom or packaged. Many large organizations pay programmers to write custom software, software that is specifically tailored to their needs. We will use several forms of system software (e.g. Windows 2000, MacOS) and several application software programs (e.g. Word, Excel, PowerPoint) in this course. Some Task-Oriented Software. Most users, whether at home or in business, are drawn to task-oriented software, sometimes called productivity software, that can make their work faster and their lives easier. The collective set of business tasks is limited, and the number of general paths towards performing these tasks is limited, too. Thus, the tasks and the software solutions fall, for the most part, into just a few categories, which can be found in most business environments. These major categories are word processing (including desktop publishing), spreadsheets, database management, graphics, and communications. We will present a brief description of each category here.
Word Processing/Desktop Publishing The most widely used personal computer software is word processing software. This software lets you create, edit, format, store, and print text and graphics in one document. In this definition it is the three words in the middle-edit, format, and store-that reveal the difference between word processing and plain typing. Since you can store the memo or document you type on disk, you can retrieve it another time, change it, reprint it, or do whatever you like with it. You can see what a great time-saver word processing can be: unchanged parts of the stored document do not need to be retyped; the whole revised document can he reprinted as if new. As the number of features in word processing packages has grown, word processing has crossed the border into desktop publishing territory. Desktop publishing packages are usually better than word processing packages at meeting high-level publishing needs, especially when it comes to typesetting and color reproduction. Many magazines and newspapers today rely on desktop publishing software. Businesses use it to produce professional-looking newsletters, reports, and brochures-both to improve internal communication and to make a better impression on the outside world. Electronic Spreadsheets Spreadsheets, made up of columns and rows, have been used as business tools for centuries (Figure 11). A manual spreadsheet can be tedious to prepare and, when there are changes, a considerable amount of calculation may need to he redone. An electronic spreadsheet is still a spreadsheet, but the computer does the work. In particular, spreadsheet software automatically recalculates the results when a number is changed. This capability lets business people try different combinations of numbers and obtain the results quickly. This ability to ask "What if . . . ?" helps business people make better, faster decisions. In this course, we use Microsoft's Excel spreadsheet application software.
Figure 11: Spreadsheet Software
Database Management Software used for database management-the management of a collection of interrelated facts-handles data in several ways. The software can store data, update it, manipulate it, report it in a variety of views, and print it in as many forms. By the time the data is in the reporting stage-given to a user in a useful form-it has become information. A concert promoter, for example, can store and change data about upcoming concert dates, seating, ticket prices, and sales. After this is done, the promoter can use the software to retrieve information, such as the number of tickets sold in each price range or the percentage of tickets sold the day before the concert. Database software can be useful for anyone who must keep track of a large number of facts. Database software is shown in Figure 12.
Figure 12: Database Software
Graphics It might seem wasteful to show graphics to business people when standard computer printouts are readily available. However, graphics, maps, and charts can help people compare data and spot trends more easily, and make decisions more quickly. In addition, visual information is usually more compelling than a page of numbers. We use Microsoft's PowerPoint and Adobe's Photoshop application software for graphics. We use it in two ways: for doing original drawings, and for creating visual aids to project as a support to an oral presentation.
Communications We have already described communications in a general way. From the viewpoint of a worker with a personal computer at home, communications means-in simple terms-that he or she can hook a phone up to the computer and communicate with the computer at the office, or get at data stored in someone else's computer in another location.
Cleaning the computer and its components
Updated: 01/24/2018 by Computer Hope
Cleaning your computer, components, and peripherals help keep everything in good working condition, helps prevent germs from spreading, and helps allow proper air flow. The picture shows a good example of just how dirty the inside of your computer case can get. Just looking at this picture it is immediately obvious that all the dust and dirt is going to prevent proper air flow and may even prevent the fan from working.
The frequency of how often you should clean your computer varies on different factors. To help you determine how often you need to clean your computer, we created the checklist below. Check each of the boxes below that apply to your computer's conditions to help determine how often you should clean the computer.
General Cleaning Tips
Below is a listing of suggestions to follow when cleaning any computer components or peripherals as well as tips to help keep a computer clean.
Never spray or squirt any liquid onto any computer component. If a spray is needed, spray the liquid onto a cloth.
You can use a vacuum to suck up dirt, dust, or hair around the computer. However, do not use a vacuum inside your computer as it generates static electricity that can damage your computer. If you need to use a vacuum inside your computer, use a portable battery powered vacuum or try compressed air.
When cleaning a component or the computer, turn it off before cleaning.
Be cautious when using any cleaning solvents; some people have allergic reactions to chemicals in cleaning solvents, and some solvents can even damage the case. Try always to use water or a highly diluted solvent.
When cleaning, be careful to not accidentally adjust any knobs or controls. Also, when cleaning the back of the computer, if anything is connected make sure not to disconnect the plugs.
When cleaning fans, especially smaller fans, hold the fan or place something in-between the fan blades to prevent it from spinning. Spraying compressed air into a fan or cleaning a fan with a vacuum may cause damage or generate a back voltage.
Never eat or drink around the computer.
Limit smoking around the computer.
Cleaning Tools
Although computer cleaning products are available, you can also use household items to clean your computer and its peripherals. Below is a listing of items you may need or want to use while cleaning your computer.
Cloth - A cotton cloth is the best tool used when rubbing down computer components. Paper towels can be used with most hardware, but we always recommend using a cloth whenever possible. However, only use a cloth when cleaning components such as the case, a drive, mouse, and keyboard. You should not use a cloth to clean any circuitry such as the RAM or motherboard.
Water or rubbing alcohol - When moistening a cloth, it is best to use water or rubbing alcohol. Other solvents may be bad for the plastics used with your computer.
Portable Vacuum - Sucking the dust, dirt, hair, cigarette particles, and other particles out of a computer can be one of the best methods of cleaning a computer. However, do not use a vacuum that plugs into the wall since it creates lots of static electricity that can damage your computer.
Cotton swabs - Cotton swaps moistened with rubbing alcohol or water are excellent tools for wiping hard to reach areas in your keyboard, mouse, and other locations.
Foam swabs - Whenever possible, it is better to use lint-free swabs such as foam swabs.
Tip: See our computer tools page for a list of other tools every technician should have.
Case Cleaning
Why? Cleaning your case keeps the appearance of the computer looking new. While cleaning, if you see ventilation slots, these can be cleaned or cleared to help keep a steady airflow into the computer and keep all components cool.
Procedure: The plastic case that houses the PC components can be cleaned with a slightly damp lint-free cloth. For stubborn stains, add a little household detergent to the cloth. You should not use a solvent cleaner on plastics.
Make sure all vents and air holes are hair and lint free by rubbing a cloth over the holes and vents. It is also helpful to take a vacuum around each of the hole, vents, and crevices on the computer. It is safe to use a standard vacuum when cleaning the outside vents of a computer.
If you are looking for steps on cleaning the inside of the computer, see the motherboard cleaning section.
Why? A dirty CD-ROM drive or other disc drives can cause read errors when reading discs. These read errors could cause software installation issues or issues while running the program.
Procedure: To clean the CD-ROM drive we recommend purchasing a CD-ROM cleaner from your local computer retailer. Using a CD-ROM cleaner should sufficiently clean the CD-ROM laser from dust, dirt, and hair.
You can also use a cloth dampened with water to clean the tray that ejects from the drive. However, make sure that after the tray is cleaned that it completely dry before putting the tray back into the drive.
Why? Dirty CDs can cause read errors or cause CDs to not work at all.
Procedure: Use a cleaning kit or damp clean cotton cloth to clean CDs, DVDs, and other discs. When cleaning a disc wipe against the tracks, starting from the middle of the CD or DVD and wiping towards the outer side as shown in the picture below. Never wipe with the tracks; doing so may put more scratches on the disc.
Tip: If the substance on a CD cannot be removed using water, pure alcohol can also be used.
Hard Drive Cleaning
Why? Computer hard drives cannot be cleaned. However, they can be cleaned with software utilities to help it run fast and efficiently. Utilizing these utilities prevent the hard drive from slowing down.
Procedure: Refer to our basic troubleshooting section for your operating system for steps that can be done to help improve the performance of your computer.
Why?Headphones and headsets can be used by many different people and may need to be frequently cleaned to help prevent the spreading of germs and head lice.
Procedure: If the headphones being used are plastic or vinyl, moisten a cloth with warm water and rub the head and earpieces of the headphones.
Note: If the headphones are being used for a library or school, do not use any disinfectant or cleaning solvent since some people can have allergic reactions to the chemicals they contain.
Headphones that have cushions also have the availability of having the cushions replaced. Replacing these cushions can also help keep the headphones clean.
Finally, in regards to headphones spreading head lice. If different students use the same headphones, have students use their own headphones, place bags over the headphones, or using headphones that can be wiped with warm water after each use.
Keyboard Cleaning
These steps are for cleaning a desktop keyboard. See the cleaning a laptop keyboard page for laptop steps.
Dust, dirt, and bacteria
The computer keyboard is usually the most germ infected items in your home or office. A keyboard may even contain more bacteria than your toilet seat. Cleaning it helps remove any dangerous bacteria and keeps the keyboard working properly.
Procedure: Before cleaning the keyboard first turn off the computer or if you are using a USB keyboard unplug it. Not unplugging the keyboard can cause other computer problems as you may press keys that cause the computer to perform a task you do not want it to perform.
Many people clean the keyboard by turning it upside down and shaking. A more efficient method is to use compressed air. Compressed air is pressurized air contained in a can with a very long nozzle. To clean a keyboard using compressed air aim between the keys and blow away all of the dust and debris that has gathered there. A vacuum cleaner can also be used, but make sure the keyboard does not have loose "pop off" keys can be sucked up by the vacuum.
After the dust, dirt, and hair have been removed. Spray a disinfectant onto a cloth or use disinfectant cloths and rub each of the keys on the keyboard. As mentioned in our general cleaning tips, never spray any liquid onto the keyboard.
Substance spilled into the keyboard
If the keyboard has anything spilled on it (e.g., pop, cola, Pepsi, Coke, beer, wine, coffee, and milk), not taking the proper steps can destroy the keyboard.
Procedure: Below is recommendations that can help prevent a keyboard from becoming bad after something has spilled into the keys.
If anything is spilled onto the keyboard turn the computer off immediately or at the very least disconnect the keyboard from the computer. Once done flip the keyboard over to prevent the substance from penetrating circuits. While the keyboard is upside down, shake the keyboard over a surface that can be cleaned later. While still upside down, use a cloth to start cleaning the keys. After cleaned leave the keyboard upside down for at least one night allowing it to dry. Once dry, continue cleaning the keyboard with any remaining substance.
If after cleaning the keyboard keys are sticking, remove the keys and clean below the keys and the bottom portion of the key.
Finally, if the keyboard still works but remains dirty or sticky before discarding the keyboard as a last resort try washing the keyboard in the dishwasher.
If after doing all the above steps the keyboard still does not work we recommend buying a new keyboard.
Why? Dirt, dust, and fingerprints can cause the computer screen to be difficult to read.
Procedure: Unlike a CRT computer monitor, the LCD or LED monitor is not glass and requires special cleaning procedures.
When cleaning the LCD or LED screen, it is important to remember to not spray any liquids onto the screen directly. Press gently while cleaning and do not use a paper towel, since it can scratch the screen.
To clean the LCD or LED screen, use a non-rugged microfiber cloth, soft cotton cloth, or Swiffer duster. If a dry cloth does not completely clean the screen, you can apply rubbing alcohol to the cloth and wipe the screen with a damp cloth. Rubbing alcohol is used to clean LCD and LED monitors before it leaves the factory.
Why? Dirt, dust, and fingerprints can cause the computer screen to be difficult to read.
Procedure: A glass monitor screen can be cleaned with ordinary household glass cleaner. Be sure to unplug the power cord from the monitor and spray the cleaner onto a lint-free cloth so the fluid does not leak into the electrical components inside the monitor. Vacuum off any dust that has settled on top of the monitor and make sure no books or papers are covering the air vents. Obstructed monitor vents can cause the monitor to overheat or even catch on fire.
Caution: We suggest only using a cloth dampened with water when cleaning non-glass monitors or any anti-glare screens. Using ordinary household glass cleaner on special screens, especially cleaners with ammonia, can remove anti-glare protection or other special surfaces.
Why? Dust and especially particles of cigarette smoke can build up and corrode circuitry, causing various problems such as computer lockups.
Caution: When inside the computer, take the necessary ESD precautions and try to avoid unplugging any cables or other connections.
Procedure: Our recommendation when cleaning the motherboard from dust, dirt, or hair is to use compressed air. When using compressed air, hold it in the upright position to prevent any of the chemicals from coming out of the container, which may damage or corrode the motherboard or other components. Also, ensure when using compressed air that you always blow the dust or dirt away from the motherboard or out of the case.
Another good alternative to compressed air is a portable battery powered vacuum. Portable vacuums can effectively remove the dust, dirt, and hair from the motherboard completely and prevent it from getting trapped within the case.
Warning: Never use an electricity powered vacuum, as it can cause lots of static electricity that can damage the computer. When using a vacuum, keep it a couple inches away from the motherboard and all other components to prevent damage and anything from being sucked into the vacuum (e.g., jumpers or small cables).
Tip: When cleaning the inside of the case, also look at any fans or heat sinks. Dust, dirt, and hair can collect around these components the most.
Why? A dirty optical or laser mouse can cause the mouse cursor to be difficult to move or move erratically.
Procedure: Use a can of compressed air that is designed for use with electronic equipment, spraying around the optical sensor on the bottom of the mouse. Blowing air on the bottom of the mouse clears away any dirt, dust, hair, or other obstructions that may be blocking the optical sensor.
Avoid using any cleaning chemicals or wiping a cloth directly on the optical sensor, as it could scratch or damage the optical sensor.
Optical-Mechanical (Ball) Mouse
Why? A dirty optical-mechanical mouse (mouse with a ball) can cause the mouse to be difficult to move, as well as cause strange mouse movement.
Procedure: To clean the rollers of an optical-mechanical mouse, you must first remove the bottom cover of the mouse. To do this, examine the bottom of the mouse to see what direction to rotate the cover. As you can see in the below illustration, the mouse cover must be moved counter clockwise. Place two fingers on the mouse cover, push down and rotate in the direction of the arrows.
Once the cover has rotated about an inch, rotate the mouse into its normal position, covering the bottom of the mouse with one hand. The bottom should then fall off, including the mouse ball. If the cover does not fall off, try shaking the mouse gently.
Once the bottom cover and the ball is removed, you should be able to see three rollers located inside the mouse. Use a cotton swab, finger, or fingernail to remove any substances on the rollers. Usually, there is a small line of hair and dirt in the middle of the roller. Remove as much of this substance as possible.
Once you have removed as much dirt and hair as possible, set the ball back within the mouse and place the cover back on.
If the mouse still has the same problems, repeat the above process. If after several attempts the mouse is still having the same problems, your mouse has other hardware issues and should be replaced.
Note: Cleaning your mouse pad with a damp cloth can also help improve a computer's mouse movement.
All Types of Mice
Why? To help keep the mouse clean and germ-free, it can be helpful to clean the mouse.
Procedure: Use a cloth moistened with rubbing alcohol or warm water and rub the surface of the mouse and each of its buttons.
Why? Cleaning the outside of a printer can help keep the printer's appearance looking good and if used by many different people keep the printer clean of germs.
Procedure: First, make sure to turn off the printer before cleaning it. Dampen a cloth with water or rubbing alcohol and wipe the case and each of the buttons or knobs on the printer. As mentioned earlier, never spray any liquid directly onto the printer.
Why? Some printers require the inside to be cleaned to help keep the printer running smoothly.
Why? Flatbed scanners commonly become dirty with dust, fingerprints, and hair. When the scanner is dirty, the images may have distortions.
Procedure: Clean a flatbed scanner's surface by spraying a window cleaner onto a paper towel or cotton cloth and wipe the glass until clean. As mentioned earlier, never spray a liquid directly onto the component.
The same towel or cotton cloth can also be used to clean the outside of the scanner.
Below are a listing of miscellaneous computer hardware that is rarely used today, but kept on this page people working on older computers and need to clean these devices.
Floppy drive cleaning
Why? Dirty read/write heads on the floppy drive can cause errors during the reading or writing process.
Procedures: The floppy drive can be cleaned two different ways. The first method of cleaning a floppy drive is to purchase a kit at your local retail store designed to clean the read/write heads on your floppy drive.
The second method of cleaning the floppy drive is only recommended for experienced computer users. Open the floppy drive casing and physically swab the read/write heads with a lint-free foam swab soaked in pure alcohol, free-on, or trichloroethane. When performing these steps, be extremely careful when cleaning the heads to ensure that you do not lock them out of alignment causing the floppy drive to not work. To help prevent the heads from becoming out of alignment, use a dabbing motion lightly putting the swab on the head and removing it, do not perform a side-to-side motion with the swab.
Why? Dirty touch screens can cause difficult navigation.
Procedure: To clean the PalmPilot screen, use a soft cloth moistened with rubbing alcohol and rub the screen and the casing of the palm pilot. It is not recommended to use glass cleaner as it could damage plastics over time.
SuperDisk and LS120 cleaning
Why? Cleaning the SuperDisk and LS120 prevents the drive heads from becoming dirty.
Procedure: Purchase the SuperDisk cleaning kit available through Imation. Using any other method voids the warranty on your drive.
Electric Circuit Analysis
This course deals with the fundamentals of electric circuits, their components and the mathematical tools used to represent and analyze electrical circuits. By the end of the course, the student must be able to confidently analyze and build simple electric circuits.
It cannot be emphasized enough that as a foundation course it is important to understand the basics laid out in this course. Read carefully through given material and attempt all quizzes/questionnaires in this course.
Learn by doing, try out all home laboratories and don't forget to follow necessary precautionary measures.
As little as 10 mA AC current can cause temporary paralysis and an inability to let go or withdraw from the current source. If the current bypasses the skin, as little as 10 uA may cause heart failure. Direct current is much less dangerous, unless voltages are high or there is direct connection bypassing the skin. Wet skin has lower resistance, never approach AC-mains-connected electrical equipment or wiring with wet skin or bare feet. Pay special attention to proper grounding of AC power plugs and of anything which may be, deliberately or accidentally, connected to a hot (energized) wire. With good grounding, an accidental short circuit is likely to blow a fuse or circuit breaker, instead of maintaining a shock hazard. Low-voltage circuits, up to 12 VAC or DC may be handled quite safely, as long as the skin is not bypassed (such as with wide contact -- such as grasping non-insulated pliers -- or wet skin, or a metal ring). Working with higher voltages requires serious caution.
Syllabus
By the end of the course a student must be comfortable with the following:
Circuit Variables
Circuit Elements
Simple Resistive Circuits
Techniques of Circuit Analysis
Kirchhoff's Voltage Law Problems
Kirchhoff's Current Law Problems
Nodal Analysis Problems
Mesh Analysis Problems
Prerequisites
This is a level 1 course. It is assumed that the student has undertaken all currently available Level 0 courses. The following courses ( topics ) are recommended pre-requisite materials before registering/attempting this course.
The following is based on the typical problem solving techniques and tricks that professors and tutors have reported as helpful in solving circuit analysis problems:
Don't convert fractions until the last step in the problem
Be able to re-derive any needed equation from the basic V=I*R and P=I*V equations
Learn Cramer's rule
Often KW are divided by mA so don't bother moving the decimal around to the end
Draw every problem out
Never forget the ground
Try using symbols in working out your expressions and only substitute numbers at the final stage
If you keep your calculation parallel to your line of thought, then you will avoid many pitfalls
Analysis Technique
The goal of series-parallel resistor circuit analysis is to be able to determine all voltage drops, currents, and power dissipations in a circuit. The general strategy to accomplish this goal is as follows:
Step 1: Assess which resistors in a circuit are connected together in simple series or simple parallel.
Step 2: Re-draw the circuit, replacing each of those series or parallel resistor combinations identified in step 1 with a single, equivalent-value resistor. If using a table to manage variables, make a new table column for each resistance equivalent.
Step 3: Repeat steps 1 and 2 until the entire circuit is reduced to one equivalent resistor.
Step 4: Calculate total current from total voltage and total resistance (I=E/R).
Step 5: Taking total voltage and total current values, go back to last step in the circuit reduction process and insert those values where applicable.
Step 6: From known resistances and total voltage / total current values from step 5, use Ohm’s Law to calculate unknown values (voltage or current) (E=IR or I=E/R).
Step 7: Repeat steps 5 and 6 until all values for voltage and current are known in the original circuit configuration. Essentially, you will proceed step-by-step from the simplified version of the circuit back into its original, complex form, plugging in values of voltage and current where appropriate until all values of voltage and current are known.
This may sound like an intimidating process, but its much easier understood through example than through description.
In the example circuit above, R1 and R2 are connected in a simple parallel arrangement, as are R3 and R4. Having been identified, these sections need to be converted into equivalent single resistors, and the circuit re-drawn:
The double slash (//) symbols represent “parallel” to show that the equivalent resistor values were calculated using the 1/(1/R) formula. The 71.429 Ω resistor at the top of the circuit is the equivalent of R1and R2 in parallel with each other. The 127.27 Ω resistor at the bottom is the equivalent of R3 and R4 in parallel with each other.
Our table can be expanded to include these resistor equivalents in their own columns:
It should be apparent now that the circuit has been reduced to a simple series configuration with only two (equivalent) resistances. The final step in reduction is to add these two resistances to come up with a total circuit resistance. When we add those two equivalent resistances, we get a resistance of 198.70 Ω. Now, we can re-draw the circuit as a single equivalent resistance and add the total resistance figure to the rightmost column of our table. Note that the “Total” column has been relabeled (R1//R2—R3//R4) to indicate how it relates electrically to the other columns of figures. The “—” symbol is used here to represent “series,” just as the “//” symbol is used to represent “parallel.”
Now, total circuit current can be determined by applying Ohm’s Law (I=E/R) to the “Total” column in the table:
Back to our equivalent circuit drawing, our total current value of 120.78 milliamps is shown as the only current here:
Now we start to work backwards in our progression of circuit re-drawings to the original configuration. The next step is to go to the circuit where R1//R2 and R3//R4 are in series:
Since R1//R2 and R3//R4 are in series with each other, the current through those two sets of equivalent resistances must be the same. Furthermore, the current through them must be the same as the total current, so we can fill in our table with the appropriate current values, simply copying the current figure from the Total column to the R1//R2 and R3//R4 columns:
Now, knowing the current through the equivalent resistors R1//R2 and R3//R4, we can apply Ohm’s Law (E=IR) to the two right vertical columns to find voltage drops across them:
Because we know R1//R2 and R3//R4 are parallel resistor equivalents, and we know that voltage drops in parallel circuits are the same, we can transfer the respective voltage drops to the appropriate columns on the table for those individual resistors. In other words, we take another step backwards in our drawing sequence to the original configuration, and complete the table accordingly:
Finally, the original section of the table (columns R1 through R4) is complete with enough values to finish. Applying Ohm’s Law to the remaining vertical columns (I=E/R), we can determine the currents through R1, R2, R3, and R4 individually:
Having found all voltage and current values for this circuit, we can show those values in the schematic diagram as such:
As a final check of our work, we can see if the calculated current values add up as they should to the total. Since R1 and R2 are in parallel, their combined currents should add up to the total of 120.78 mA. Likewise, since R3 and R4 are in parallel, their combined currents should also add up to the total of 120.78 mA. You can check for yourself to verify that these figures do add up as expected.
A computer simulation can also be used to verify the accuracy of these figures. The following SPICE analysis will show all resistor voltages and currents (note the current-sensing vi1, vi2, . . . “dummy” voltage sources in series with each resistor in the netlist, necessary for the SPICE computer program to track current through each path). These voltage sources will be set to have values of zero volts each so they will not affect the circuit in any way.
series-parallel circuit
v1 1 0
vi1 1 2 dc 0
vi2 1 3 dc 0
r1 2 4 100
r2 3 4 250
vi3 4 5 dc 0
vi4 4 6 dc 0
r3 5 0 350
r4 6 0 200
.dc v1 24 24 1
.print dc v(2,4) v(3,4) v(5,0) v(6,0)
.print dc i(vi1) i(vi2) i(vi3) i(vi4)
.end
I’ve annotated SPICE’s output figures to make them more readable, denoting which voltage and current figures belong to which resistors.
v1            v(2,4)      v(3,4)      v(5)        v(6)
2.400E+01     8.627E+00   8.627E+00   1.537E+01   1.537E+01
Battery       R1 voltage  R2 voltage  R3 voltage  R4 voltage
voltage
v1            i(vi1)      i(vi2)      i(vi3)      i(vi4)
2.400E+01     8.627E-02   3.451E-02   4.392E-02   7.686E-02
Battery       R1 current  R2 current  R3 current  R4 current
voltage
As you can see, all the figures do agree with the our calculated values.
REVIEW:
To analyze a series-parallel combination circuit, follow these steps:
Reduce the original circuit to a single equivalent resistor, re-drawing the circuit in each step of reduction as simple series and simple parallel parts are reduced to single, equivalent resistors.
Solve for total resistance.
Solve for total current (I=E/R).
Determine equivalent resistor voltage drops and branch currents one stage at a time, working backwards to the original circuit configuration again.
Re-drawing Complex Schematics
Typically, complex circuits are not arranged in nice, neat, clean schematic diagrams for us to follow. They are often drawn in such a way that makes it difficult to follow which components are in series and which are in parallel with each other. The purpose of this section is to show you a method useful for re-drawing circuit schematics in a neat and orderly fashion. Like the stage-reduction strategy for solving series-parallel combination circuits, it is a method easier demonstrated than described.
Let’s start with the following (convoluted) circuit diagram. Perhaps this diagram was originally drawn this way by a technician or engineer. Perhaps it was sketched as someone traced the wires and connections of a real circuit. In any case, here it is in all its ugliness:
With electric circuits and circuit diagrams, the length and routing of wire connecting components in a circuit matters little. (Actually, in some AC circuits it becomes critical, and very long wire lengths can contribute unwanted resistance to both AC and DC circuits, but in most cases wire length is irrelevant.) What this means for us is that we can lengthen, shrink, and/or bend connecting wires without affecting the operation of our circuit.
The strategy I have found easiest to apply is to start by tracing the current from one terminal of the battery around to the other terminal, following the loop of components closest to the battery and ignoring all other wires and components for the time being. While tracing the path of the loop, mark each resistor with the appropriate polarity for voltage drop.
In this case, I’ll begin my tracing of this circuit at the negative terminal of the battery and finish at the positive terminal, in the same general direction as the electrons would flow. When tracing this direction, I will mark each resistor with the polarity of negative on the entering side and positive on the exiting side, for that is how the actual polarity will be as electrons (negative in charge) enter and exit a resistor:
Any components encountered along this short loop are drawn vertically in order:
Now, proceed to trace any loops of components connected around components that were just traced. In this case, there’s a loop around R1 formed by R2, and another loop around R3 formed by R4:
Tracing those loops, I draw R2 and R4 in parallel with R1 and R3 (respectively) on the vertical diagram. Noting the polarity of voltage drops across R3 and R1, I mark R4 and R2 likewise:
Now we have a circuit that is very easily understood and analyzed. In this case, it is identical to the four-resistor series-parallel configuration we examined earlier in the chapter.
Let’s look at another example, even uglier than the one before:
The first loop I’ll trace is from the negative (-) side of the battery, through R6, through R1, and back to the positive (+) end of the battery:
Re-drawing vertically and keeping track of voltage drop polarities along the way, our equivalent circuit starts out looking like this:
Next, we can proceed to follow the next loop around one of the traced resistors (R6), in this case, the loop formed by R5 and R7. As before, we start at the negative end of R6 and proceed to the positive end of R6, marking voltage drop polarities across R7 and R5 as we go:
Now we add the R5—R7 loop to the vertical drawing. Notice how the voltage drop polarities across R7 and R5 correspond with that of R6, and how this is the same as what we found tracing R7 and R5 in the original circuit:
We repeat the process again, identifying and tracing another loop around an already-traced resistor. In this case, the R3—R4 loop around R5 looks like a good loop to trace next:
Adding the R3—R4 loop to the vertical drawing, marking the correct polarities as well:
With only one remaining resistor left to trace, then next step is obvious: trace the loop formed by R2 around R3:
Adding R2 to the vertical drawing, and we’re finished! The result is a diagram that’s very easy to understand compared to the original:
This simplified layout greatly eases the task of determining where to start and how to proceed in reducing the circuit down to a single equivalent (total) resistance. Notice how the circuit has been re-drawn, all we have to do is start from the right-hand side and work our way left, reducing simple-series and simple-parallel resistor combinations one group at a time until we’re done.
In this particular case, we would start with the simple parallel combination of R2 and R3, reducing it to a single resistance. Then, we would take that equivalent resistance (R2//R3) and the one in series with it (R4), reducing them to another equivalent resistance (R2//R3—R4). Next, we would proceed to calculate the parallel equivalent of that resistance (R2//R3—R4) with R5, then in series with R7, then in parallel with R6, then in series with R1 to give us a grand total resistance for the circuit as a whole.
From there we could calculate total current from total voltage and total resistance (I=E/R), then “expand” the circuit back into its original form one stage at a time, distributing the appropriate values of voltage and current to the resistances as we go.
REVIEW:
Wires in diagrams and in real circuits can be lengthened, shortened, and/or moved without affecting circuit operation.
To simplify a convoluted circuit schematic, follow these steps:
Trace current from one side of the battery to the other, following any single path (“loop”) to the battery. Sometimes it works better to start with the loop containing the most components, but regardless of the path taken the result will be accurate. Mark polarity of voltage drops across each resistor as you trace the loop. Draw those components you encounter along this loop in a vertical schematic.
Mark traced components in the original diagram and trace remaining loops of components in the circuit. Use polarity marks across traced components as guides for what connects where. Document new components in loops on the vertical re-draw schematic as well.
Repeat last step as often as needed until all components in original diagram have been traced.
Component Failure Analysis
There is a lot of truth to that quote from Dirac. With a little modification, I can extend his wisdom to electric circuits by saying, “I consider that I understand a circuit when I can predict the approximate effects of various changes made to it without actually performing any calculations.”
At the end of the series and parallel circuits chapter, we briefly considered how circuits could be analyzed in a qualitative rather than quantitative manner. Building this skill is an important step towards becoming a proficient troubleshooter of electric circuits. Once you have a thorough understanding of how any particular failure will affect a circuit (i.e. you don’t have to perform any arithmetic to predict the results), it will be much easier to work the other way around: pinpointing the source of trouble by assessing how a circuit is behaving.
Also shown at the end of the series and parallel circuits chapter was how the table method works just as well for aiding failure analysis as it does for the analysis of healthy circuits. We may take this technique one step further and adapt it for total qualitative analysis. By “qualitative” I mean working with symbols representing “increase,” “decrease,” and “same” instead of precise numerical figures. We can still use the principles of series and parallel circuits, and the concepts of Ohm’s Law, we’ll just use symbolic qualities instead of numerical quantities. By doing this, we can gain more of an intuitive “feel” for how circuits work rather than leaning on abstract equations, attaining Dirac’s definition of “understanding.”
Enough talk. Let’s try this technique on a real circuit example and see how it works:
This is the first “convoluted” circuit we straightened out for analysis in the last section. Since you already know how this particular circuit reduces to series and parallel sections, I’ll skip the process and go straight to the final form:
R3 and R4 are in parallel with each other; so are R1 and R2. The parallel equivalents of R3//R4 and R1//R2are in series with each other. Expressed in symbolic form, the total resistance for this circuit is as follows:
RTotal = (R1//R2)—(R3//R4)
First, we need to formulate a table with all the necessary rows and columns for this circuit:
Next, we need a failure scenario. Let’s suppose that resistor R2 were to fail shorted. We will assume that all other components maintain their original values. Because we’ll be analyzing this circuit qualitatively rather than quantitatively, we won’t be inserting any real numbers into the table. For any quantity unchanged after the component failure, we’ll use the word “same” to represent “no change from before.” For any quantity that has changed as a result of the failure, we’ll use a down arrow for “decrease” and an up arrow for “increase.” As usual, we start by filling in the spaces of the table for individual resistances and total voltage, our “given” values:
The only “given” value different from the normal state of the circuit is R2, which we said was failed shorted (abnormally low resistance). All other initial values are the same as they were before, as represented by the “same” entries. All we have to do now is work through the familiar Ohm’s Law and series-parallel principles to determine what will happen to all the other circuit values.
First, we need to determine what happens to the resistances of parallel subsections R1//R2 and R3//R4. If neither R3 nor R4 have changed in resistance value, then neither will their parallel combination. However, since the resistance of R2 has decreased while R1 has stayed the same, their parallel combination must decrease in resistance as well:
Now, we need to figure out what happens to the total resistance. This part is easy: when we’re dealing with only one component change in the circuit, the change in total resistance will be in the same direction as the change of the failed component. This is not to say that the magnitude of change between individual component and total circuit will be the same, merely the direction of change. In other words, if any single resistor decreases in value, then the total circuit resistance must also decrease, and vice versa. In this case, since R2 is the only failed component, and its resistance has decreased, the total resistance must decrease:
Now we can apply Ohm’s Law (qualitatively) to the Total column in the table. Given the fact that total voltage has remained the same and total resistance has decreased, we can conclude that total current must increase (I=E/R).
In case you’re not familiar with the qualitative assessment of an equation, it works like this. First, we write the equation as solved for the unknown quantity. In this case, we’re trying to solve for current, given voltage and resistance:
Now that our equation is in the proper form, we assess what change (if any) will be experienced by “I,” given the change(s) to “E” and “R”:
If the denominator of a fraction decreases in value while the numerator stays the same, then the overall value of the fraction must increase:
Therefore, Ohm’s Law (I=E/R) tells us that the current (I) will increase. We’ll mark this conclusion in our table with an “up” arrow:
With all resistance places filled in the table and all quantities determined in the Total column, we can proceed to determine the other voltages and currents. Knowing that the total resistance in this table was the result of R1//R2 and R3//R4 in series, we know that the value of total current will be the same as that in R1//R2 and R3//R4 (because series components share the same current). Therefore, if total current increased, then current through R1//R2 and R3//R4 must also have increased with the failure of R2:
Fundamentally, what we’re doing here with a qualitative usage of Ohm’s Law and the rules of series and parallel circuits is no different from what we’ve done before with numerical figures. In fact, its a lot easier because you don’t have to worry about making an arithmetic or calculator keystroke error in a calculation. Instead, you’re just focusing on the principles behind the equations. From our table above, we can see that Ohm’s Law should be applicable to the R1//R2 and R3//R4 columns. For R3//R4, we figure what happens to the voltage, given an increase in current and no change in resistance. Intuitively, we can see that this must result in an increase in voltage across the parallel combination of R3//R4:
But how do we apply the same Ohm’s Law formula (E=IR) to the R1//R2 column, where we have resistance decreasing and current increasing? It’s easy to determine if only one variable is changing, as it was with R3//R4, but with two variables moving around and no definite numbers to work with, Ohm’s Law isn’t going to be much help. However, there is another rule we can apply horizontally to determine what happens to the voltage across R1//R2: the rule for voltage in series circuits. If the voltages across R1//R2 and R3//R4 add up to equal the total (battery) voltage and we know that the R3//R4 voltage has increased while total voltage has stayed the same, then the voltage across R1//R2must have decreased with the change of R2‘s resistance value:
Now we’re ready to proceed to some new columns in the table. Knowing that R3 and R4 comprise the parallel subsection R3//R4, and knowing that voltage is shared equally between parallel components, the increase in voltage seen across the parallel combination R3//R4 must also be seen across R3 and R4individually:
The same goes for R1 and R2. The voltage decrease seen across the parallel combination of R1 and R2 will be seen across R1 and R2 individually:
Applying Ohm’s Law vertically to those columns with unchanged (“same”) resistance values, we can tell what the current will do through those components. Increased voltage across an unchanged resistance leads to increased current. Conversely, decreased voltage across an unchanged resistance leads to decreased current:
Once again we find ourselves in a position where Ohm’s Law can’t help us: for R2, both voltage and resistance have decreased, but without knowing how much each one has changed, we can’t use the I=E/R formula to qualitatively determine the resulting change in current. However, we can still apply the rules of series and parallel circuits horizontally. We know that the current through the R1//R2 parallel combination has increased, and we also know that the current through R1 has decreased. One of the rules of parallel circuits is that total current is equal to the sum of the individual branch currents. In this case, the current through R1//R2 is equal to the current through R1 added to the current through R2. If current through R1//R2has increased while current through R1 has decreased, current through R2must have increased:
And with that, our table of qualitative values stands completed. This particular exercise may look laborious due to all the detailed commentary, but the actual process can be performed very quickly with some practice. An important thing to realize here is that the general procedure is little different from quantitative analysis: start with the known values, then proceed to determining total resistance, then total current, then transfer figures of voltage and current as allowed by the rules of series and parallel circuits to the appropriate columns.
A few general rules can be memorized to assist and/or to check your progress when proceeding with such an analysis:
For any single component failure (open or shorted), the total resistance will always change in the same direction (either increase or decrease) as the resistance change of the failed component.
When a component fails shorted, its resistance always decreases. Also, the current through it will increase, and the voltage across it may drop. I say “may” because in some cases it will remain the same (case in point: a simple parallel circuit with an ideal power source).
When a component fails open, its resistance always increases. The current through that component will decrease to zero, because it is an incomplete electrical path (no continuity). This may result in an increase of voltage across it. The same exception stated above applies here as well: in a simple parallel circuit with an ideal voltage source, the voltage across an open-failed component will remain unchanged.
Building Series-Parallel Resistor Circuits
Once again, when building battery/resistor circuits, the student or hobbyist is faced with several different modes of construction. Perhaps the most popular is the solderless breadboard: a platform for constructing temporary circuits by plugging components and wires into a grid of interconnected points. A breadboard appears to be nothing but a plastic frame with hundreds of small holes in it. Underneath each hole, though, is a spring clip which connects to other spring clips beneath other holes. The connection pattern between holes is simple and uniform:
The recommended way to do so on a breadboard would be to arrange the resistors in approximately the same pattern as seen in the schematic, for ease of relation to the schematic. If 24 volts is required and we only have 6-volt batteries available, four may be connected in series to achieve the same effect:
This is by no means the only way to connect these four resistors together to form the circuit shown in the schematic. Consider this alternative layout:
If greater permanence is desired without resorting to soldering or wire-wrapping, one could choose to construct this circuit on a terminal strip (also called a barrier strip, or terminal block). In this method, components and wires are secured by mechanical tension underneath screws or heavy clips attached to small metal bars. The metal bars, in turn, are mounted on a nonconducting body to keep them electrically isolated from each other.
Building a circuit with components secured to a terminal strip isn’t as easy as plugging components into a breadboard, principally because the components cannot be physically arranged to resemble the schematic layout. Instead, the builder must understand how to “bend” the schematic’s representation into the real-world layout of the strip. Consider one example of how the same four-resistor circuit could be built on a terminal strip:
Another terminal strip layout, simpler to understand and relate to the schematic, involves anchoring parallel resistors (R1//R2 and R3//R4) to the same two terminal points on the strip like this:
Building more complex circuits on a terminal strip involves the same spatial-reasoning skills, but of course requires greater care and planning. Take for instance this complex circuit, represented in schematic form:
The terminal strip used in the prior example barely has enough terminals to mount all seven resistors required for this circuit! It will be a challenge to determine all the necessary wire connections between resistors, but with patience it can be done. First, begin by installing and labeling all resistors on the strip. The original schematic diagram will be shown next to the terminal strip circuit for reference:
Next, begin connecting components together wire by wire as shown in the schematic. Over-draw connecting lines in the schematic to indicate completion in the real circuit. Watch this sequence of illustrations as each individual wire is identified in the schematic, then added to the real circuit:
Although there are minor variations possible with this terminal strip circuit, the choice of connections shown in this example sequence is both electrically accurate (electrically identical to the schematic diagram) and carries the additional benefit of not burdening any one screw terminal on the strip with more than two wire ends, a good practice in any terminal strip circuit.
An example of a “variant” wire connection might be the very last wire added (step 11), which I placed between the left terminal of R2 and the left terminal of R3. This last wire completed the parallel connection between R2 and R3 in the circuit. However, I could have placed this wire instead between the left terminal of R2 and the right terminal of R1, since the right terminal of R1 is already connected to the left terminal of R3(having been placed there in step 9) and so is electrically common with that one point. Doing this, though, would have resulted in three wires secured to the right terminal of R1 instead of two, which is a faux pax in terminal strip etiquette. Would the circuit have worked this way? Certainly! It’s just that more than two wires secured at a single terminal makes for a “messy” connection: one that is aesthetically unpleasing and may place undue stress on the screw terminal.
Another variation would be to reverse the terminal connections for resistor R7. As shown in the last diagram, the voltage polarity across R7 is negative on the left and positive on the right (- , +), whereas all the other resistor polarities are positive on the left and negative on the right (+ , -):
While this poses no electrical problem, it might cause confusion for anyone measuring resistor voltage drops with a voltmeter, especially an analog voltmeter which will “peg” downscale when subjected to a voltage of the wrong polarity. For the sake of consistency, it might be wise to arrange all wire connections so that all resistor voltage drop polarities are the same, like this:
Though electrons do not care about such consistency in component layout, people do. This illustrates an important aspect of any engineering endeavor: the human factor. Whenever a design may be modified for easier comprehension and/or easier maintenance—with no sacrifice of functional performance—it should be done so.
REVIEW:
Circuits built on terminal strips can be difficult to lay out, but when built they are robust enough to be considered permanent, yet easy to modify.
It is bad practice to secure more than two wire ends and/or component leads under a single terminal screw or clip on a terminal strip. Try to arrange connecting wires so as to avoid this condition.
Whenever possible, build your circuits with clarity and ease of understanding in mind. Even though component and wiring layout is usually of little consequence in DC circuit function, it matters significantly for the sake of the person who has to modify or troubleshoot it later.
Direct Current (DC)
Modern life could not exist if it were not for electricity and electronics. The history of electricity starts more than two thousand years ago, with the Greek philosopher Thales being the earliest known researcher into electricity. But it was Alessandro Volta who created the most common DC power source, the battery (for this invention the unit Volt was named after him).
Direct current (also known as DC) is the flow of charged particles in one unchanging direction (most commonly found as electron flow through conductive materials). DC can be found in just about every home and electronic device, as it is more practical (compared to AC from power stations) for many consumer devices. Just a few of the places where you can find direct current are batteries, phones, computers, cars, TVs, calculators, and even lightning.
How can I improve my intuition skills in electronics circuits analysis?
Build mental models. Visualize while you study simple and more complex circuits as you try to figure out how they work.
Learn how to properly draw schematic diagrams. The entire point of schematics is to make it simpler to understand how a circuit works and what it is doing. Pictorial diagrams do not do this. I am beginning to really hate Fritzing because everyone is drawing pictorials and not bothering to learn how to draw schematics. Most of the new crop of maker and Arduino books and websites draw terrible schematics or half-schematic, half-pictorial.
Learn how to identify components. Practice with resistor color codes until you can sight read them. This helps a lot when looking at a circuit on a PCB without a schematic.
I used to scavenge parts from old electronics. I'd keep all the loose resistors in a box. When I needed one, I'd figure out what the color code was and visualize it while looking for it. 6.8k 5% is blue-grey-red-gold.
Then I'd try to remember both that it is a 6.8k resistor, and picture the color bands. Note: NOT the names, I'd picture the actual color bands.
Then I'd try to remember both that it is a 6.8k resistor, and picture the color bands. Note: NOT the names, I'd picture the actual color bands.
Now I can glance at standard values and sight read them. 1k, 2.2k, 3.3k, 3.6k, 4.3k, 4.7k, 5.1k, 5.6k, 6.8k, 7.2k, 7.5k, 8.2k, 9.1k and the decades above and below follow. Since I didn't start out reading 2% and better resistors, it takes me a little bit longer with them.
Mnemonics are only useful to remember so you can visualize it. "ELI the ICE man" is fine for remembering that voltage leads current in inductors and current leads voltage in capacitors, but even better is when you visualize a magnetic field as it forms around an inductor that pushes back against the current attempting to flow. And the electric field in a capacitor that only pushes back as the voltage builds up and repels the charges creating the voltage.
The general two-graph framework of a fully symbolic and semi-symbolic analysis environment for linear, time-invariant circuits is presented. A classical two graph approach for RLC-gm circuits as well as its extension for circuits containing non admittance elements is discussed. A brief introduction to approximate symbolic analysis, using the two-graph method, is included. In this chapter we also present a method of synthesis of active RC circuits on the basis of the two-graph method. The null or approach is used to synthesize the RC network which has the voltage and the current graphs equivalent to the two-graph of the prototype LC network.
XXX . XXX 4 zero null 0 1 2 Musical Keyboard as a Signal Generator
PARTS AND MATERIALS
Electronic “keyboard” (musical)
“Mono” (not stereo) headphone-type plug
Impedance matching transformer (1k Ω to 8 Ω ratio; Radio Shack catalog # 273-1380)
10 kΩ resistor
In this experiment, you’ll learn how to use an electronic musical keyboard as a source of variable-frequency AC voltage signals. You need not purchase an expensive keyboard for this—but one with at least a few dozen “voice” selections (piano, flute, harp, etc.) would be good. The “mono” plug will be plugged into the headphone jack of the musical keyboard, so get a plug that’s the correct size for the keyboard.
The “impedance matching transformer” is a small-size transformer easily obtained from an electronics supply store. One may be scavenged from a small, junk radio: it connects between the speaker and the circuit board (amplifier), so is easily identifiable by location. The primary winding is rated in ohms of impedance (1000 Ω), and is usually center-tapped. The secondary winding is 8 Ω and not center-tapped. These impedance figures are not the same as DC resistance, so don’t expect to read 1000 Ω and 8 Ω with your ohmmeter—however, the 1000 Ω winding will read more resistance than the 8 Ω winding, because it has more turns.
If such a transformer cannot be obtained for the experiment, a regular 120V/6V step-down power transformer works fairly well, too.
CROSS-REFERENCES
Lessons In Electric Circuits, Volume 2, chapter 1: “Basic AC Theory”
Normally, a student of electronics in a school would have access to a device called a signal generator, or function generator used to make variable-frequency voltage waveforms to power AC circuits. An inexpensive electronic keyboard is a cheaper alternative to a regular signal generator and provides features that most signal generators cannot match, such as producing mixed-frequency waves.
To “tap in” to the AC voltage produced by the keyboard, you’ll need to insert a plug into the headphone jack (sometimes just labeled “phone” on the keyboard) complete with two wires for connection to circuits of your own design. When you insert the plug into the jack, the normal speaker built into the keyboard will be disconnected (assuming the keyboard is equipped with one), and the signal that used to power that speaker will be available at the plug wires. In this particular experiment, I recommend using the keyboard to power the 8 Ω side of an audio “output” transformer to step up voltage to a higher level. If using a power transformer instead of an audio output transformer, connect the keyboard to the low-voltage winding so that it operates as a step-up device. Keyboards produce very low voltage signals, so there is no shock hazard in this experiment.
Using an inexpensive Yamaha keyboard, I have found that the “panflute” voice setting produces the truest sine-wave waveform. This waveform, or something close to it (flute, for example), is recommended to start experimenting with since it is relatively free of harmonics (many waveforms mixed together, of integer-multiple frequency). Being composed of just one frequency, it is a less complex waveform for your multimeter to measure. Make sure the keyboard is set to a mode where the note will be sustained as any key is held down—otherwise, the amplitude (voltage) of the waveform will be constantly changing (high when the key is first pressed, then decaying rapidly to zero).
Using an AC voltmeter, read the voltage direct from the headphone plug. Then, read the voltage as stepped up by the transformer, noting the step ratio. If your multimeter has a “frequency” function, use it to measure the frequency of the waveform produced by the keyboard. Try different notes on the keyboard and record their frequencies. Do you notice a pattern in frequency as you activate different notes, especially keys that are similar to each other (notice the 12-key black-and-white pattern repeated on the keyboard from left to right)? If you don’t mind making marks on your keyboard, write the frequencies in Hertz in black ink on the white keys, near the tops where fingers are less likely to rub the numbers off.
Ideally, there should be no change in signal amplitude (voltage) as different frequencies (notes on the keyboard) are tried. If you adjust the volume up and down, you should discover that changes in amplitude should have little or no impact on frequency measurement. Amplitude and frequency are two completely independent aspects of an AC signal.
Try connecting the keyboard output to a 10 kΩ load resistance (through the headphone plug), and measure AC current with your multimeter. If your multimeter has a frequency function, you can measure the frequency of this current as well. It should be the same as for the voltage for any given note (keyboard key).
PC Oscilloscope
PARTS AND MATERIALS
IBM-compatible personal computer with sound card, running Windows 3.1 or better
Winscope software, downloaded free from internet
Electronic “keyboard” (musical)
“Mono” (not stereo) headphone-type plug for keyboard
It plots waveforms on the computer screen in response to AC voltage signals interpreted by the sound card microphone input. A similar program, called Oscope, is made for the Linux operating system. If you don’t have access to either software, you may use the “sound recorder” utility that comes stock with most versions of Microsoft Windows to display crude waveshapes.
LEARNING OBJECTIVES
Computer use
Basic oscilloscope function
SCHEMATIC DIAGRAM
ILLUSTRATION
INSTRUCTIONS
The oscilloscope is an indispensable test instrument for the electronics student and professional. No serious electronics lab should be without one (or two!). Unfortunately, commercial oscilloscopes tend to be expensive, and it is almost impossible to design and build your own without another oscilloscope to troubleshoot it! However, the sound card of a personal computer is capable of “digitizing” low-voltage AC signals from a range of a few hundred Hertz to several thousand Hertz with respectable resolution, and free software is available for displaying these signals in oscilloscope form on the computer screen. Since most people either have a personal computer or can obtain one for less cost than an oscilloscope, this becomes a viable alternative for the experimenter on a budget.
One word of caution: you can cause significant hardware damage to your computer if signals of excessive voltage are connected to the sound card’s microphone input! The AC voltages produced by a musical keyboard are too low to cause damage to your computer through the sound card, but other voltage sources might be hazardous to your computer’s health. Use this “oscilloscope” at your own risk!
Using the keyboard and plug arrangement described in the previous experiment, connect the keyboard output to the outer terminals of a 10 kΩ potentiometer. Solder two wires to the connection points on the sound card microphone input plug, so that you have a set of “test leads” for the “oscilloscope.” Connect these test leads to the potentiometer: between the middle terminal (the wiper) and either of the outer terminals.
Start the Winscope program and click on the “arrow” icon in the upper-left corner (it looks like the “play” arrow seen on tape player and CD player control buttons). If you press a key on the musical keyboard, you should see some kind of waveform displayed on the screen. Choose the “panflute” or some other flute-like voice on the musical keyboard for the best sine-wave shape. If the computer displays a waveform that looks kind of like a square wave, you need to adjust the potentiometer for a lower-amplitude signal. Almost any waveshape will be “clipped” to look like a square wave if it exceeds the amplitude limit of the sound card.
Test different instrument “voices” on the musical keyboard and note the different waveshapes. Note how complex some of the waveshapes are, compared to the panflute voice. Experiment with the different controls in the Winscope window, noting how they change the appearance of the waveform.
As a test instrument, this “oscilloscope” is quite poor. It has almost no capability to make precision measurements of voltage, although its frequency precision is surprisingly good. It is very limited in the range of voltage and frequency it can display, relegating it to the analysis of low- and mid-range audio tones. I have had very little success getting the “oscilloscope” to display good square waves, presumably because of its limited frequency response. Also, the coupling capacitor found in sound card microphone input circuits prevents it from measuring DC voltage: it is as though the “AC coupling” feature of a normal oscilloscope were stuck “on.”
Despite these shortcomings, it is useful as a demonstration tool, and for initial explorations into waveform analysis for the beginning student of electronics. For those who are interested, there are several professional-quality oscilloscope adapter devices manufactured for personal computers whose performance is far beyond that of a sound card, and they are typically sold at less cost than a complete stand-alone oscilloscope (around $400, the year 2002). Radio Shack sells one made by Velleman, catalog # 910-3914. Having a computer serve as the display medium brings many advantages, not the least of which is the ability to easily store waveform pictures as digital files.
Waveform Analysis
PARTS AND MATERIALS
IBM-compatible personal computer with sound card, running Windows 3.1 or better
Winscope software, downloaded free from internet
Electronic “keyboard” (musical)
“Mono” (not stereo) headphone-type plug for keyboard
“Mono” (not stereo) headphone-type plug for computer sound card microphone input, with wires for connecting to voltage sources
10 kΩ potentiometer
Parts and equipment for this experiment are identical to those required for the “PC oscilloscope” experiment.
LEARNING OBJECTIVES
Understand the difference between time-domain and frequency-domain plots
Develop a qualitative sense of Fourier analysis
SCHEMATIC DIAGRAM
ILLUSTRATION
INSTRUCTIONS
The Winscope program comes with another feature other than the typical “time-domain” oscilloscope display: “frequency-domain” display, which plots amplitude (vertical) over frequency (horizontal). An oscilloscope’s “time-domain” display plots amplitude (vertical) over time (horizontal), which is fine for displaying waveshape. However, when it is desirable to see the harmonic constituency of a complex wave, a frequency-domain plot is the best tool.
If using Winscope, click on the “rainbow” icon to switch to frequency-domain mode. Generate a sine-wave signal using the musical keyboard (panflute or flute voice), and you should see a single “spike” on the display, corresponding to the amplitude of the single-frequency signal. Moving the mouse cursor beneath the peak should result in the frequency being displayed numerically at the bottom of the screen.
If two notes are activated on the musical keyboard, the plot should show two distinct peaks, each one corresponding to a particular note (frequency). Basic chords (three notes) produce three spikes on the frequency-domain plot, and so on. Contrast this with a normal oscilloscope (time-domain) plot by clicking once again on the “rainbow” icon. A musical chord displayed in time-domain format is a very complex waveform but is quite simple to resolve into constituent notes (frequencies) on a frequency-domain display.
Experiment with different instrument “voices” on the musical keyboard, correlating the time-domain plot with the frequency-domain plot. Waveforms that are symmetrical above and below their centerlines contain only odd-numbered harmonics (odd-integer multiples of the base, or fundamental frequency), while nonsymmetrical waveforms contain even-numbered harmonics as well. Use the cursor to locate the specific frequency of each peak on the plot, and a calculator to determine whether each peak is even- or odd-numbered.
Inductor-Capacitor “tank” Circuit
PARTS AND MATERIALS
Oscilloscope
Assortment of non-polarized capacitors (0.1 µF to 10 µF)
Step-down power transformer (120V / 6 V)
10 kΩ resistors
Six-volt battery
The power transformer is used simply as an inductor, with only one winding connected. The unused winding should be left open. A simple iron core, single-winding inductor (sometimes known as a choke) may also be used, but such inductors are more difficult to obtain than power transformers.
LEARNING OBJECTIVES
How to build a resonant circuit
Effects of capacitor size on resonant frequency
How to produce antiresonance
SCHEMATIC DIAGRAM
ILLUSTRATION
INSTRUCTIONS
If an inductor and a capacitor are connected in parallel with each other, and then briefly energized by connection to a DC voltage source, oscillations will ensue as energy is exchanged from the capacitor to inductor and vice versa. These oscillations may be viewed with an oscilloscope connected in parallel with the inductor/capacitor circuit. Parallel inductor/capacitor circuits are commonly known as tank circuits.
Important note: I recommend against using a PC/sound card as an oscilloscope for this experiment because very high voltages can be generated by the inductor when the battery is disconnected (inductive “kickback”). These high voltages will surely damage the sound card’s input, and perhaps other portions of the computer as well.
A tank circuit’s natural frequency, called the resonant frequency, is determined by the size of the inductor and the size of the capacitor, according to the following equation:
Many small power transformers have primary (120 volts) winding inductances of approximately 1 H. Use this figure as a rough estimate of inductance for your circuit to calculate expected oscillation frequency.
Ideally, the oscillations produced by a tank circuit continue indefinitely. Realistically, oscillations will decay in amplitude over the course of several cycles due to the resistive and magnetic losses of the inductor. Inductors with a high “Q” rating will, of course, produce longer-lasting oscillations than low-Q inductors.
Try changing capacitor values and noting the effect on oscillation frequency. You might notice changes in the duration of oscillations as well, due to capacitor size. Since you know how to calculate resonant frequency from inductance and capacitance, can you figure out a way to calculate inductor inductance from known values of circuit capacitance (as measured by a capacitance meter) and resonant frequency (as measured by an oscilloscope)?
Resistance may be intentionally added to the circuit—either in series or parallel—for the express purpose of dampening oscillations. This effect of resistance dampening tank circuit oscillation is known as antiresonance. It is analogous to the action of a shock absorber in dampening the bouncing of a car after striking a bump in the road.
COMPUTER SIMULATION
Schematic with SPICE node numbers:
Rstray is placed in the circuit to dampen oscillations and produce a more realistic simulation. A lower Rstrayvalue causes longer-lived oscillations because less energy is dissipated. Eliminating this resistor from the circuit results in endless oscillation.
Signal Coupling
PARTS AND MATERIALS
6 volt battery
One capacitor, 0.22 µF (Radio Shack catalog # 272-1070 or equivalent)
One capacitor, 0.047 µF (Radio Shack catalog # 272-134 or equivalent)
Small “hobby” motor, permanent-magnet type (Radio Shack catalog # 273-223 or equivalent)
Audio detector with headphones
Length of telephone cable, several feet long (Radio Shack catalog # 278-872)
Telephone cable is also available from hardware stores. Any unshielded multiconductor cable will suffice for this experiment. Cables with thin conductors (telephone cable is typically 24-gauge) produce a more pronounced effect.
LEARNING OBJECTIVES
How to “couple” AC signals and block DC signals to a measuring instrument
How stray coupling happens in cables
Techniques to minimize inter-cable coupling
SCHEMATIC DIAGRAM
ILLUSTRATION
INSTRUCTIONS
Connect the motor to the battery using two of the telephone cable’s four conductors. The motor should run, as expected. Now, connect the audio signal detector across the motor terminals, with the 0.047 µF capacitor in series, like this:
You should be able to hear a “buzz” or “whine” in the headphones, representing the AC “noise” voltage produced by the motor as the brushes make and break contact with the rotating commutator bars. The purpose of the series capacitor is to act as a high-pass filter so that the detector only receives the AC voltage across the motor’s terminals, not any DC voltage. This is precisely how oscilloscopes provide an “AC coupling” feature for measuring the AC content of a signal without any DC bias voltage: a capacitor is connected in series with one test probe.
Ideally, one would expect nothing but pure DC voltage at the motor’s terminals, because the motor is connected directly in parallel with the battery. Since the motor’s terminals are electrically common with the respective terminals of the battery, and the battery’s nature is to maintain a constant DC voltage, nothing but DC voltage should appear at the motor terminals, right? Well, because of resistance internal to the battery and along the conductor lengths, current pulses drawn by the motor produce oscillating voltage “dips” at the motor terminals, causing the AC “noise” heard by the detector:
Use the audio detector to measure “noise” voltage directly across the battery. Since the AC noise is produced in this circuit by pulsating voltage drops along stray resistances, the less resistance we measure across, the less noise voltage we should detect:
You may also measure noise voltage dropped along either of the telephone cable conductors supplying power to the motor, by connecting the audio detector between both ends of a single cable conductor. The noise detected here originates from current pulses through the resistance of the wire:
Now that we have established how AC noise is created and distributed in this circuit, let’s explore how it is coupled to adjacent wires in the cable. Use the audio detector to measure voltage between one of the motor terminals and one of the unused wires in the telephone cable. The 0.047 µF capacitor is not needed in this exercise, because there is no DC voltage between these points for the detector to detect anyway:
The noise voltage detected here is due to stray capacitance between adjacent cable conductors creating an AC current “path” between the wires. Remember that no current actually goes through a capacitance, but the alternate charging and discharging action of a capacitance, whether it be intentional or unintentional, provides alternating current a pathway of sorts.
If we were to try and conduct a voltage signal between one of the unused wires and a point common with the motor, that signal would become tainted with noise voltage from the motor. This could be quite detrimental, depending on how much noise was coupled between the two circuits and how sensitive one circuit was to the other’s noise. Since the primary coupling phenomenon in this circuit is capacitive in nature, higher-frequency noise voltages are more strongly coupled than lower-frequency noise voltages.
If the additional signal was a DC signal, with no AC expected in it, we could mitigate the problem of coupled noise by “decoupling” the AC noise with a relatively large capacitor connected across the DC signal’s conductors. Use the 0.22 µF capacitor for this purpose, as shown:
The decoupling capacitor acts as a practical short-circuit to any AC noise voltage, while not affecting DC voltage signals between those two points at all. So long as the decoupling capacitor value is significantly larger than the stray “coupling” capacitance between the cable’s conductors, the AC noise voltage will be held to a minimum.
Another way of minimizing coupled noise in a cable is to avoid having two circuits share a common conductor. To illustrate, connect the audio detector between the two unused wires and listen for a noise signal:
There should be far less noise detected between any two of the unused conductors than between one unused conductor and one used in the motor circuit. The reason for this drastic reduction in noise is that stray capacitance between cable conductors tends to couple the same noise voltage to both of the unused conductors in approximately equal proportions. Thus, when measuring voltage between those two conductors, the detector only “sees” the difference between two approximately identical noise signals.
Experiments
Learning electronic theory is all well and good, but like most real tasks, electronics is 20% theory and 80% practice. Just because a circuit works in a simulation does not mean it will work in real life. Take a look at some high-tech printed circuit boards (such as a motherboard) and you will quickly find strange layout techniques. A classic example is matching the trace lengths for signals in a bus; traces meander back and forth to ensure that bus signals reach their destination at the same time.
So put down your pencil and stop fine-tuning that SPICE circuit, because it’s time to get out the breadboard, soldering iron, and component bin! In this chapter we will look at many experiments and guided examples that range from setting up an electronics workshop to constructing 7-segment displays.
XXX . XXX 4 zero null 0 1 2 3 4 Keyboard
The interest in keyboards actually began when I started developing pain to my fingers. Too many shorcuts and too many combos with the modifiers. I eventually entered the very dangerous world of Mechanical Keyboards.
I tried every mechanical keyboard and every key switch I could (there are more than you may think). It’s a very complicated and interesting world dominated by factions and feuds. Who likes clicky switches, who likes light switches, who stiff switches, who capacitive Topre switches, who argues that Topres are not actually mechanical, who soft-tactile but only if carefully lubricated (by hand, one by one), and so on and so forth.
It’s a never ending quest, trying to find the Perfect combination of materials, switches, springs, controllers and it brings you to one inevitable conclusion: there’s no spoon. The perfect keyboard does not exist. Hence, build your own!
It’s easier than you think, but it takes a lot of dedication and time. Money speaking a custom keyboard goes around $150 + the keycaps.
Layout and keycaps
If you want your very own keyboard you are probably going to have an unusual layout. Mine is compact, with arrow cluster and few but important differences from a “standard” keyboard.
So the first problem to solve is where to find the keycaps in such unusual shapes. There are quite a few companies that can make keycaps, one of the most notorious is Signature Plastics, they also sell directly through their online retail store, but you may not find exactly what you need.
The solution is to participate in one of the many Group Buys that the Mechanical Keyboards community organizes. Accidentally there’s one that is running right now and that would very likely cover all your custom keyboard needs. It is called Granite Set and I personally designed it.
Switches
Next pick your switches. There are so many that I should dedicate a full post to them. Let’s limit the selection to Cherry MX. Cherry is the manufacturer, they produce the most famous switches for mechanical keyboards. They have many varieties, I like the clicky one called Cherry MX Blue, but you may prefer the light linear one (Red) or the tactile (Brown). They can be easily found on electronics stores such as Mouser or Fernell.
Plate and Case
Next you need a case and the plate where the switches will be housed. The easiest way is to laser cut various layers of acrylic or aluminum and screw them together to build up your keyboard case.
You need to design all the layers with a CAD software such as Autocad or DraftSight that is free and runs on Windows, Mac and Linux. Some laser cutter also takes SVG files from Illustrator or Inkscape for example.
Here to spare some bucks I did a mixed Acrylic+Aluminum case layout. From the picture you can see the bottom plate that is aluminum (and later insulated to prevent shorts) and the sides are brown acrylics. The top plate –where the switches are actually accommodated– is again aluminum, but stainless steel or even wood also work pretty well.
The PCB
The switches can be connected to the controller on a PCB or you can also hand-wire them directly. It’s a long task but it’s not too difficult and spares you the hassle of designing the PCB.
I tried both methods and admittedly the PCB is a cleaner solution, but one of my first custom keyboards was hand wired and it works like a charm.
Of course we don’t have a controller that can listen to 100 (one per switch) inputs, so we use a matrix. The switches are connected together in rows and columns instead of directly to the controller. This way we use just about 20 inputs to drive all the switches. To do so we need to add diodes to each switch; yeah, that means even more soldering. You can take any variant of the 1N4148 diode.
The controller
Next the controller. The Teensy is a very small USB HID compatible controller based on ATMega chip. It’s very common for custom keyboards because a nice guy cooked an incredibly good keyboard firware for it. It is called TMK Keyboard and you can find it on github. You can also probably use any of the Adafruit‘s or Sparkfun‘s controllers or even Arduino.
All rows and columns of the switches matrix have to be connected to the controller. Then you can burn the firmware, close the keyboard and enjoy your custom creation!
Happy typing
This is not a step by step tutorial but I hope it helped wetting your appetite. I personally have very little skills in electronics and my experience with CAD is limited to “draw-a-line”, but I was able to build my own keyboard from the ground up, so if I can do it nothing stops you from doing the same.
Lastly, there are few very good communities dedicated to Mechanical Keyboards where you can find inspiration

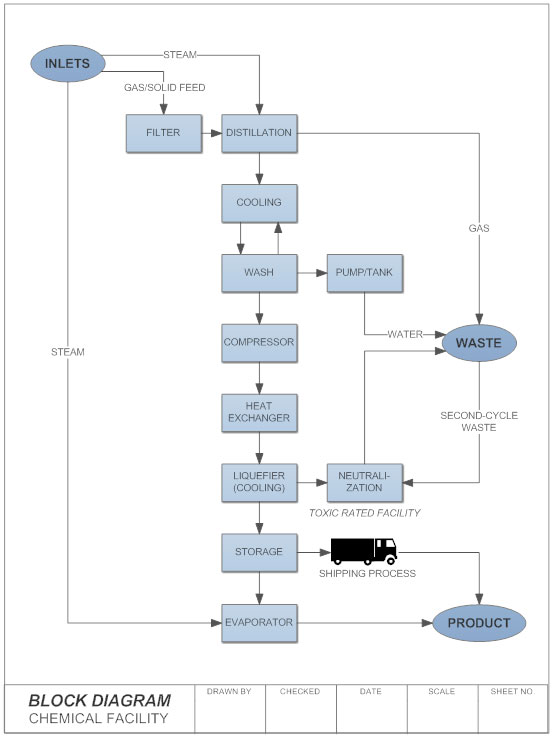
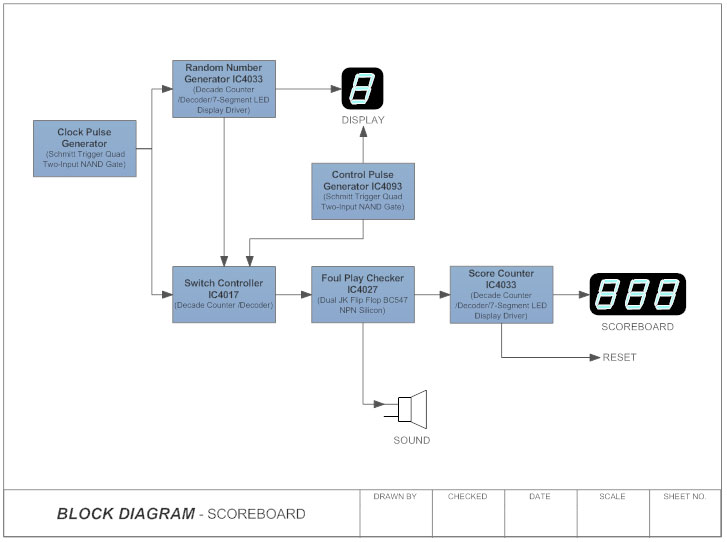


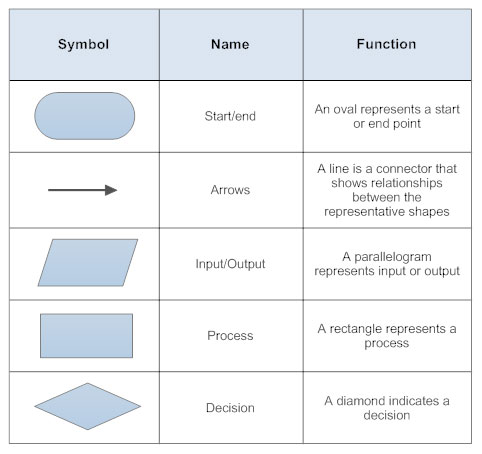


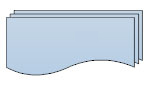


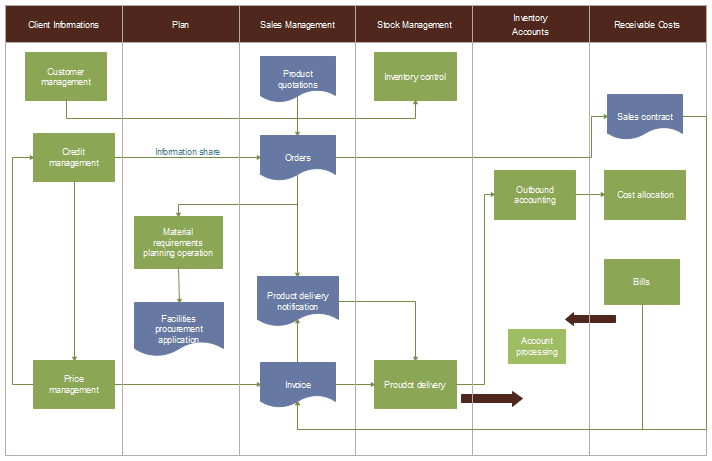
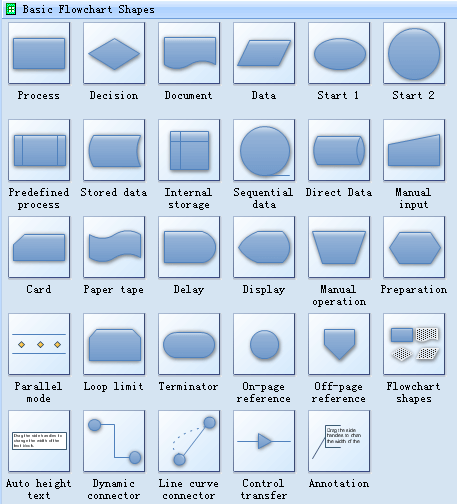

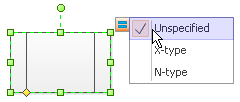


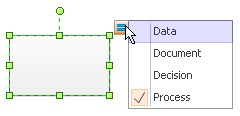

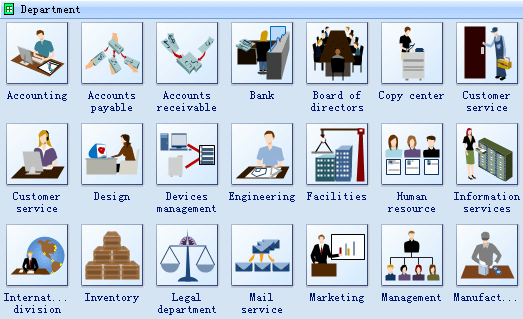
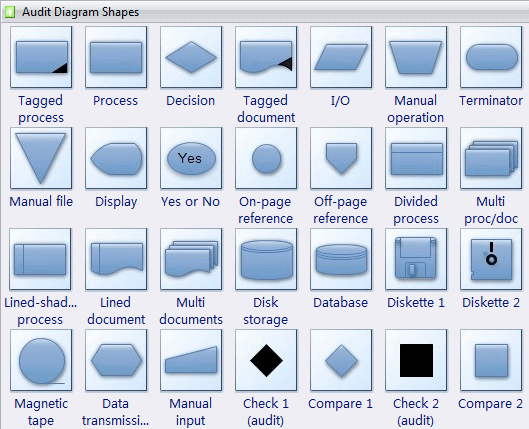
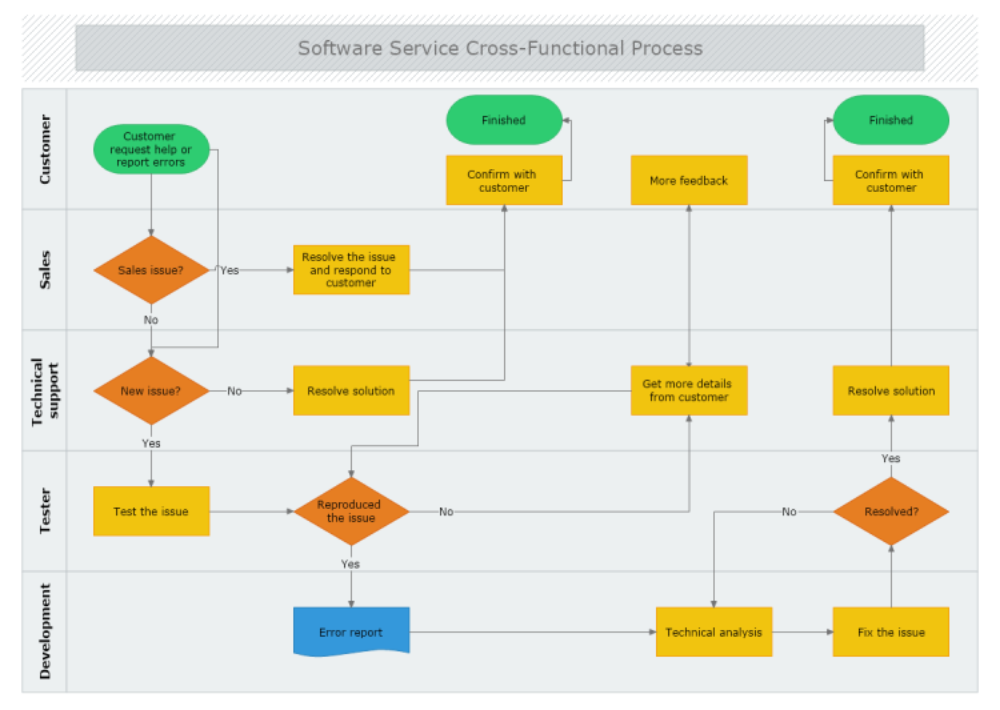
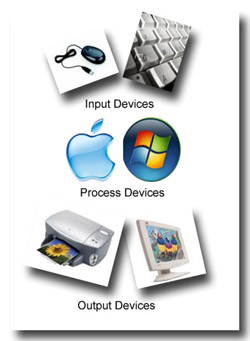
 When you look at all the extras and options that are available for new computer keyboards, it can be hard to believe that their original design came from mechanical typewriters that didn't even use electricity. Now, you can buy ergonomic keyboards that bear little resemblance to flat, rectangular models with ordinary square keys. Some flashier models light up, roll up or fold up, and others offer options for programming your own commands and shortcuts.
 A keyboard's primary function is to act as an input device. Using a keyboard, a person can type a document, use keystroke shortcuts, access menus, play games and perform a variety of other tasks. Keyboards can have different keys depending on the manufacturer, the operating system they're designed for, and whether they are attached to a desktop computer or part of a laptop. But for the most part, these keys, also called keycaps, are the same size and shape from keyboard to keyboard. They're also placed at a similar distance from one another in a similar pattern, no matter what language or alphabet the keys represent.

 A keyboard is a lot like a miniature computer. It has its own processor and circuitry that carries information to and from that processor. A large part of this circuitry makes up the key matrix.

 Keyboards use a variety of switch technologies. Capacitive switches are considered to be non-mechanical because they do not physically complete a circuit like most other keyboard technologies. Instead, current constantly flows through all parts of the key matrix. Each key is spring-loaded and has a tiny plate attached to the bottom of it. When you press a key, it moves this plate closer to the plate below it. As the two plates move closer together, the amount of current flowing through the matrix changes. The processor detects the change and interprets it as a key press for that location. Capacitive switch keyboards are expensive, but they have a longer life than any other keyboard. Also, they do not have problems with bounce since the two surfaces never come into actual contact.

 A lot of modifications to the traditional keyboard design are an attempt to make them safer or easier to use. For example, some people have associated increased keyboard use with repetitive stress injuries like carpal tunnel syndrome, although scientific studies have produced conflicting results. Ergonomic keyboard designs are intended to keep a person's hands in a more natural position while typing in an attempt to prevent injuries. While these keyboards can certainly keep people from holding their hands in a "praying mantis" position, studies disagree on whether they actually prevent injury.


 As you type, the processor in the keyboard analyzes the key matrix and determines what characters to send to the computer. It maintains these characters in its memory buffer and then sends the data.


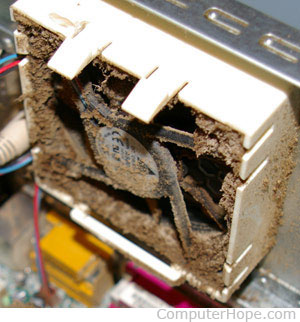 Cleaning your computer, components, and peripherals help keep everything in good working condition, helps prevent germs from spreading, and helps allow proper air flow. The picture shows a good example of just how dirty the inside of your computer case can get. Just looking at this picture it is immediately obvious that all the dust and dirt is going to prevent proper air flow and may even prevent the fan from working.

 The computer keyboard is usually the most germ infected items in your home or office. A keyboard may even contain more bacteria than your toilet seat. Cleaning it helps remove any dangerous bacteria and keeps the keyboard working properly.

 Once the cover has rotated about an inch, rotate the mouse into its normal position, covering the bottom of the mouse with one hand. The bottom should then fall off, including the mouse ball. If the cover does not fall off, try shaking the mouse gently.
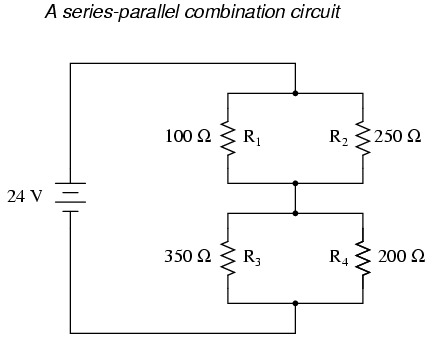

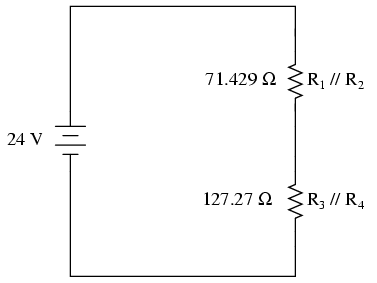
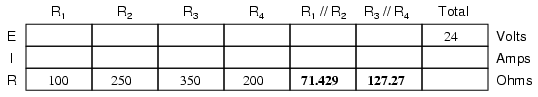
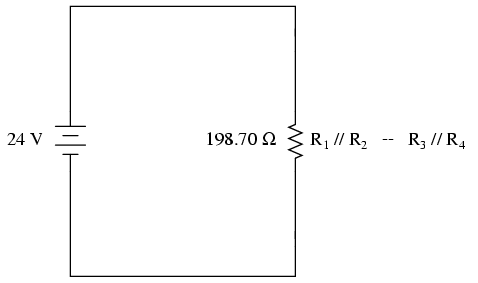
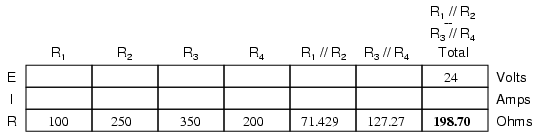
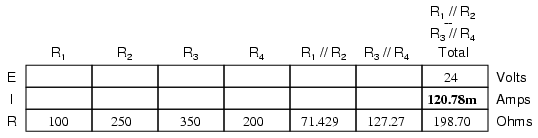
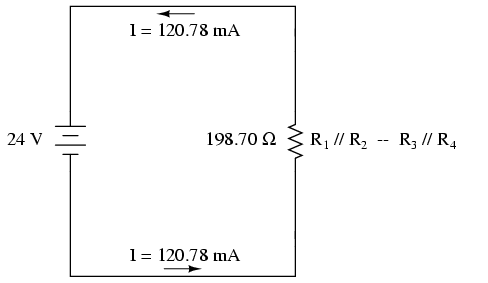
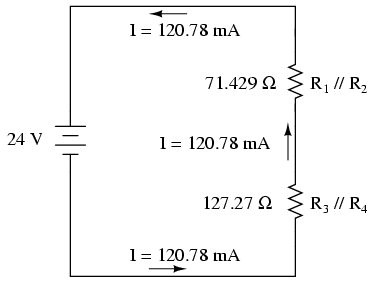
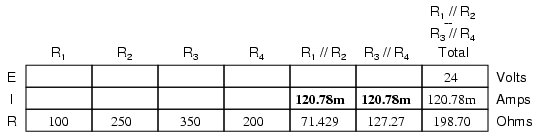
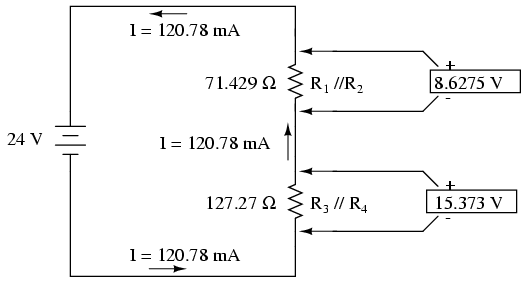
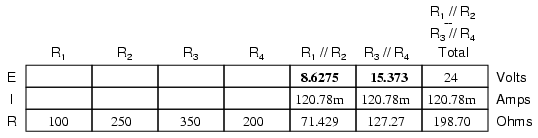
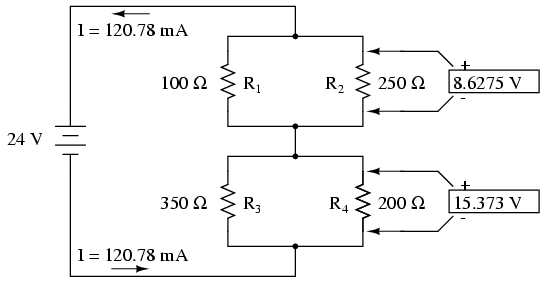
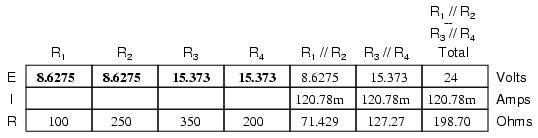
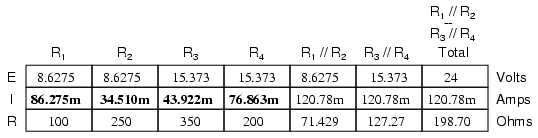
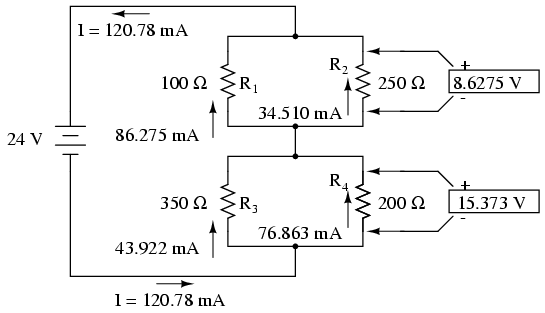
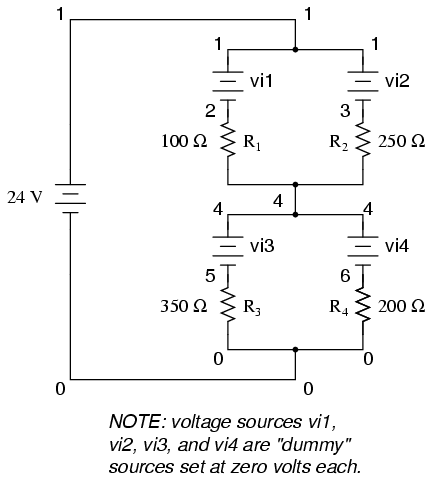
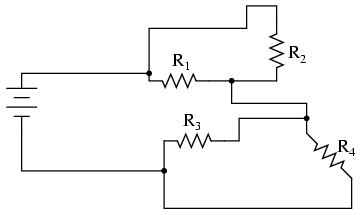
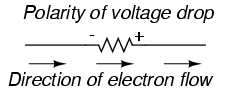
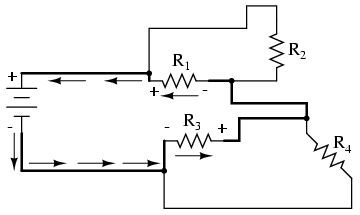
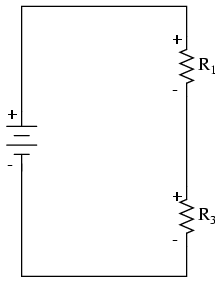
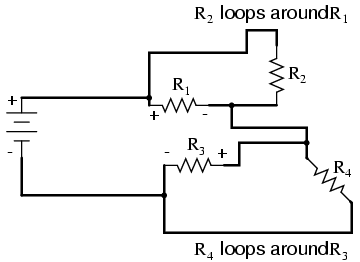
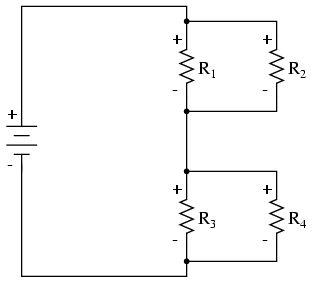


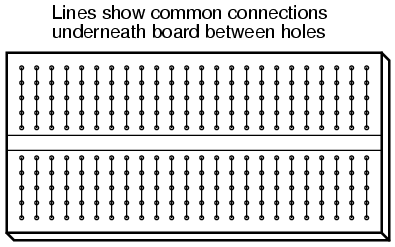


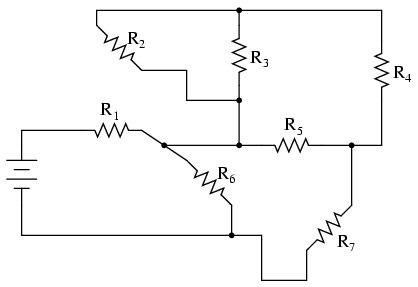

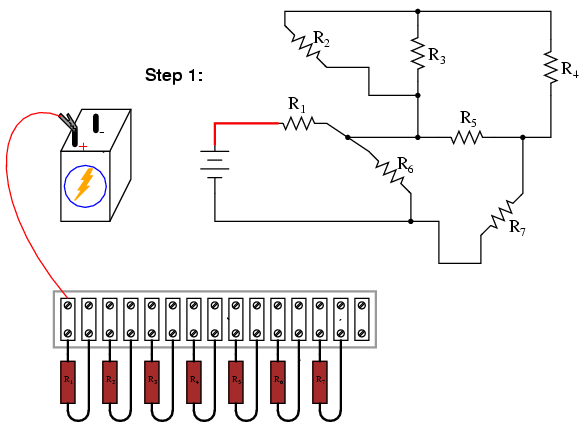
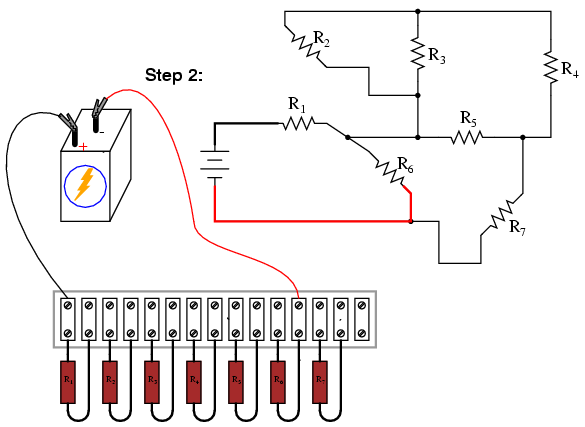

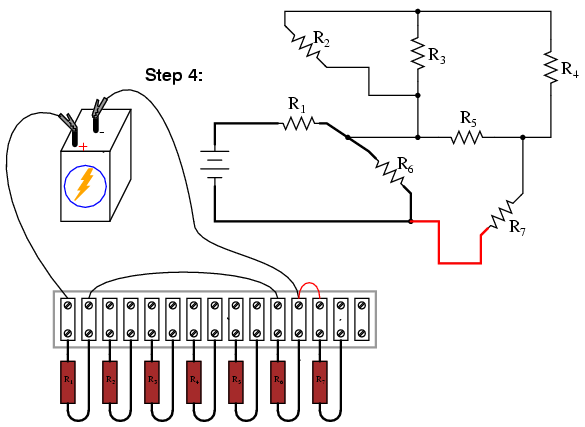

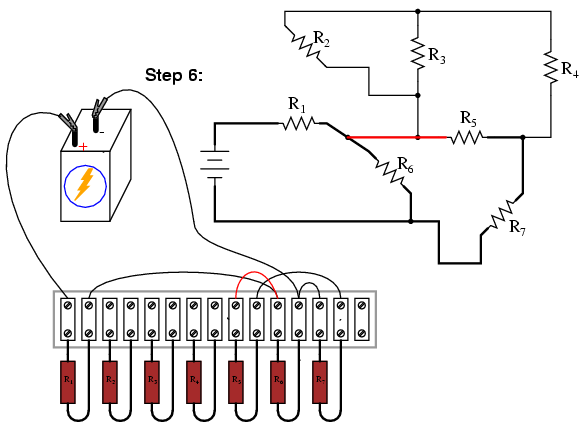


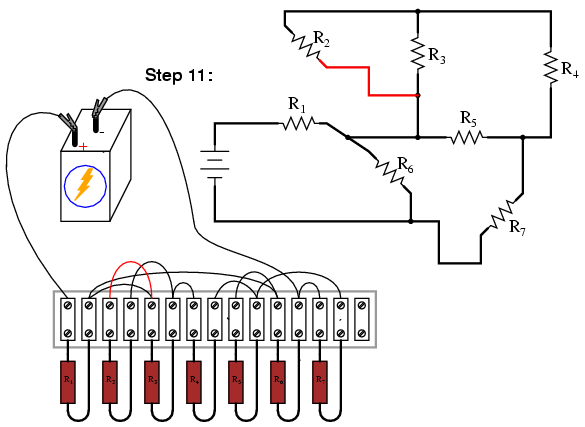
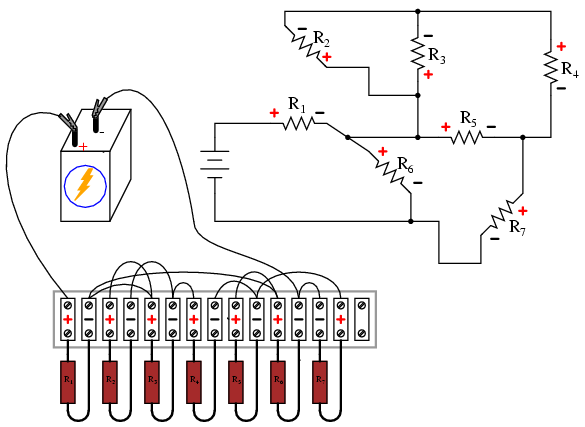


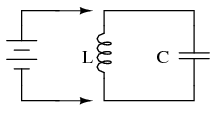
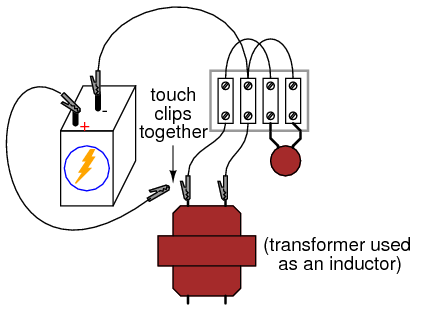
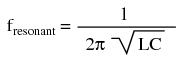
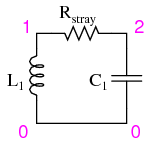


 If you want your very own keyboard you are probably going to have an unusual layout. Mine is compact, with arrow cluster and few but important differences from a “standard” keyboard.
 Next you need a case and the plate where the switches will be housed. The easiest way is to laser cut various layers of acrylic or aluminum and screw them together to build up your keyboard case.
 The switches can be connected to the controller on a PCB or you can also hand-wire them directly. It’s a long task but it’s not too difficult and spares you the hassle of designing the PCB.
 Next the controller. The Teensy is a very small USB HID compatible controller based on ATMega chip. It’s very common for custom keyboards because a nice guy cooked an incredibly good keyboard firware for it. It is called TMK Keyboard and you can find it on github. You can also probably use any of the Adafruit‘s or Sparkfun‘s controllers or even Arduino.


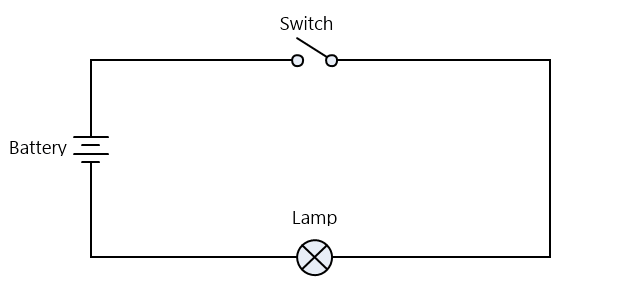 To be able to read and understand this diagram it is necessarily to be familiar with the symbols used in this example - bettery, lamp, and switch.


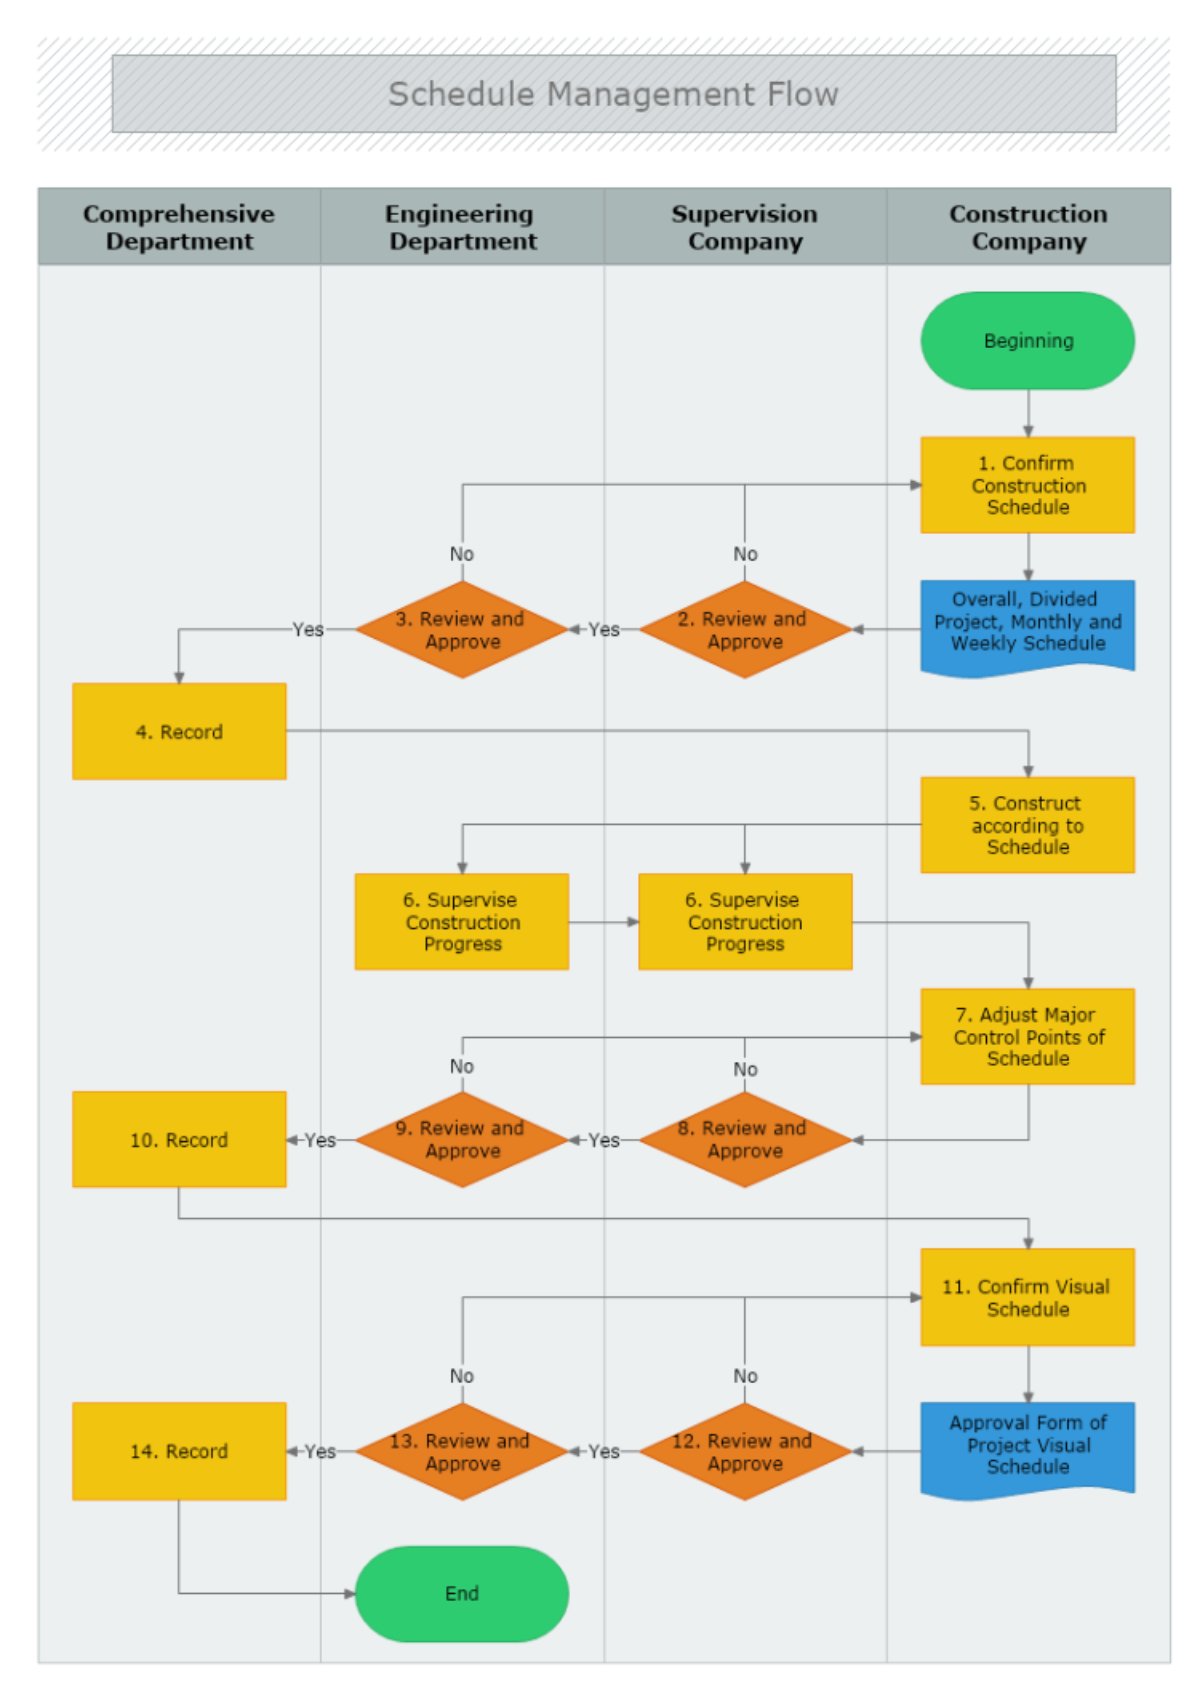
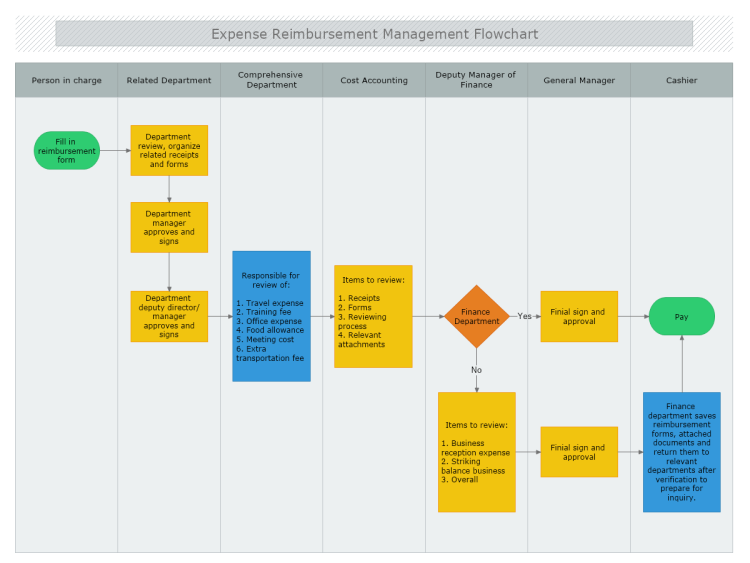

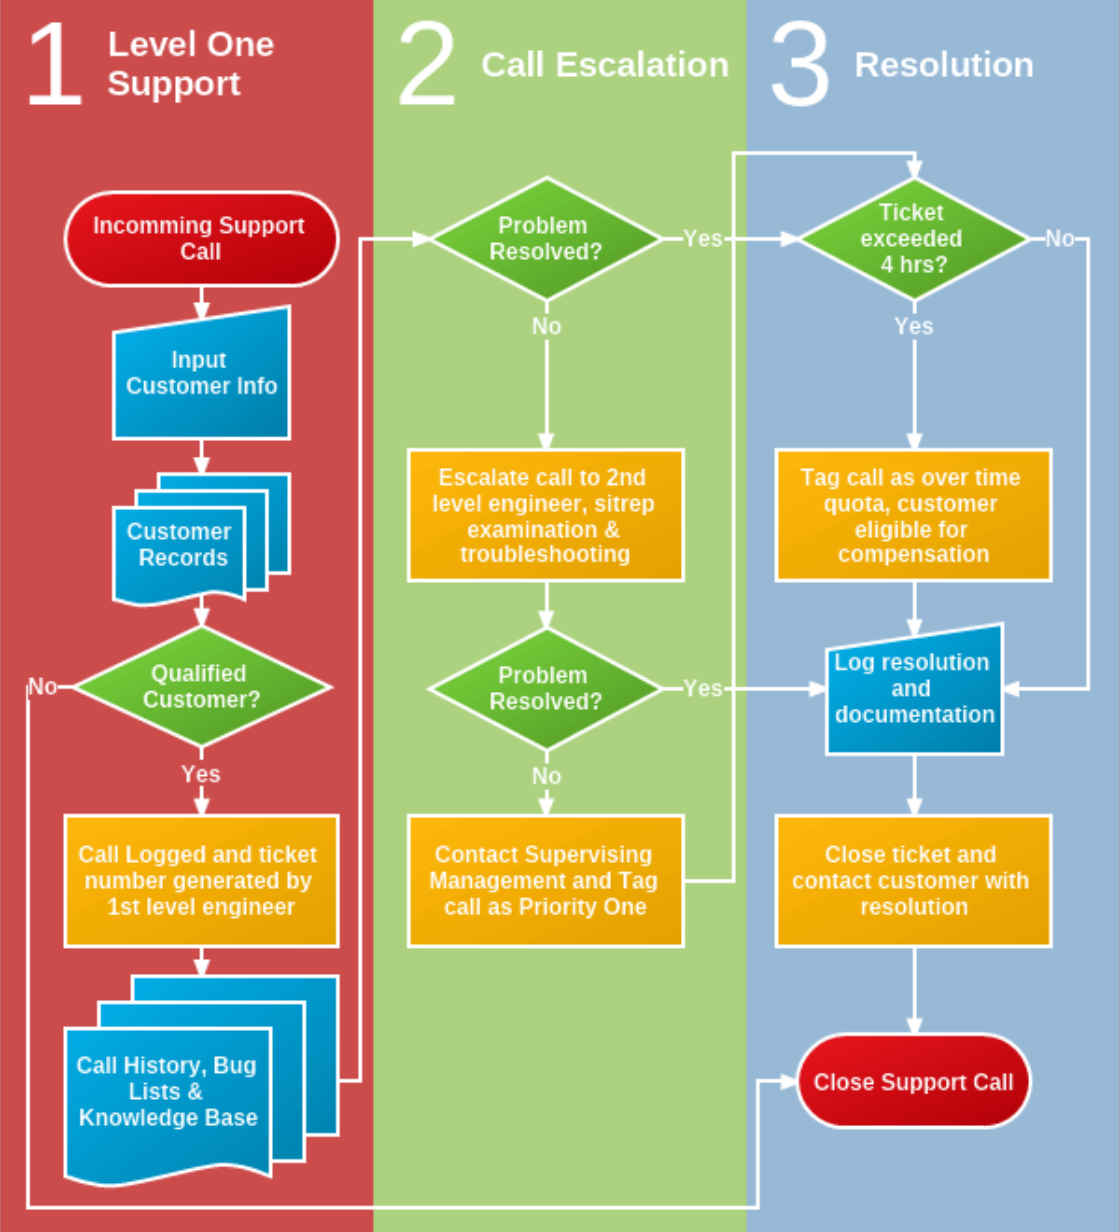
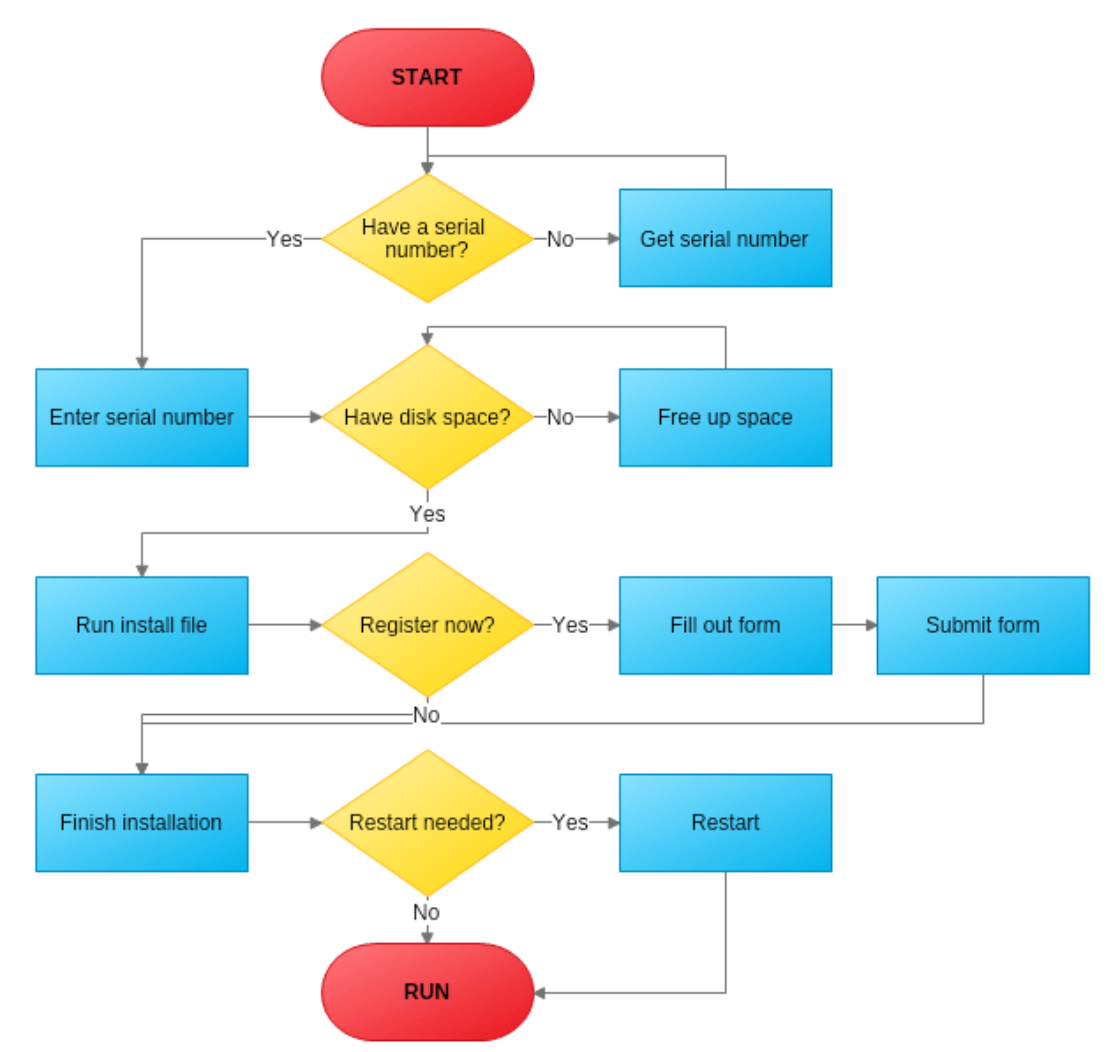
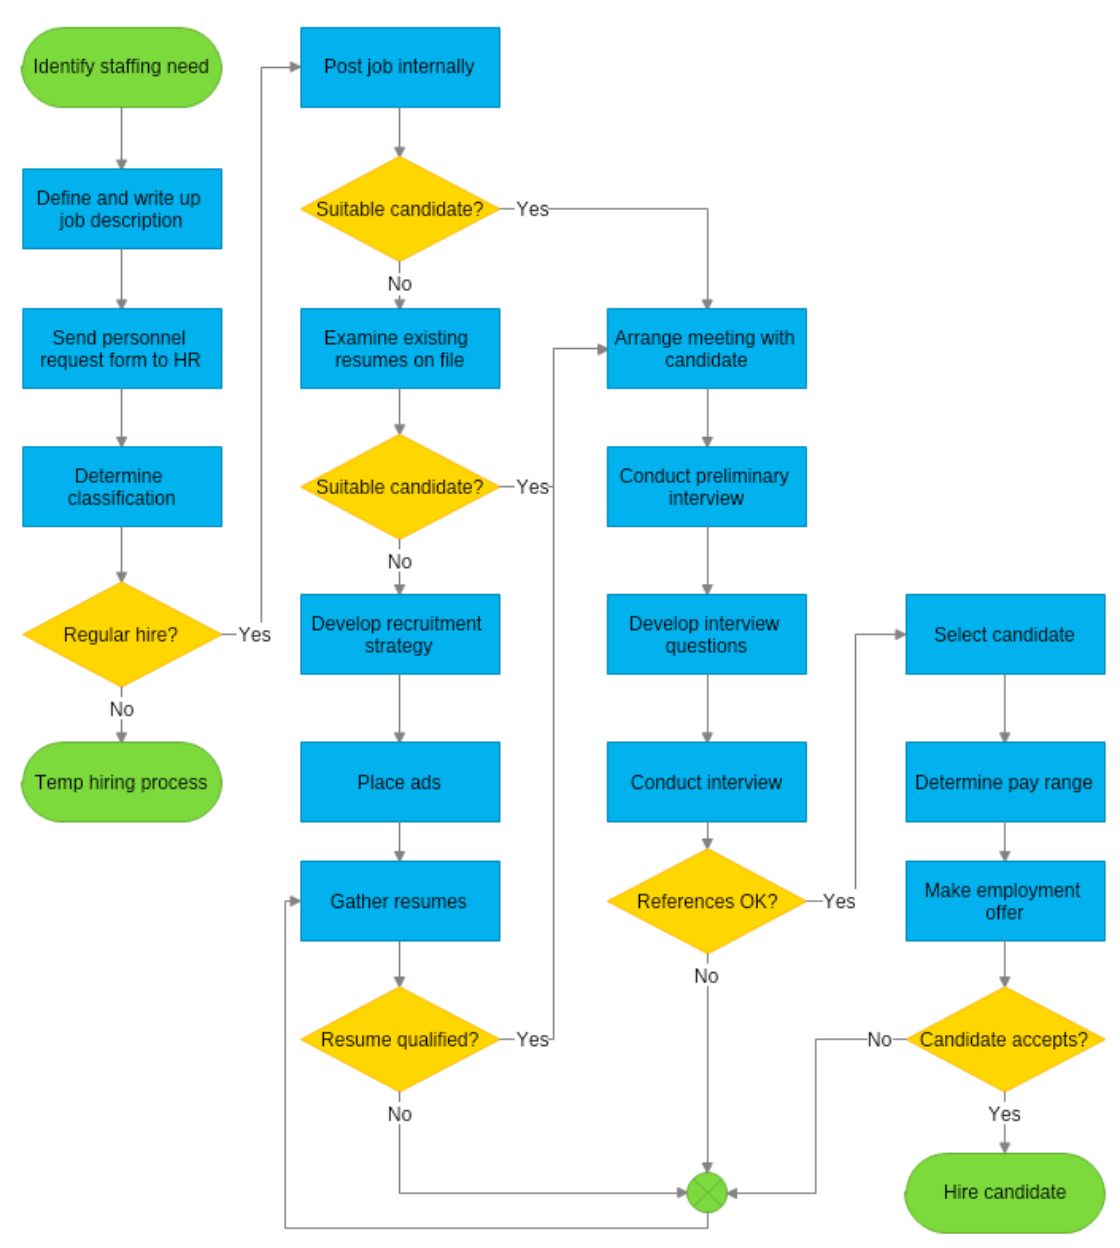
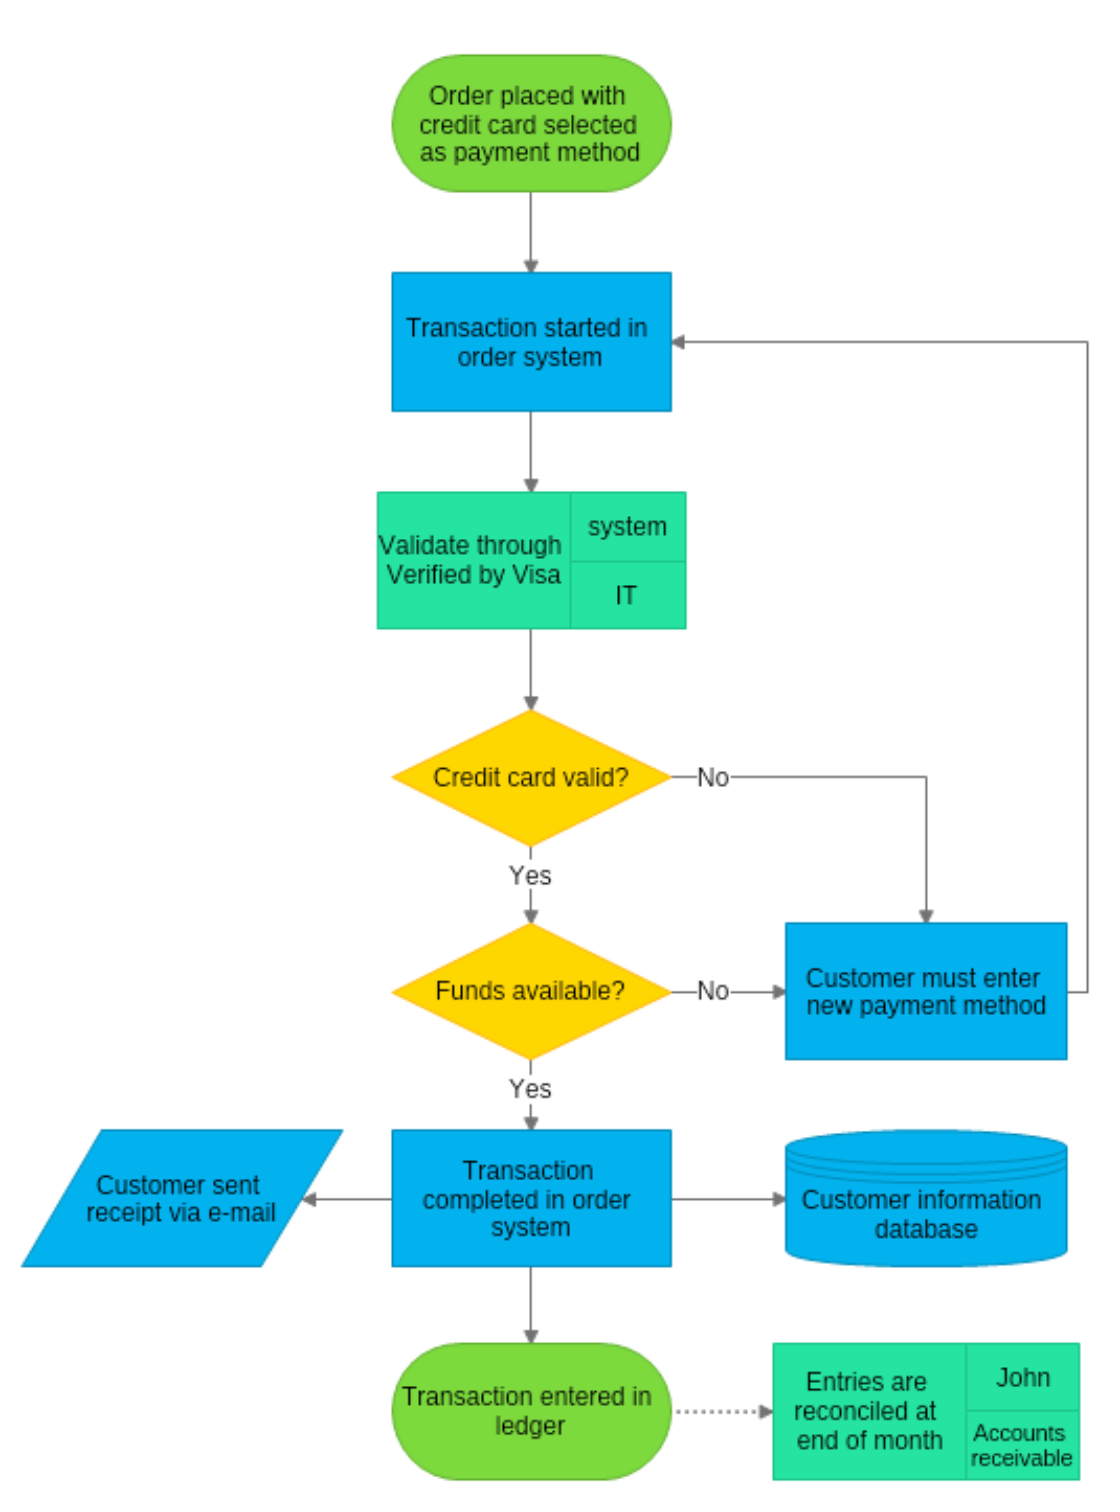
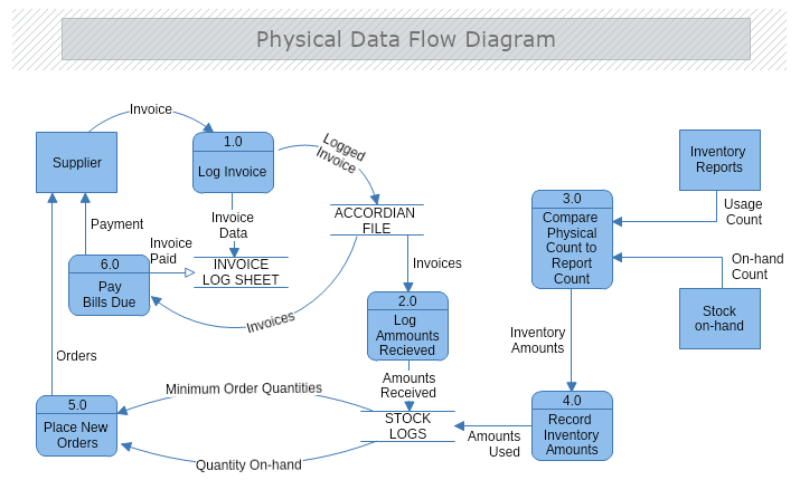
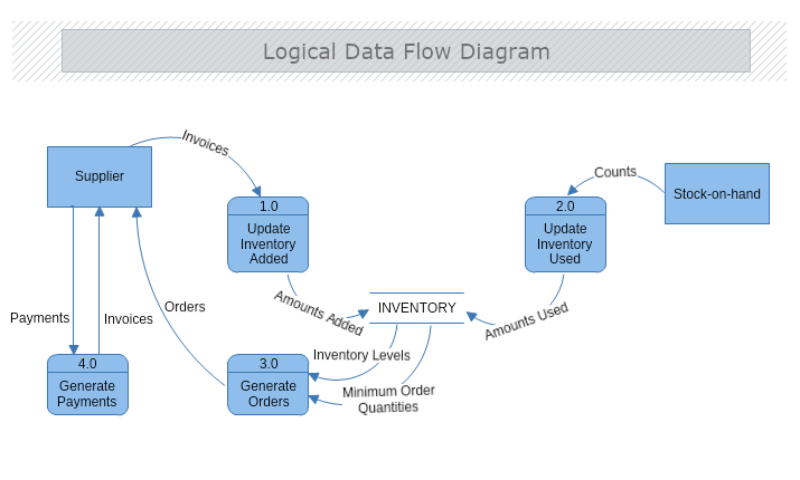


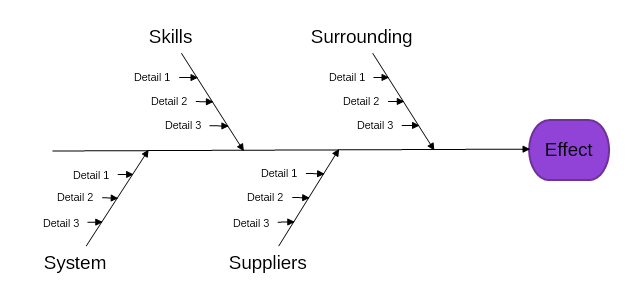
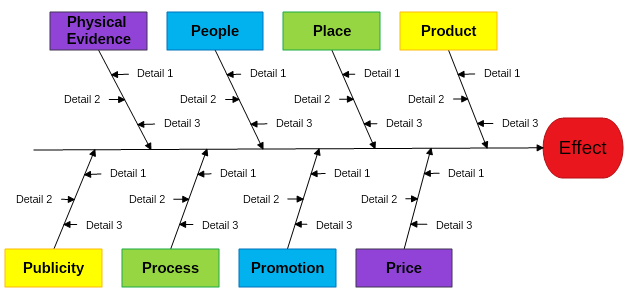
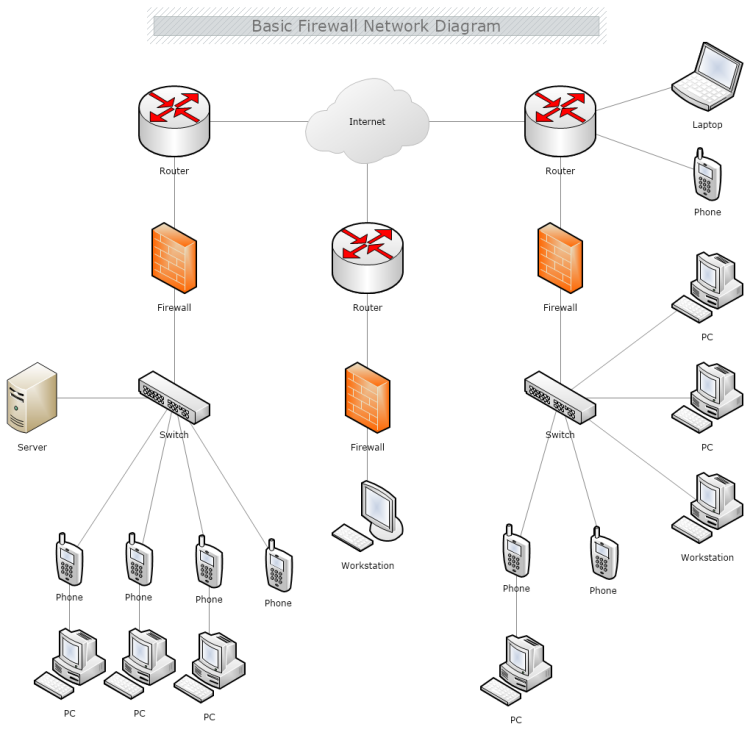


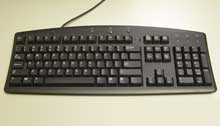
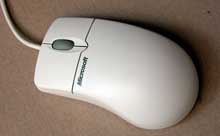
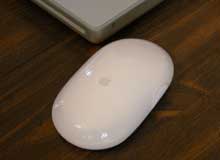
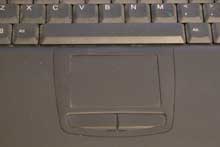
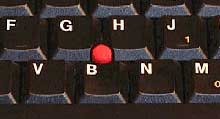
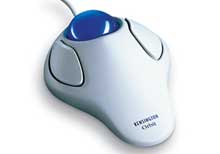
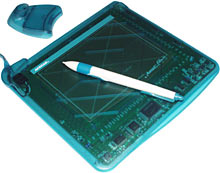
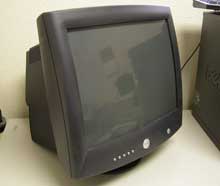
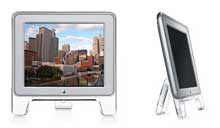

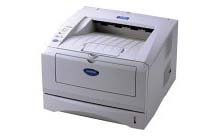

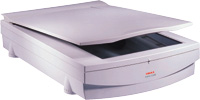

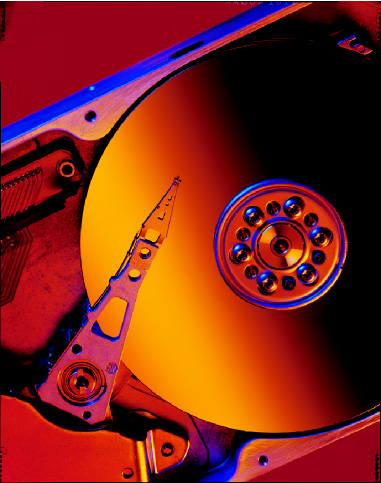
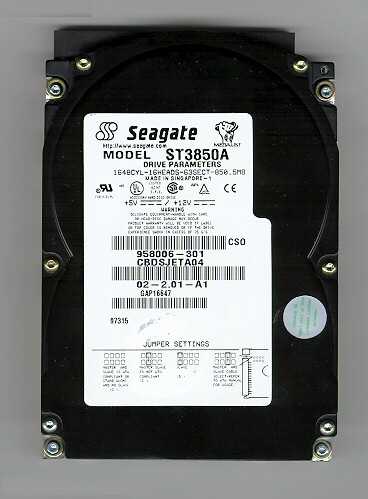
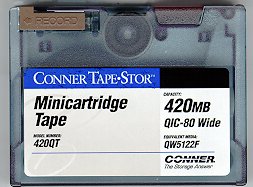
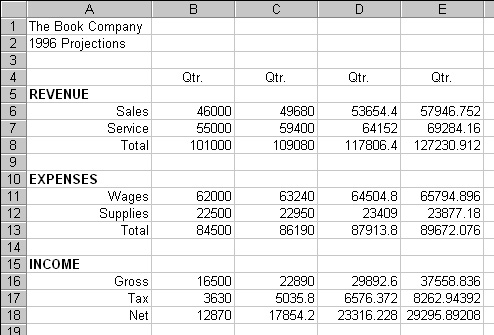
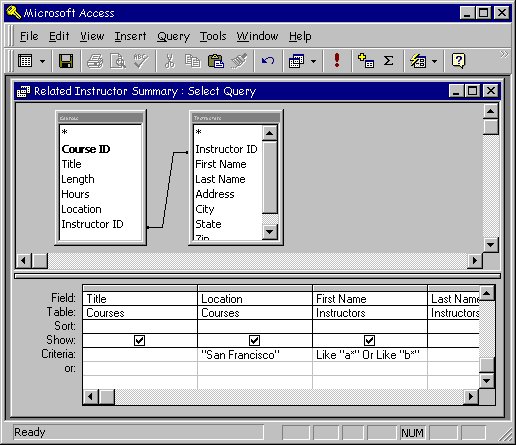
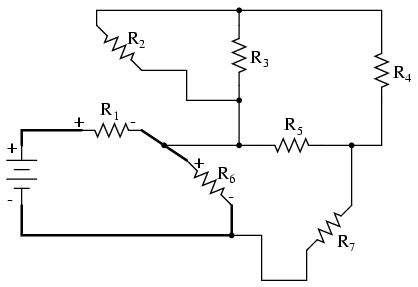

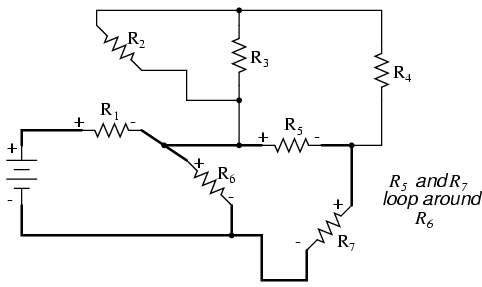
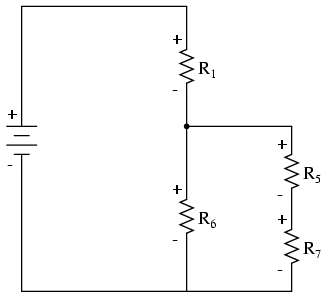
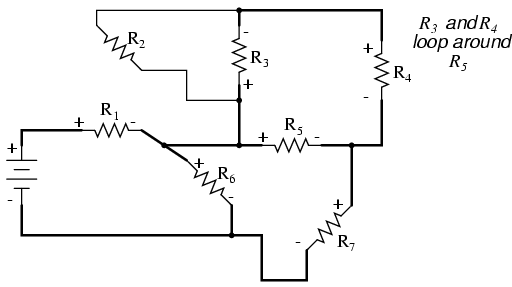
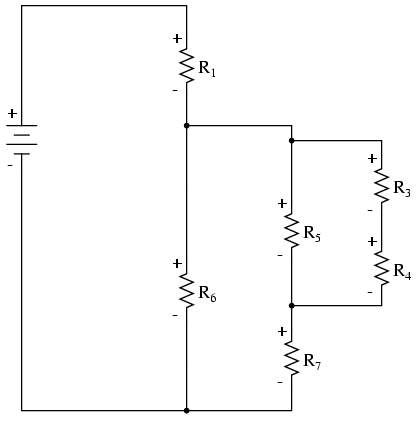
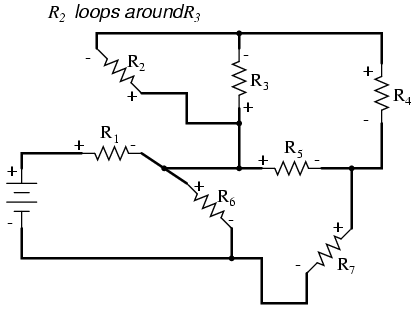
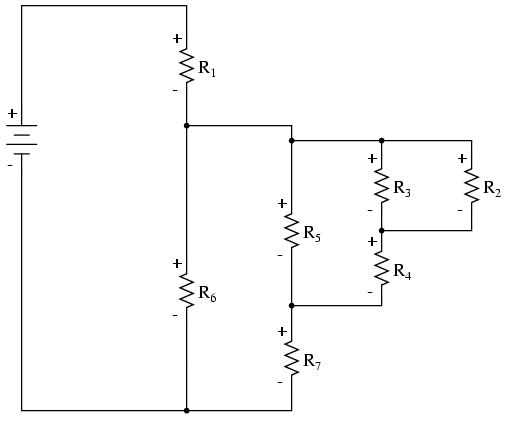
 If you want your very own keyboard you are probably going to have an unusual layout. Mine is compact, with arrow cluster and few but important differences from a “standard” keyboard.
 Next you need a case and the plate where the switches will be housed. The easiest way is to laser cut various layers of acrylic or aluminum and screw them together to build up your keyboard case.
 The switches can be connected to the controller on a PCB or you can also hand-wire them directly. It’s a long task but it’s not too difficult and spares you the hassle of designing the PCB.
 Next the controller. The Teensy is a very small USB HID compatible controller based on ATMega chip. It’s very common for custom keyboards because a nice guy cooked an incredibly good keyboard firware for it. It is called TMK Keyboard and you can find it on github. You can also probably use any of the Adafruit‘s or Sparkfun‘s controllers or even Arduino.