e-money--or electronic money--as the digital equivalent of cash, stored on an electronic device or remotely at a server. Data is from the Bank for International Settlements' Statistics on payment, clearing and settlement systems in
Electronic payment can refer just to e-commerce--or payments for buying and selling goods or services offered online--or to any type of electronic funds transfer. Use of e-money is still in its infancy in comparison with more mature payments channels, such as checks and direct debits. In fact, according to data from the BIS Committee on Payment and Settlement Systems (CPSS), e-money accounted, in 2011, for much less than 1% of transaction value in all reporting countries with highs of 0.22% of total volume of payments in Singapore (the equivalent of $1.7 billion) and 0.1% in Italy (or $13.5 billion.) The same is true in terms of number of transactions. Singapore, with 2.8 billion of them, has, by far, the most active e-money market, with 88% of payments happening via this method. Italy is a distant second, with approximately 152 million e-money transactions accounting for approximately 4% of total number of payments. However new technology developments and regulatory initiatives around electronic payments hold the promise of vastly increasing payments traffic through this channel, particularly in the consumer space. With mobile payments technology—such as Near Field Communications (NFC) -- advancing rapidly and those in the payments and mobile space—from system providers to banks to mobile service providers—pouring resources into its development, this will further push development of the e-money usage.
In addition, modern payments infrastructure and the rapid increase in mobile penetration in emerging markets— especially within Asia --may drive e-money growth in developing countries faster than many developed markets.
XXX . V Debt Instrument
What is a 'Debt Instrument'
A debt instrument is a paper or electronic obligation that enables the issuing party to raise funds by promising to repay a lender in accordance with terms of a contract. Types of debt instruments include notes, bonds, debentures, certificates, mortgages, leases or other agreements between a lender and a borrower. These instruments provide a way for market participants to easily transfer the ownership of debt obligations from one party to another.
A debt instrument is legally enforceable evidence of a financial debt and the promise of timely repayment of the principal, plus any interest. The importance of a debt instrument is twofold. First, it makes the repayment of debt legally enforceable. Second, it increases the transferability of the obligation, giving it increased liquidity and giving creditors a means of trading these obligations on the market. Without debt instruments acting as a means of facilitating trading, debt would only be an obligation from one party to another. However, when a debt instrument is used as a trading means, debt obligations can be moved from one party to another quickly and efficiently.
Debt instruments can be either long-term obligations or short-term obligations. Short-term debt instruments, both personal and corporate, come in the form of obligations expected to be repaid within one calendar year. Long-term debt instruments are obligations due in one year or more, normally repaid through periodic installment payments.
Short-Term Debt Instruments
From a personal finance perspective, short-term debt instruments come in the form of credit card bills, payday loans, car title loans and other consumer loans that have repayment terms of less than 12 months. If a person incurs a credit card bill of $1,000, the debt instrument is the agreement that outlines the obligated payment terms between the borrower and the lender.
In corporate finance, short-term debt usually comes in the form of revolving lines of credit, loans that cover networking capital needs and Treasury bills. If for example, a corporation looks to cover six months of rent with a loan while it tries to raise venture funding, the loan is considered a short-term debt instrument.
Long-Term Debt Instruments
Long-term debt instruments in personal finance are usually mortgage payments or car loans. For example, if an individual consumer takes out a 30-year mortgage for $500,000, the mortgage agreement between the borrower and the mortgage bank is the long-term debt instrument.
However, sometimes, long-term debt instruments, like car loans become short-term instruments when the obligation is expected to be fully repaid within one year. If a person takes out a five-year car loan, after the fourth year, the debt becomes a short-term instrument.
For corporations, long-term debt instruments come in the form of corporate debt. This type of debt is used to fund growth and expansion and is classified on a company's balance sheet.
XXX . V0 Money creation
Money creation (also known as credit creation) is the process by which the money supply of a country or a monetary region (such as the Eurozone) is increased.
Most of the money supply is in the form of bank deposits. Bank loans may increase the quantity of broad money to more than the amount of base money issued by the central bank. Governmental authorities, including central banks and other bank regulators, can use policies such as reserve requirements, and capital adequacy ratios to limit the amount of broad money created by commercial banks. Central banks may also introduce new money into the economy by issuing coins and notes, and by using "expansionary monetary policies" such as the purchase of financial assets (quantitative easing) or loans to financial institutions.
Money issued by central banks is called base money, or reserves, while money issued by commercial banks or other intermediaries is termed broad money.
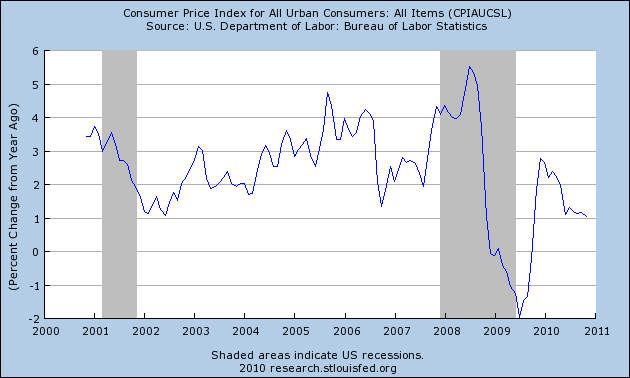
Central banks monitor the amount of money in the economy by measuring monetary aggregates such as M2. The effect of monetary policy on the money supply is indicated by comparing these measurements on various dates. For example, in the United States, money supply measured as M2 grew from $6.407 trillion in January 2005, to 18.136 trillion in January 2009.
Money creation by the central bank
Countries Money Supply Growth vs Inflation Rates 2014
Monetary policy regulates a country's money supply, the amount of broad currency in circulation. Almost all modern nations have central banks such as the United States Federal Reserve System, the European Central Bank (ECB), and the People's Bank of China for conducting monetary policy. Charged with the smooth functioning of the money supply and financial markets, these institutions are generally independent of the government executive.
The primary tool of monetary policy is open market operations: the central bank buys and sells financial assets such as treasury bills, government bonds, or foreign currencies from private parties. Purchases of these assets result in currency entering market circulation, while sales of these assets remove currency. Usually, open market operations are designed to target a specific short-term interest rate. For example, the U.S. Federal Reserve may target the federal funds rate, the rate at which member banks lend to one another overnight. In other instances, they might instead target a specific exchange rate relative to some foreign currency, the price of gold, or indices such as the consumer price index.
Other monetary policy tools to expand the money supply include decreasing interest rates by fiat; increasing the monetary base; and decreasing reserve requirements. Some other means are: discount window lending (as lender of last resort); moral suasion (cajoling the behavior of certain market players); and "open mouth operations" (publicly asserting future monetary policy). The conduct and effects of monetary policy and the regulation of the banking system are of central concern to monetary economics.
Physical currency
In modern economies, relatively little of the supply of broad money is in physical currency. For example, in December 2010 in the United States, of the $8.853 trillion in broad money supply (M2), only about 10% (or $915.7 billion) consisted of physical coins and paper money.[3] The manufacturing of new physical money is usually the responsibility of the central bank, or sometimes, the government's treasury.
Contrary to popular belief, money creation in a modern economy does not directly involve the manufacturing of new physical money, such as paper currency or metal coins. Instead, when the central bank expands the money supply through open market operations (e.g., by purchasing government bonds or commercial bank assets), it credits the accounts that the government or commercial banks hold at the central bank (termed high-powered money). Governments or commercial banks may draw on these accounts to withdraw physical money from the central bank. Commercial banks may also return soiled or spoiled currency to the central bank in exchange for new currency.
In the future, it is possible that central banks will issue digital currencies in replacement of cash.
Quantitative easing
Quantitative easing (QE) involves the creation of a significant amount of new base money by a central bank through buying assets that it usually does not buy. Usually, a central bank will conduct open market operations by purchasing short-term government bonds or foreign currency. However, during a financial crisis, the central bank may acquire additional types of financial assets. The central bank may buy long-term government bonds, company bonds, asset-backed securities, stocks, or even extend commercial loans. The intent is to stimulate the economy by increasing liquidity and promoting bank lending in cases when interest rates cannot be pushed any lower.
Quantitative easing increases reserves in the banking system (i.e., deposits of commercial banks at the central bank), giving depository institutions the ability to make new loans. Quantitative easing is typically used when lowering the discount rate is no longer effective because interest rates are already close to, or at, zero. In such a case, normal monetary policy cannot further lower interest rates, and the economy is in a liquidity trap.
Monetary financing
In principle, central banks can create money de novo in order to finance government spending, a process known as debt monetization.
Monetary financing used to be standard monetary policy in many countries including Canada[5] and France. Under the influence of monetarism, monetary financing has been gradually prohibited by law in many countries, under the rationale that monetary financing can be dangerously inflationary.
In the Eurozone for example, Article 123 of the Lisbon Treaty explicitly prohibits the European Central Bank from financing public institutions.[6]
Money creation by commercial banks
In contemporary monetary systems, most money in circulation exists not as cash or coins created by the central bank, but as bank deposits. Commercial bank lending expands the amount of bank deposits. Through fractional reserve banking, the modern banking system expands the money supply of a country beyond the amount initially created by the central bank, creating most of the broad money in the system.
There are two types of money in a fractional-reserve banking system: currency originally issued by the central bank, and bank deposits at commercial banks:[9][10]
Central bank money (all money created by the central bank regardless of its form, e.g., banknotes, coins, electronic money)
Commercial bank money (money created in the banking system through borrowing and lending) – sometimes referred to as checkbook money[11]
When a commercial bank loan is extended, new commercial bank money is created if the loan proceeds are issued in the form of an increase in a customer's demand deposit account (that is, an increase in the bank's demand deposit liability owed to the customer).[citation needed] As a loan is paid back through reductions in the demand deposit liabilities the bank owes to a customer, that commercial bank money disappears from existence. Because loans are continually being issued in a normally functioning economy, the amount of broad money in the economy remains relatively stable. Because of this money creation process by the commercial banks, the money supply of a country is usually a multiple larger than the money issued by the central bank; that multiple was traditionally determined by the reserve requirements and now essentially by other financial ratios (primarily the capital adequacy ratio that limits the overall credit creation of a bank) set by the relevant banking regulators in the jurisdiction.[citation needed]
Re-lending
An early table, featuring reinvestment from one period to the next and a geometric series, is found in the tableau économique of the Physiocrats, which is credited as the "first precise formulation" of such interdependent systems and the origin of multiplier theory.[12]
The most common mechanism used to measure this increase in the money supply is typically called the money multiplier. It calculates the maximum amount of money that an initial deposit can be expanded to with a given reserve ratio – such a factor is called a multiplier. It is the maximum amount of money commercial banks can legally create for a given quantity of reserves.
It is calculated as
where = deposit multiple = required reserve ratio.
In the re-lending model, this is alternatively calculated as a geometric series under repeated lending of a geometrically decreasing quantity of money: reserves lead loans. In endogenous money models, loans lead reserves, and it is not interpreted as a geometric series. In practice, because banks often have access to lines of credit, and the money market, and can use day time loans from central banks, there is often no requirement for a pre-existing deposit for the bank to create a loan and have it paid to another bank.
If banks accumulate excess reserves, as occurred in such financial crises as the Great Depression and the Financial crisis of 2007–2008 – in the United States since October 2008, the relationship between base money and broad money breaks down, and central bank money creation may not result in commercial bank money creation, instead remaining as unlent (excess) reserves.[15] However, the central bank may shrink commercial bank money by shrinking central bank money, since reserves are required – thus fractional-reserve money creation is likened to a string, since the central bank can always pull money out by restricting central bank money, hence reserves, but cannot always push money out by expanding central bank money, since this may result in excess reserves, a situation referred to as "pushing on a string".
Alternative theories
There are also heterodox theories of how money is created. These include:
Chartalism sees the state as creating money when it spends, and destroying it when it taxes. More importantly, the private banking system is not, in empirical terms, reserve-limited, so its creation of money is an endogenous process, driven by credit demand and lending willingness. This accounts for the power of the state's interest rate policy in governing most of the money supply in normal times.
A Program for Monetary Reform was a proposal for reforming the banking system in the United States following the Great Depression, to aid the return of the American economy to full employment. It was written in 1939 by a group of prominent economists and circulated within the academic community.
Background
A Program for Monetary Reform (1939) was never published. A copy of the paper was apparently preserved in a college library. Copies of the paper, stamped on the bottom of the first and last pages, “LIBRARY – COLORADO STATE COLLEGE OF A. & M. A. – FORT COLLINS COLORADO” were circulated at the 5th Annual American Monetary Institute Monetary Reform Conference (2009) and the images were scanned for display on the internet.
Ronnie J. Phillips, then a Professor of Economics at Colorado State University, referenced the paper in his book, The Chicago Plan & New Deal Banking Reform (1995). Phillips is currently a Senior Fellow at the NetWorks Financial Institute at Indiana State University.
Historical significance
Many of the efforts made by economists to reform the banking system in the wake of the Great Depression found their way into the history books. Perhaps the most notable proposals were first put forward by economists at the University of Chicago in a six-page memorandum on banking reform which was given limited and confidential distribution to about 40 individuals on March 16, 1933. A copy of the memorandum was sent to Henry A. Wallace, then Secretary of Agriculture, with a cover letter signed by Frank Knight. Paul Douglas was listed among the supporters of the plan.
During the period March to November, the Chicago economists received comments from a number of individuals on their proposal and in November 1933 another memorandum was prepared. The memorandum was expanded to thirteen pages, there was a supplementary memorandum on "Long-time Objectives of Monetary Management" (seven pages) and an appendix titled "Banking and Business Cycles" (six pages). Evidently written by Henry Simons the memorandum was again supported by Paul Douglas.
The collective recommendations of these memorandum have come to be known as the Chicago plan. The memorandum generated much interest and discussion among lawmakers but the suggested reforms, such as the abolition of the fractional reserve system and imposition of 100% reserves on demand deposits, were set aside and replaced by watered down alternative measures. The Banking Act of 1935 institutionalized Federal deposit insurance and the separation of commercial and investment banking; it successfully restored the public's confidence in the banking system and ended discussion of banking reform until the Recession of 1937–1938.
The July 1939 draft proposal, coauthored by Paul Douglas and five others, resurrected proposals for banking and monetary reform from the Chicago plan but did not result in any new legislation.
Hard currency
Hard currency, safe-haven currency or strong currency is any globally tradedcurrency that serves as a reliable and stable store of value. Factors contributing to a currency's hard status might include the long-term stability of its purchasing power, the associated country's political and fiscal condition and outlook, and the policy posture of the issuing central bank.
Safe haven currency is defined as a currency which behaves like a hedge for a reference portfolio of risky assets conditional on movements in global risk aversion.[1]
Conversely, a soft currency indicates a currency which is expected to fluctuate erratically or depreciate against other currencies. Such softness is typically the result of political or fiscal instability within the associated country.
The US dollar (USD) has been considered a strong currency for much of its history. Despite the Nixon Shock of 1971, and the United States' growing fiscal and trade deficits, most of the world's monetary systems have been tied to the US dollar due to the Bretton Woods System and dollarization. Countries have thus been compelled to purchase dollars for their foreign exchange reserves, denominate their commodities in dollars for foreign trade, or even use dollars domestically, thus buoying the currency's value.
The euro (EUR) has also been considered a hard currency for much of its short history, however the European sovereign debt crisis has partially eroded that confidence.
The Swiss franc (CHF) has long been considered a hard currency, and in fact was the last paper currency in the world to terminate its convertibility to gold. In the summer of 2011, the European sovereign debt crisis led to rapid flows out of the euro and into the franc by those seeking hard currency, causing the latter to appreciate rapidly. On September 6, 2011, the Swiss National Bank announced that it would buy an "unlimited" number of euros to fix an exchange rate at 1.00 EUR = 1.20 CHF, to protect its trade. This action temporarily eliminated the franc's hard currency advantage over the euro but was abandoned in January 2015.
Demand
Investors as well as ordinary people generally prefer hard currencies to soft currencies at times of increased inflation (or, more precisely, times of increased inflation differentials between countries), at times of heightened political or military risk, or when they feel that one or more government-imposed exchange rates are unrealistic. There may be regulatory reasons for preferring to invest outside one's home currency, e.g. the local currency may be subject to capital controls which makes it difficult to spend it outside the host nation.
For example, during the Cold War, the ruble in the Soviet Union was not a hard currency because it could not be easily spent outside the Soviet Union and because the exchange rates were fixed at artificially high levels for persons with hard currency, such as Western tourists. (The Soviet government also imposed severe limits on how many rubles could be exchanged by Soviet citizens for hard currencies.) After the fall of the Soviet Union in December 1991, the ruble depreciated rapidly, while the purchasing power of the US dollar was more stable, making it a harder currency than the ruble. A tourist could get 200 rubles per US dollar in June 1992, and 500 rubles per USD in November 1992.
In some economies, which may be either planned economies or market economies using a soft currency, there are special stores that accept only hard currency. Examples have included Tuzex stores in the former Czechoslovakia, Intershops in East Germany or Friendship stores in China in the early 1990s. These stores offer a wider variety of goods – many of which are scarce or imported – than standard stores.
Mixed currencies
Because hard currencies may be subject to legal restrictions, the desire for transactions in hard currency may lead to a black market. In some cases, a central bank may attempt to increase confidence in the local currency by pegging it against a hard currency, as is this case with the Hong Kong dollar or the Bosnia and Herzegovina convertible mark. This may lead to problems if economic conditions force the government to break the currency peg (and either appreciate or depreciate sharply) as occurred in the 1998–2002 Argentine great depression.
In some cases, an economy may choose to abandon local currency altogether and adopt another Fiat money as legal tender in a process known as dollarization. Examples include the adoption of the US dollar in Panama, Ecuador, El Salvador and Zimbabwe and the adoption of the German mark and later the euro in Kosovo and Montenegro
Representative money
U.S. $50 gold certificate
Representative money is any medium of exchange that represents something of value, but has little or no value of its own (intrinsic value). However, unlike some forms of fiat money (which may not have anything of value backing it), to be a genuine representative money, there must always be something valuable supporting the face value represented.[1]Cryptocurrency, like Bitcoin for example, is not a form of representative money because it does not represent anything of value.
More specifically, the term representative money has been used variously to mean:
Any type of money that has face value greater than its value as material substance. Used in this sense, most types of fiat money are a type of representative money.
Historically, the use of representative money predates the invention of coinage. In the ancient empires of Egypt, Babylon, India and China, the temples and palaces often had commodity warehouses which issued certificates of deposit as evidence of a claim upon a portion of the goods stored in the warehouses, a form of "representative money".[1]
According to economist William Stanley Jevons (1875), representative money in the form of Bank Notes arose because metal coins often were "variously clipped or depreciated" during use, but using representations for the value stored in banks ensured its worth. He noted that paper and other materials have been used as representative money.[5]
In 1895 economist Joseph Shield Nicholson wrote that credit expansion and contraction was in fact the expansion and contractions of representative money.[6]
In 1934 economist William Howard Steiner wrote that the term was used "at one time to signify that a certain amount of bullion was stored in the Treasury while the equivalent paper in circulation" represented the bullion.
XXX . V00000 The Future of Money and of Monetary Policy
Money and the payment system have evolved over time. The earliest forms of money were commodities, such as cattle and grain, that came to be used as means of payment and stores of value, two properties that effectively define money. Over time, precious metals, specifically silver and gold, became dominant forms of payment. From the 1870s to World War I and, in some cases, into the Great Depression, many nations backed their currencies with gold. Later, fiat money--currency and coin issued by the government but not backed by any commodity--became the dominant form of money, along with deposits issued by banks. What has driven this evolution of money, and what is the future of money? This is the first set of questions that motivate this lecture. Money also provides a metric for the measurement of prices. That is, once you have defined the unit of exchange, you can measure the price of any other item in terms of that unit. Money is also obviously related to monetary policy. Another theme of the lecture is the relationship between the nature of money, the scope for changes in the overall level of prices, and constraints on or opportunities for discretionary monetary policy.
The next step in the evolution of the nature and transfer of money appears to be the spread of electronic forms of money and payment. In the United States, deposit money issued by private banks grew rapidly in the late nineteenth and the twentieth centuries. From a historical perspective, a now well-established form of electronic money is the bank deposit stored on the computers of the banking industry. Ironically, the most widely used method by the general public for transferring this electronic type of money is still the paper check, although large-value transactions between banks and between some businesses are electronic. In the early-to-mid-1990s, a new generation of technology created the possibility of storing monetary value on a silicon chip embedded in a plastic card or in a personal computer. With these developments, the focus of payments development shifted to electronic money--e-money--using card-based and computer-based products (often referred to as stored-value cards and network money, respectively) that consumers might use as a general means of payment in both the physical and the virtual worlds. What is driving the evolution toward electronic payments and perhaps toward new forms of electronic money? How rapidly is the innovation catching on, and what will the payment system look like in the future? How would the spread of e-money affect financial stability and the conduct and effectiveness of monetary policy? This is a third set of questions that motivate my lecture. In the past, money was often privately produced, though today note and coin production has generally become a government monopoly. The development of e-money has generated a fascinating debate about the possibility of reintroducing privately issued currency in the United States. What would be the implications for the payment system and for the central bank of the reintroduction of what is in effect private currency? Could the development of private money and private clearing balances make the Fed obsolete? If so, what becomes of monetary policy, and how would the price level be determined? These are the final themes that motivate my lecture. The Evolution of Money The range of commodities used over time as money is very wide; it includes cattle, grain, knives, spades, shells, beads, bronze, silver, and gold. The oldest recorded use of money dates back 4,500 years to ancient Mesopotamia, now part of Iraq. About 3,500 years ago, cowrie shells from the Indian Ocean were used as a means of payment in China. Passages in the Bible indicate that silver was used as a means of payment in the time of Genesis.1 The first coins--lumps of "electrum," a natural mixture of gold and silver--were introduced in Asia Minor in the seventh century B.C. in Lydia, now part of Turkey. Driving the evolution of money, from the earliest emergence of commodity money, has been the desire to increase the efficiency of carrying out exchanges. In the absence of money, trade is accomplished by barter, the direct exchange of commodities or services to the mutual advantage of both parties. Such exchanges require a double coincidence of wants or multiple trades. If I have apples and want grain, I have to find someone who has grain and wants apples. Alternatively, I can engage in a series of intermediate trades that ultimately result in the exchange of apples for grain. In primitive societies with a small range of goods, barter can work well enough, but as the range of goods expands, barter becomes increasingly inconvenient and costly. Several considerations have affected the evolution of commodity money itself--from cattle and grain toward shells and then bronze and ultimately to silver and gold. Commodities are useful as a means of payment and store of value if they were are less bulky in relation to their value, more durable, more homogeneous, and more easily verified as to their worth than other commodities. These considerations favored the use of the precious metals, for example, over cattle and grain, encouraged the use of gold and silver rather than bronze and copper, and further affected the way that silver and gold were used as money over time. Early commodity money, for example, was weighed, not counted, including the early uses of silver and gold. The introduction of coins that were stamped with their weight and purity allowed money to be counted and again reduced the costs associated with making transactions. Silver became the dominant money throughout medieval times into the modern era. Relative to silver, copper was too heavy and gold was too light when cast into coins of a size and weight convenient for transactions. The next important evolution was the introduction of "representative" paper money. Warehouses accepted deposits of silver and gold and issued paper receipts. These paper receipts in turn began to circulate as money, used as a means of payment and held as a store of value. The paper was fully backed by the precious metals in the warehouse. Once again, efficiency was enhanced by the convenience of carrying paper money as opposed to the bulkier silver or gold coins. Owners of the warehouses soon learned that the holders of the paper receipts would not simultaneously redeem the gold deposited with them. The warehouses could therefore lend the gold--in turn, often converted into paper notes--holding a reserve of gold that allowed them to meet the normal demands for redemption. This is the beginning of fractional reserve banking. Seventeenth-century English goldsmiths are usually credited with this transition to modern banking, though the first paper money was introduced in China in the seventh century, a thousand years before the practice became widespread in Europe. Paper notes and early banking were introduced in Europe in medieval times and further advanced by the great banking families of the Renaissance. The spread of paper notes and fractional reserve banking opened up the potential for credit expansion to support economic development but also introduced the possibility of runs and liquidity crises as well as the risk of insolvency through the credit risk associated with the lending. In the nineteenth century, many countries were on a bimetallic standard, allowing the minting of both gold and silver coins. But by late in that century, many countries had moved to the gold standard, and currency and bank reserves were backed exclusively by gold. Barry Eichengreen (1996) describes the gold standard as "one of the great monetary accidents of modern times," owing to England's "accidental adoption" of a de facto gold standard in 1717. Sir Isaac Newton was master of the mint at the time and, according to Eichengreen, set too low a price for silver in terms of gold, inadvertently causing silver coins to mostly disappear from circulation. As Britain emerged as the world's leading financial and commercial power, the gold standard became the logical choice for many other countries that sought to trade with and borrow from, or emulate, England, replacing silver or bimetallic standards. England officially adopted the gold standard in 1816. The United States moved to a de facto gold standard in 1873 and officially adopted the gold standard in 1900. The international gold standard refers to the period from the 1870s to World War I, during which time the major trading countries were simultaneously on the gold standard. Though many countries went off the gold standard during World War I, some returned to a form of gold standard in the 1920s. The final blow to the gold standard was the Great Depression, by the end of which the gold standard was history. Eichengreen argues that the emergence of the gold standard reflected the specific historical conditions of the time. First, governments attached a high priority to currency and exchange rate stability. Second, they sought a monetary regime that limited the ability of government to manipulate the money supply or otherwise make policy on the basis of other considerations. But by World War I, economic and political modernization was undermining the support for the gold standard. Fractional reserve banking, according to Eichengreen, "exposed the gold standard's Achilles' heel." The threat and, indeed, reality of bank runs created a vulnerability for the financial system and encouraged governments to seek a lender of last resort to provide liquidity at times of distress. Such intervention was, however, inconsistent with the gold standard. The international gold standard involved adherence to certain "rules of the game." First, the national unit of currency had to be defined in terms of a certain quantity of gold. Second, central banks had to commit to buy and sell gold at that price. Third, gold could be freely coined, such coins represented a significant part of the money in circulation, and other forms of money were convertible into gold at a fixed price on demand. Fourth, gold could be freely imported and exported.2 With the collapse of the gold standard, countries moved to fiat money systems. Fiat money is inconvertible, meaning that it is not convertible into nor backed by any commodity. It serves as legal tender by decree, or fiat, of the government. Its value is based on trust--specifically that others will accept it in payment for goods and services and that its value will remain relatively stable. This trust is based, in part, on laws that make the fiat money "legal tender" in the payment of taxes and, in the United States, also in the payment of private debts.3 Fiat money consists of both paper currency and metal coins the face value of which exceeds the value of the metal content of the coins. The need to finance wars encouraged early efforts by governments to issue fiat money. Early examples include the continentals issued by the American government during the Revolutionary War, assignats issued during the French Revolution, and the greenbacks issued during the Civil War. Most such issues of fiat money were followed by severe increases in prices, as governments tapped to an ever greater degree the easiest--in some cases perhaps the only--source of revenue. These experiences highlight the importance of control of the money supply for achieving price stability. Today, money consists of currency, coin, and transactions deposits (that is, checking accounts) at depository institutions, including, in the United States, commercial banks, thrift institutions, and credit unions.4 It is not clear when the first check was written. The earliest evidence of deposits that might be subject to checks is from medieval Italy and Catalonia. But at that time, the depositor had to appear in person to withdraw funds or to transfer them to the account of another customer. Checks did not come into widespread use until the early sixteenth century in Holland and until the late eighteenth century in England. The payment system has evolved further in recent decades with the spread of credit cards and then debit cards. Credit cards allow consumers to purchase all kinds of goods "on credit," making payment to the credit-card company for a collection of purchases later by check. In effect, the use of credit cards separates the purchase of goods from the ultimate settlement but increases the efficiency of exchange. Debit cards allow the consumer to make a purchase from a checking account through an electronic instruction to debit the account instead of by writing a check, another advance in efficiency. Even more recently, electronic money has been introduced, still perhaps more in concept than in practice, at least in the United States. I will return to the role of electronic money today and the potential for the spread of electronic money in the future. Money, Monetary Standards, and Monetary Policy The nature of money determines some important properties of the economy, including the scope for changes in the overall price level and the opportunity for discretionary monetary policy -- that is, for control of the money supply in an effort to improve economic performance. The basic relationship between money and prices is often described in terms of the "quantity theory of money." In the long run, according to this proposition, the price level moves proportionately to the money supply. As a result, the rate of inflation depends on the rate of money growth. Though this proposition holds precisely only under restrictive conditions, it identifies in a more general sense an essential link between money and prices. It is therefore useful in understanding the way changes in the nature of money might affect the determination of the price level.5 Under commodity money systems, money is often privately produced, and the price level of non-money goods in terms of the commodity money depends on the supply of commodity money relative to the supplies of the non-money commodities. In a sense, there is no absolute price level of goods in such an economy, only a set of relative prices. However, the relative prices of non-money goods in terms of the commodity money become, in effect, a measure of money prices, as we would think of that term today. The supply of commodity money, in turn, depends on technology and--particularly in the case of precious metals--on the pace of discovery. Prices of non-money goods in terms of the commodity money need not be constant, but there is no opportunity for discretionary monetary policy. As states came at times to monopolize the issue of commodity money, such as gold or silver coins, they often were tempted to debase the currency by reducing the proportion of silver or gold in the coins in an attempt to realize "seignorage" or revenue from issuing money. Debasement of the currency typically resulted in inflation--a rise in the price of non-money goods in proportion to the debased currency, which, in effect, maintained the underlying relationship between the commodity, gold or silver, and the price of other goods. These are the first experiences with significant inflation induced by government's manipulation of money. The next evolutionary step was representative paper money. As long as the relationship between the commodity money and the amount of paper money backed by the commodity money is stable, inflation will be determined by the available supply of commodity money. But the beginning of modern banking, by breaking the strict link between the commodity money and the money supply, added an element of flexibility to the money supply and further opened up the possibility for inflation. During the international gold standard period, currency issue and coin production were linked to and convertible into gold, so that a country's total domestic money supply was tied to the domestic supply of gold. This situation did not guarantee a stable price level, but it did remove the risk of government-induced inflation. The result--and an indeed an important motivation--was to constrain and, in principle, eliminate the government's discretion regarding the supply of money. The gold standard, in effect, put in place a rule that governed monetary policy.6 If a country ran a trade deficit that exceeded private capital inflows, it would, in principle, finance the difference by shipping gold to other countries. Doing so reduced the money supply--and hence income and prices--in the country with the balance of payments deficit and increased the money supplies, incomes, and prices in the countries with balance of payments surpluses. As a result, the system had a built-in tendency to move the deficit and surplus countries toward balance. In fact, drains on a country's gold or foreign exchange reserves were typically countered by an increase in central bank's discount rate. The effect on income and prices was, in this case, not due directly to changes in the gold supply, but to the changes in interest rates that were implemented to limit the drain on gold. However, principle and practice differed under the gold standard. Richard Cooper (1992) summarizes the contrast in the following terms: "The idealized gold standard . . . conveys a sense of automaticity and stability--a self-correcting mechanism with minimum human intervention, which ensures rough stability of prices and balance in international payments. . . .The actual gold standard could hardly have been further from this representation." Cooper notes that economic growth during the late nineteenth century was respectable, but variability in income growth was substantially greater under the gold standard than during the period after World War II.7 But the gold standard was predominantly about price stability, so here we might give special weight to evidence pertaining to that characteristic. Cooper notes that short-run variations in wholesale prices were greater during the pre-war gold standard than during the period from 1949 to 1979. In assessing economic performance under the gold standard, one must also look at possible trends in prices. Here the story is more complicated. If one compares 1877 and 1913, for example, the price level is essentially unchanged. But the period covers a sharp and extended decline in the price level followed by an equally sharp and persistent increase. Prices from 1873 to 1896, for example, decreased 53 percent; this decrease was followed by an increase of 56 percent from 1896 to 1913. These swings can be explained, in large measure, by fluctuations in gold production driven by discoveries of new deposits. In the early post-World War II period, nations sought an alternative to the international gold standard to govern exchange rates and international economic relations. At a conference at Bretton Woods, New Hampshire, in 1944, participating governments agreed to maintain a fixed exchange rate system--more precisely, an adjustable peg. Exchange rates were mostly stable but could be altered in discrete amounts, under prescribed circumstances--allowing deviation from a fully rules-based system to one with more discretion. In practice, the system was implemented by the commitment of the United States to maintain a fixed relation between its currency and gold and other countries' agreement to fix their exchange rates relative to the dollar, at rates agreed to at the conference. Fixed exchange rate systems provide a degree of constraint on domestic monetary policies. Under such a system, imbalances in payments were settled by flows of acceptable assets, typically gold or dollars. Most countries, given limits on their international reserves, had to follow policies consistent with supporting their fixed exchange rates--though, as noted above, they had the option of changing the exchange rate. The United States, however, was in a unique position because it could print more of the assets--dollars--acceptable for settling payment imbalances. As long as the United States was prepared to convert dollars into gold, at a fixed exchange rate for official purposes, other countries seemed willing to hold dollars. As dollars grew relative to the U.S. gold supply, the sustainability of this system came into question. When the United States broke the link to gold in 1971, other major countries no longer were willing to accept dollars at the fixed exchange rate. The adjustable peg system broke down, and the world ended up, de facto, in a regime of floating exchange rates, with exchange rates determined by supply and demand in the foreign exchange market. Most countries were operating under fiat money systems by this time. The combination of fiat money systems and floating exchange rates removed the earlier constraints on domestic monetary policies for other countries and made price stability and other dimensions of domestic economic performance dependent on the conduct of their domestic monetary policies. Central banks had to learn how to exercise that discretion in support of the objectives usually dictated by their legislatures, almost always including price stability and, in the case of the United States, price stability and full employment.8 There have been disappointments as well as successes with monetary policy around the world. Over time, the number of independent central banks has increased significantly, and independence no doubt enhances the ability of central banks to achieve price stability. There has also been an advance in our understanding of how to conduct monetary policy to achieve stable rates of inflation, at least on average over a period of years, and perhaps also to contribute, at the same time, to smoothing output and employment growth. Over the last ten to fifteen years, coinciding with both an increased emphasis on the price stability objective and the advances in our understanding about the conduct of policy, inflation performance has been very good. However, some countries today continue to impose constraints on discretionary monetary policy through fixed exchange rate regimes, tying their inflation rates to inflation in the country to which their exchange rate is pegged. This system does not eliminate the influence of discretion, but it makes inflation in one country dependent on the discretionary monetary policy in some other country. A currency board and dollarization are tighter versions of a fixed exchange rate regime--that is, fixed exchange rate systems from which it is progressively more costly to exit. The Payments System Today The payment systems in use today rely on concepts developed in the eighteenth century and before as well as on those developed in the twentieth century. Paper instruments are vital to commerce and so are electronic systems. To understand the long-term incentive for the spread of electronic payments and potentially new forms of money, one must appreciate the complexities and costs associated with our current payment system. As checks came into more widespread use, banks that accepted checks for deposit had to find ways to exchange checks drawn on a variety of other banks and to receive appropriate value for those checks--processes called "collection" and "settlement." First, banks sent messengers directly to other banks to collect the money due to them and their customers, the direct presentment method of check collection. Second, out-of-town banks would send checks to a correspondent bank, which in turn would collect the check, the correspondent banking method. Both of these methods required significant travel and could require the movement of large amounts of banknotes or gold. According to banking lore, a third solution to the interbank check collection problem evolved at a British pub. A London bank messenger stopped by for a pint (or two) and allegedly met another bank messenger. They quickly discovered that they each had checks drawn on the other's bank and decided to save time by exchanging them on the spot. More messengers joined the group. These messengers found that they could not only centralize the exchange of checks, they could also net the amounts of money that had to be exchanged among them to settle (pay) the checks they exchanged. This arrangement, the clearinghouse method, was first adopted in the United States by the New York Clearing House in the mid-nineteenth century, and it is still used by banks all over the world today--although, generally speaking, the exchanges are not held at a drinking establishment. In fact, all three methods of interbank check collection still are in use in the United States. In the early twentieth century the creation of the Federal Reserve System helped to improve the efficiency of the payment system in at least two important ways. First, the Fed set up a national system of check-clearing, in which the Fed acts like a correspondent bank with an ability to collect checks throughout the United States. This system improved the existing localized check clearing system by facilitating the collection and settlement of interbank checks among banks scattered throughout the country. Second, the Fed was able to act as a central repository for the reserves of the banking system. Reserve balances held at the Fed are widely used as the settlement vehicle for interbank check-clearing. According to a new Fed survey, households, businesses, and government entities write approximately 50 billion checks each year. The costs of using these checks include processing by depositing and receiving banks and by intermediaries, transportation, accounting, and resolving problems. The estimated cost to the banking industry of operating the entire check clearing system range from approximately ¼ to 1 percent of GDP. In addition, fraud losses in connection with checks are significant, perhaps in the tens of billions of dollars annually, and are growing rapidly. The level of these costs provides an incentive to improve the efficiency of the check clearing process.9 These costs have also encouraged innovation in substitutes for checks, that is, electronic payments, and may foster the development of new payment instruments, such as electronic money. Of course, developing and implementing electronic payment alternatives is expensive; however, electronic payment methods tend to be characterized by high fixed investment costs but low marginal costs, so the average cost per transaction should fall as use rises. The process of innovation, driven by attempts to increase the efficiency of the payment system, is continuing. Banks and technology providers are attempting to develop new payment methods, in many cases building upon the underlying the automated clearing house (ACH), debit card, and credit card networks to find more convenient and secure ways to make purchases, pay bills, settle debts, and post credits, especially over the Internet.10 "On-line" banking involves electronic access to information over the Internet about accounts and loans--including current balances and transactions history--as well as providing the ability to carry out payment related transactions--including transfers among accounts, receiving and paying bills, applying for bank credit cards, and reordering checks. Some so-called virtual banks have been set up to service customers exclusively through electronic channels, but an increasing number of traditional "bricks and mortar" banks see the Internet as another delivery channel that improves convenience for some of their customers. Similarly, the emergence of e-money reflects the attempt to develop new payment methods as a more efficient alternative to existing electronic payment means. The Future of Money: The Spread of E-money Many innovations to existing payment systems have been successful, but the question remains as to how e-money, a fundamentally new payment system, has fared. As mentioned earlier, most types of e-money take one of two forms: stored value cards and network e-money. Initially, many believed that these innovations would allow more retail and smaller-value transactions to be made electronically, paralleling the move to electronic funds transfer for large-value payments. Of course, substantial investments were needed to provide the infrastructure for using these types of payment devices and to ensure that enough consumers and merchants would use them to make the investments worthwhile. In the end, despite optimistic predictions, this first generation of e-money products was not widely adopted in the United States. In general, stored-value cards have been successful in closed payment systems, where e-money was the primary payment instrument accepted, and have failed in open payment systems, where competing instruments were readily available. Examples of closed system successes include mass transit systems, college campuses, and military bases. Two well-publicized open system e-money experiments that fizzled (one at the 1996 Olympics in Atlanta and the other on the Upper West Side of Manhattan in 1997 and 1998) accepted e-money at only limited locations and suffered operational difficulties. Limited locations discouraged consumer use, while operational difficulties discouraged merchant use. Both consumers and retailers were able to substitute other payment instruments, which resulted ultimately in lack of either customer or retailer support for the product. Possibly as a result of these experiences, new e-money plans target captive markets, including corporate expense accounts, teenagers with allowances, and payroll for employees without bank accounts, and use the existing, well-functioning credit card and debit card networks. The fundamental e-money characteristic--that a liability is issued by an entity primarily for the purpose of making payments--is retained. However, these new products are similar to a standard debit card issued by the major networks in terms of technical implementation, institutional arrangements, value transfer, recording of transactions, and currency denomination. I should note, however, that it took years for ATMs and debit card networks to be widely used and accepted within the United States. Ultimately these innovations in the payment system have proved efficient and cost-effective for users. E-money may have a similar experience, with natural setbacks at first, further evolutionary development, and eventually a growing acceptance from the general public. E-money and Financial Stability The spread of e-money could have significant implications for the size of central bank balance sheets, for depository institutions (depending on which are allowed to provide network money), for financial stability, and possibly for the implementation of monetary policy. Let me begin with the implications of the spread of e-money for financial stability. One possible problem is that those issuing the stored-value cards or network money, or clearing the transactions in them, could fail to make good on the promise of convertibility. The situation would be like that of banks issuing private notes under a gold standard. In the period before the founding of the Federal Reserve, bank failures were a common feature of the financial landscape, especially in times of economic and financial stress. Such failures presumably resulted from the effects of poor, dishonest, or excessively aggressive bank management, as well as the impact of adverse economic shocks on poorly diversified banks. While modern-day private money issuers should be able to hold diversified asset portfolios, they could still face strains as a result of larger-than-expected shocks or of management difficulties. Thus, one could imagine "runs" on a particular brand of stored-value card, for example, if the issuer were thought to be in financial trouble. If the issuers were banks and the stored-value cards were, in a legal sense, deposits, then such runs could be managed in the usual way, via the discount window and, if need be, the Federal Deposit Insurance Corporation. If the issuers were not banks, however, then the introduction of new types of private money could increase financial instability and pose difficulties if--and this is a big if--the scale of operations were large relative to the financial system. E-money and Monetary Policy To appreciate the implications of the spread of e-money for monetary policy, it will be helpful to understand the concept of the monetary base (B). The monetary base consists of currency held outside the banking system (C) and bank reserves (R). In the United States, depository institutions hold reserves either in the form of currency--so-called vault cash--or balances at Federal Reserve Banks. Banks are required to hold reserves against their transactions deposits (required reserves), and they voluntarily hold a small amount of excess reserves. Monetary policy is implemented through the Federal Open Market Committee (FOMC) setting a target for the federal funds rate. This is the rate at which banks borrow reserves from one another. The FOMC then gives instructions to the manager of the Fed's portfolio (called the System Open Market Account, or SOMA) to carry out open market operations to hit the target funds rate. The Fed injects the monetary base into the economy through open market operations, purchases or sales of securities from its portfolio. When the Fed purchases securities for its portfolio, it pays for the purchase by creating a balance at one of its regional Reserve Banks--in other words, by creating reserves. The federal funds rate is determined by the supply and demand for such reserves. Through open market operations, the Fed can adjust that supply of reserves so that the market clears at the desired funds rate. The implications of the spread of e-money for monetary policy would arise from the substitution of e-money for both currency and deposits, shrinking the size of the monetary base. Taken by itself, the decline in the demand for currency would have no direct implications for the conduct of monetary policy because what matters for monetary policy is the supply of and demand for reserves.11 A decline in the demand for currency would, however, lower the monetary base and hence reduce the size of the Fed's portfolio of securities. The size of the Fed's portfolio, in effect, determines the seignorage the government obtains through the issue of the monetary base. To the extent that the demand for currency declines, the monetary base and hence the Fed's portfolio would shrink, and the interest earnings on that portfolio would diminish. The Fed uses the interest earnings, along with revenue from fees for check clearing, Fedwire, and other priced services, to cover the cost of its operations. The costs today are a small fraction of the interest earnings; the remainder is returned to the Treasury. The Treasury and hence the American taxpayer are the ultimate beneficiary of the seignorage. The interest earnings also allow the Fed to cover its costs outside the federal government budget and appropriations process, contributing to the independence of the Fed from the executive and legislative branches. Given that the Fed's cost of operations today are less than 10 percent of its interest earnings, the substitution of stored-value cards for currency would have to be very substantial before the budgetary independence of the Federal Reserve would be threatened--though, of course, the Treasury would lose seignorage even from the first dollar of substitution of e-money for currency. If the Fed were to lose so much seignorage that it could not cover its costs under current arrangements, it would have to look for other arrangements to cover its costs in a way that supported its independence. One reason for doubting that currency would dramatically decline is that much of it--at least half and maybe as much as two-thirds--is held abroad mostly as a store of value, not as a means of payment. A further significant portion of outstanding currency is held in connection with criminal activities, because of the anonymity it offers its holders. More interesting is the possibility that the spread of network e-money might dramatically reduce the demand for deposits and hence correspondingly reduce the amount of bank reserves. The effect of the spread of e-money on reserves would depend on who provides it and on the regulatory and statutory responses. For example, will providers be restricted to depository institutions? In this case, the e-money balances could be subject to required reserves, in which case its spread would not reduce reserves. Depository institutions could have a competitive advantage in offering e-money, if it were treated as another form of bank deposit and insured by the FDIC. In that case, the spread of e-money would not significantly reduce the effectiveness of monetary policy. But what if other financial or even nonfinancial firms were allowed to issue e-money? Again, reserves would not be affected if the other providers were subject to reserve requirements, though making them so would require a statutory change. However, the prospect that the spread of e-money could reduce reserves has generated many articles and an interesting debate.12 To address the issues in debate, let's assume that network e-money is not subject to reserve requirements. In this case, reserves would decline, so we would need to analyze the implications of such a decline for the conduct of monetary policy. Fortunately, we already have some experience with earlier innovations that have reduced the demand for reserves. Over the past decade, for example, banks have implemented retail sweep programs. These programs sweep excess funds not immediately needed for transactions from reservable transactions accounts into nonreservable saving accounts, allowing banks to reduce their required reserves. Banks have an incentive to use sweeps to reduce required reserve balances because they pay no interest. As a result of the spread of sweep accounts, the level of required reserve balances has declined from about $28 billion in late 1993 to only about $6 billion today. The Fed has worried that this decline in the level of required reserve balances could result in increased volatility of the funds rate and require the Fed to alter the way it conducts monetary policy. The concern here is the same that would present itself if the spread of network money substituted for transactions deposits and further reduced the level of reserves. If binding, a reserve requirement raises the level of reserves relative to what banks would otherwise hold. In the absence of a reserve requirement, banks would still hold reserves for settlement or clearing purposes. But without the cushion provided by required reserves, the intraday and interday fluctuations in the demand for reserves could increase the volatility of the federal funds rate. I should note, however, that to date, despite the sharp decline in required reserve balances, there has not been an increase in the volatility of the funds rate. The Fed has asked the Congress for statutory authority to pay interest on required reserve balances as well as on excess reserves. Paying interest on required reserve balances would greatly reduce the incentive for banks to conduct sweep programs and would therefore raise the level of transactions deposits and hence reserves. This would diminish the risk that further declines in required reserve balances would increase the volatility of the funds rate. In the absence of such new statutory authority, the Fed has indicated it might need to alter the way it implements monetary policy, in the event that required reserve balances fell further and the volatility of the funds rate increased. To date, because the volatility of the funds rate has not increased, moving in this direction has not been necessary. However, if the volatility of the funds rate did increase, one possibility would be to introduce a regime of floors and ceilings that would limit the fluctuation in the federal funds rate to an acceptable range. The ceiling could be set through a so-called Lombard facility at which banks would be able to borrow at a penalty rate, perhaps 50 basis points above the target funds rate. Banks would never pay more than 50 basis points above the target funds rate to borrow reserves if they had access to such a facility and if borrowing from the facility had no nonpecuniary cost. The floor would be set through a re-deposit facility at which banks could deposit any unwanted reserves with the Fed at a rate perhaps 50 basis points below the target funds rate. Banks would never lend in the market at a rate lower than 50 basis points below the target funds rate if they had access to such a re-deposit facility. The funds rate would thus be limited to a 100-basis range, and open market operations would aim to keep the funds rate on average near the midpoint. In principle, the system could work with somewhat narrower or wider ranges. The same system could be implemented if the spread of e-money reduced the demand for transactions balances and hence the level of required reserves. Such a system is common, indeed almost the norm for other central banks, in the conduct of monetary policy. So there has been a lot of experience with it and the United States could presumably implement it, although a statutory change might be needed to set up a re-deposit facility.13 But what if the spread of network money fully replaces transactions deposits and if reserves are not required against such money? Several countries have eliminated required reserves, and we appreciate today that reserve requirements are not essential for the conduct of monetary policy.14 In any case, under these assumptions, there would be no demand for required reserve balances at the central bank. Nevertheless, if trust in e-money instruments were not complete, holders would presumably demand that e-money be exchangeable for notes and coin at par. In this case, there may be no problem for monetary policy. To make good on the promise of convertibility, the issuers and their clearing and settlement banks would probably hold some notes and coin and some balances at the central bank. The resulting demand for the monetary base would allow the Fed to set the federal funds rate (by setting the supply of reserves, or by setting the terms on deposit and borrowing facilities). If trust in the private provider or providers were complete, and nobody ever doubted their ability to convert stored-value or network money into dollars, then demand for the monetary base could fall to zero. But providers of stored-value cards and network money would still need funds to meet demands as holders of the e-money use it to buy goods and services. Today such so-called settlement balances are held as reserve balances at the central bank. Even if there were no required reserves, banks would still hold settlement balances to meet liquidity needs and might continue to hold these reserves at the central bank. In this case, once again, there does not appear to be a problem for monetary policy. But, just to be sure we have covered all the possibilities, let's assume that banks or other providers of e-money choose to hold settlement balances to meet liquidity needs in the form of interbank deposits--deposits with other banks--instead of balances at the central bank. In this case, perhaps the large money center and regional banks would collectively take on the role of providing settlement balances to the providers of e-money. Let's call them the settlement banks. Let us also assume that such settlement balances were convertible into balances held at the central bank, a link that would enhance the acceptability of and confidence in e-money. This hypothetical situation--perhaps one more interesting as an intellectual challenge than as a plausible outcome--forces us to try to understand what the minimum requirements are for an effective monetary policy, defined as one that can maintain control of some short-term interest rate. Michael Woodford (2001) considers this problem (or at least a closely related problem) in a paper presented at the most recent Federal Reserve Bank of Kansas City Jackson Hole conference. He convincingly argues that monetary policy could still maintain control over interest rates--provided that the central bank can pay interest on the deposit balances it offers. The central bank can conduct monetary policy in this case by setting an interest rate on balances held at the central bank. Banks cannot pay a rate on interbank deposits lower than the rate offered on the balances banks could hold at the central bank. Otherwise, banks would convert their interbank deposits into central bank balances. Banks have no incentive to offer a rate on interbank deposits higher than the rate offered by the central bank because they would experience a loss as other banks give them low-yielding central bank liabilities in exchange for their high-rate interbank deposits. The minimum requirement for an effective monetary policy is, therefore, the ability of the central bank to set an interest rate on balances held by banks with the central bank. Woodford does not address the possibility that banks might not have a positive demand for central bank balances. Even in this case, the availability of central bank balances and credit at an interest rate set by the central bank would, in my view, effectively control the interest rate on interbank deposits and therefore continue to allow the central bank to conduct monetary policy. The availability of balances at and borrowing from the central banks would limit and effectively control the rates that settlement banks paid on their interbank deposits. Charles Freedman (2000b) makes a strong case that the possibility that banks would prefer to use interbank deposits for clearing purposes rather than central bank money is far-fetched. Central bank money has some unique properties that likely ensure it a comparative advantage relative to interbank deposits. First, central bank balances carry no default risk. No private bank or other financial firm can match this. Second, central banks typically provide access to liquidity through a discount window or other standing facility, especially important in the event of a serious liquidity problem. Banks may want to maintain a clearing account at the central bank to obtain funds quickly and conveniently from the discount window. Third, banks have a long tradition of holding reserve (settlement) balances at central banks. Therefore, the spread of e-money is unlikely to reduce the demand for reserve balances at the central bank to such an extent that the central bank could not conduct monetary policy by controlling an overnight interest rate. First, e-money that substitutes for bank deposits could be subject to a reserve requirement. Second, even if these deposits were not reservable or if reserve requirements were eliminated, banks would most likely continue to hold clearing balances with the central bank. In this case, a system of floors and ceilings, as described above, complemented by open market operations, should ensure the continued effectiveness of monetary policy. E-Money and the Reintroduction of Private Money: Is the Fed Obsolete? This leaves one last interesting set of issues to explore. Could e-money issuers successfully introduce new monetary standards-independent of the dollar-and either compete with the Federal Reserve as central banks, or operate without a central bank? Alternatively, what if the Federal Reserve were privatized, its role taken by a successful issuer of e-money? After all, the United States has not always had a central bank. Before 1914, private firms managed many of the activities now handled by the Federal Reserve. Thus, one can at least imagine a world in which central banking, to the extent there is such a thing, is in private hands. The result, in any of these very speculative cases, would clearly be that the factors shaping monetary policy and the determination of the price level would be greatly changed. Consider first the possibility that privately produced e-money replaced the Federal Reserve's monetary base, and allowed the establishment of several competing private central banks, each with its own money (say, red dollars, blue dollars, and yellow dollars). Of course, legal tender laws linked to government-issued currency make such a development very unlikely. Still, if a private bank were somehow able to establish its currency as a fiat currency (that is, without making it convertible into Fed dollars or some other asset), then its monetary policy over time would determine the value of its currency, interest rates on its currency and its inflation rate. If competing banks provided their own currencies, there would be multiple price levels, depending on the currency, and a number of cross exchange rates. But such an outcome would be extremely inefficient and is therefore hard to imagine as the ultimate outcome. Indeed, the euro area is going the other way to avoid the costs of dealing with multiple currencies. Though technology may reduce the costs of handling multiple currencies and prices, we are not at the point where the costs of doing so are negligible. Alternatively, the private money issuers might adopt a commodity standard, so that one could transact business with money backed by gold or other commodities, for example. In that case, the price level in each currency would reflect the relative price of the commodity chosen by the respective issuer. Some, like Lawrence White (1992), argue that free entry into the business of providing media of exchange tied to a commodity standard can lead to good outcomes even without a central bank, as he argues was the case in Scotland in the eighteenth century and first half of the nineteenth century. But that outcome may have depended on some special factors (including the unlimited liability of banks' shareholders). In the current environment, some issuers of private money would, from time to time, likely fail to be able to redeem the money in the underlying commodity. Moreover, it is not clear that the private issuers would have the appropriate incentives to hold capital and act as lender of last resort in a crisis. Indeed, as I noted earlier, central banks, at least in developed economies, issue currency and provide clearing services, at least in part, because their services offer features, such as freedom from default risk and finality of settlement, that private providers cannot match. What about a private institution taking over the (monopoly) role of the Fed (with the Fed disappearing)? Or, equivalently, the privatization of the Fed? In that case, the overall price level would be the result of the monetary policy chosen by the firm running the private central bank. It is not clear that a private monopoly central bank has the incentives to produce good monetary policy. Indeed, given the externalities involved, it seems plausible that a monopoly central bank that issued fiat money would not respond optimally to crises (it would charge too much for liquidity) or to cyclical variations (it would be maximizing the present discounted value of its seigniorage income rather than minimizing some weighted sum of discounted inflation and output losses). If the private central bank were to adopt a commodity standard, then its actions would be constrained and might lead to stable prices over the longer term, subject to all the limitations of the gold standard discussed earlier. But the central bank's incentives in terms of serving as a lender of last resort and holding capital and reserves would presumably still be wrong because of macro externalities that it would not take into account. Ultimately, it is essential, in my view, to require the central bank to act in the national interest and not as a profit-maximizing firm and that the government back it in a crisis to ensure that it has the ability to take any required actions without being constrained by its own financial resources. Conclusion The evolution of money is clearly a dynamic and on-going process, driven by the incentive to improve the efficiency of exchange. Even today, after a long historical process of evolution, we are left with a payment system that is very costly to operate, requiring tons of paper checks to be flown around the country and reunited with the person or firm that wrote the check in the first place. It seems inevitable that further evolution lies ahead. The spread of computers, advances in telecommunications, and the dramatic growth in the use of the Internet point to innovations in e-money. These will ultimately reshape the payment system and, along the way, present challenges to the Federal Reserve and monetary policy. Given the slow pace of progress and the strong likelihood that stored-value cards will substitute only for a portion of currency, there is little danger that the Fed's portfolio will shrink to the point at which the Fed will be unable to cover its costs of operation. The spread of network money, on the other hand, might not reduce the demand for reserves, if network money is subject to reserve requirements. In the absence of reserve requirements against network money, it is still likely that central bank balances would dominate settlement balances at private banks, given the former's lack of default risk. In this case, a system featuring floors and ceilings appears well designed to allow the Fed to continue to implement monetary policy by controlling the federal funds rate.
Appendix 1: Innovations in Retail Payment Systems
Important advances have been made in improving the efficiency of retail payment systems. For example, check collection costs may be lowered by the use of check truncation. In this case, a paper check is stopped - "truncated" - at some point in the processing cycle, but information continues to flow. Typically today, the truncation of the check occurs at the paying bank and the check is not returned to the check writer. Credit unions have been handling checks in this manner since the late 1970s. The earlier the paper flow is stopped, the greater the proportion of costs saved. For instance, cost savings can be greater when one bank in the check collection chain transmits information electronically to the paying bank. The payee's bank or an intermediary such as the Fed reads the information on a check and presents that information electronically to the paying bank. This form of truncation can be supported by the use of imaging technology that allows the digital check images to be captured and archived and used for information purposes or, perhaps, used in lieu of the original check. These images may then be returned to the check writer. Currently, this arrangement must be agreed upon by the parties to the check, which may include all banks in the stream of collection, and the check writer. The Federal Reserve Board is developing a draft law that would facilitate check truncation by removing several existing legal impediments to the use of electronics in check processing. Another form of truncation occurs at the point of sale, where the check is written. In this approach, a customer's check is scanned, converted into an electronic payment, and handed back to the customer. In this case, the payer's check is used as a source document from which to create an electronic payment. Truncation and imaging can potentially improve the efficiency of clearing paper checks. In addition, existing electronic funds transfer systems--ACH, debit cards, Fedwire, and CHIPS--have already substituted electronic transfers for paper checks for many transactions. The recent Federal Reserve study of retail payments found that Americans' use of credit cards, debit cards, and other electronic payments have been gaining relative to their use of checks. For example, from 1979 to 2000, while the number of checks written per year increased by 53 percent (or a 2½ percent compound annual growth rate), electronic payments increased by 500 percent (or an 8 percent compound annual growth rate). As a result, electronic payments accounted for roughly 40 percent of all retail payments other than cash in the United States in 2000 up from 15 percent in 1979. Credit card transactions today account for about half the electronic retail payments, and debit cards account for a little more than a quarter, and the remainder is primarily ACH payments. These trends are expected to continue. As part of this movement to electronic payments, the federal government encourages recipients to receive benefit payments electronically, and an increasing number of taxpayers are filing electronically. The Debt Collection Improvement Act of 1996 required that most Federal payments, except for tax refunds, were to be made electronically by 1999. While the "requirement" has been eliminated, in Fiscal Year 2001, 32.6 percent of federal tax payments were made electronically, and approximately 76 percent of all other Treasury disbursements were made electronically, representing more than 900 million payments. Today, the Federal Reserve operates an extensive check clearing system and an electronic automated clearinghouse (ACH) system, alongside and in competition with private check and electronic clearinghouses. Daily the Reserve Banks receive more than 50 million checks, which they sort on high-speed machines and route to paying banks in the local area and throughout the country. The Fed's check-processing operations also electronically capture payment data on all the checks and create digital images of many of the checks. ACH payment instructions flow from one bank computer to another via Federal Reserve computers. The value of these check and ACH payments are settled between banks on the Fed's books. Questions have been raised over the years about the rationale for a direct role for the Federal Reserve in the retail payment system. In 1996 and 1997, a Federal Reserve study group, under the direction of Alice Rivlin, who was then Vice Chair, considered the future role of the Fed in retail payments. After extensive discussions with banking industry representatives, the group concluded that the Federal Reserve should continue to provide check-clearing and ACH services and, at the same time, work with the private sector to encourage payment system innovations.
Appendix 2: Electronic Payment Systems
E-money is not the only potential type of electronic money. There are already important electronic elements of the payments system that have been operating since the 1970s. One is the automated clearinghouse (ACH) through which retail payments can be made electronically. This system is used primarily for pre-authorized recurring payments, such as payroll, corporate payments to vendors, social security benefits, insurance premiums, and utility payments. More recently, its use has expanded to include processing one-time payments, such as the checks that merchants truncate at the point-of-sale or, occasionally, as "e-checks" for Internet transactions. In 2000, the ACH system processed 6.9 billion transactions with a total value of $20.3 trillion. Two other electronic elements of the retail payments system are the debit card and automated teller machine (ATM) networks. The use of debit cards with personal identification numbers (PINs) for making consumer purchases is growing, and the use of signature-based cards sponsored by the major credit card companies has grown even more rapidly during the past decade. In 2000, there were approximately 3 billion PIN-based debit transactions with a total value of $138.2 billion and 5.3 billion signature-based debit transactions with a total value of approximately $210 billion. Credit cards, the largest share of electronic payments, have both a payment function and a credit function. Credit card payments represent approximately 50 percent of electronic payments. In 2000, there were approximately 15 billion credit card transactions with a total value of approximately $1.23 trillion. Large dollar, or wholesale, payments are processed electronically through either the Fed's Fedwire system or the private sector's Clearing House Interbank Payment System (CHIPS). Fedwire is available to depository institutions that have accounts with Federal Reserve Banks. It is used by about 9,000 depository institutions to make electronic funds transfers, on their own behalf or on behalf of their customers. Fedwire is especially useful for large-value and time-sensitive payments, such as payments for interbank settlement of purchases or sales of federal funds (borrowing and lending of reserves among banks), purchases and sales of securities, distribution or repayment of loans, and settlement of real estate transactions. The Federal Reserve began operating Fedwire through the nation's telegraph system in 1918 as an underpinning of the national money markets. In 2000, Fedwire, which has long-since become fully electronic, processed 108 million funds transfers, with a total value of $380 trillion and an average of $3.5 million per transaction. Also in 2000, CHIPS processed 45 million funds transfers with a value of $237 trillion and an average transaction value of $5.3 trillion.
XXX . V000000 Accuracy, precision & resolution on Electronic equipment
Quantities can't be determined with absolute certainty. Measurement tools and systems have always some tolerance and disturbances that will introduce a degree of uncertainty. In addition, also the distinctiveness is a limiting factor.
The following terminology are often used in relation to the measurement uncertainty:
Accuracy: The error between the real and measured value.
Precision: The random spread of measured values around the average measured values.
Resolution: The smallest to be distinguished magnitude from the measured value.
In practice these terms are often confused. This article discusses these concepts.
Measurement uncertainty
Measurement uncertainties can be divided into systematic and random measurement errors. The systematic errors are caused by abnormalities in gain and zero settings of the measuring equipment and tools. The random errors caused by noise and induced voltages and/or currents.
Definition accuracy and precision
Often the concepts accuracy and precision are used interchangeably; they are regarded as synonymous. These two terms, however, have an entirely different meaning. The accuracy indicates how close the measured value is from its actual value, i.e. the deviation between the measured and actual values. Precision refers to the random spread of the measured values. Fig. 1: Definitions uncertainties. On the left a series of measurements. On the right the values are plotted in a histogram.When a number of measurements is done to a stable voltage or other parameter, the measured values will show a certain variation. This is caused by thermal noise in the measuring circuit of the measuring equipment and the measurement set-up. The left graph in Figure 1 shows these variations.
Histogram
The measured values can be plotted in a histogram as shown in Figure 1. The histogram shows how often a measured value occurs. The highest point of the histogram, this is the measured value that has been most frequently measured, indicates the mean value. This is indicated by the blue line in both graphs. The black line represents the real value of the parameter. The difference between the average measured value and real value is the accuracy. The width of the histogram indicates the spread of individual measurements. This distribution of measurements is called accuracy.
Use the correct definition
Accuracy and precision thus have a different meaning. It is therefore quite possible that a measurement is very precise but not accurate. Or conversely, a very accurate measurement, but not precise. In general, a measurement is considered valid if both the measurement is precise as well accurate.
Accuracy
Accuracy is an indication of the correctness of a measurement. Because at a single measurement the precision affects also the accuracy, an average of a series of measurements will be taken.
The uncertainty of measuring instruments is usually given by two values: uncertainty of reading and uncertainty over the full scale. These two specifications together determine the total measurement uncertainty. These values for the measurement uncertainty is specified in percent or in ppm (parts per million) relative to the current national standard. 1 % corresponds to 10000 ppm.
The specified uncertainty is quoted for specified temperature ranges and for certain time period after calibration. Please also note that at different ranges other uncertainties may apply. Fig. 2: Uncertainty of 5 % reading and a read value of 70 V.
Uncertainty relative to reading
An indication of a percentage deviation without further specification also refers to the reading. Tolerances of voltage dividers, the exact gain and absolute deviation of the readout and digitization cause this inaccuracy.
A voltmeter which reads 70,00 V and has a "±5 % reading" specification, will have an uncertainty of 3,5 V (5 % of 70 V) above and below. The actual voltage will be between 66,5 en 73,5 volt.
Fig. 3: Uncertainty of 3 % full scale in the 100 V range.
Uncertainty relative to full scale
This type of inaccuracy is caused by offset errors and linearity errors of amplifiers. And with instruments that digitizes signals, by the non-linearity of the conversion and the uncertainty in AD converters. This specification refers to the full-scale range that is used.
A voltmeter may have a specification "3 % full scale". If during a measurement the 100 V range is selected (= full scale), then the uncertainty is 3 % of 100 V = 3 V regardless of the voltage measured. If the readout in this range 70 V, then the real voltage is between 67 and 73 volts.
Figure 3 makes clear that this type of tolerance is independent of the reading. Would a value of 0 V being read; in this case would the voltage in reality between -3 and +3 volts.
Full scale uncertainty in digits
Often give digital multimeters the full-scale uncertainty in digits instead of a percentage value.
A digital multimeter with a 3½ digit display (range -1999 t / m 1999), the specification can read "+ 2 digits". This means that the uncertainty of the display is 2 units. For example: if a 20 volt range is chosen (± 19.99), than the full scale uncertainty is ±0.02 V. The display shows a value of 10.00 than the actual value shall be between 9.98 and 10.02 volts. Fig. 4: Total uncertainty of 5 % reading and 3 % full-scale on a 100 V range and a reading of 70 V.
Calculation of measurement uncertainty
The specification of the tolerance of the reading and the full scale together determine the total measurement uncertainty of an instrument. In the following calculation example the same values are used as in the examples above: Accuracy: ±5 % reading (3 % full scale) Range: 100 V, Reading: 70 V The total measurement uncertainty is now calculated as follows: [equ. 1] In this situation, a total uncertainty of 7.5 V up and down. The real value should be between 62.5 and 77.5 volts. Figure 4 shows this graphically.
The percentage uncertainty is the relationship between reading and uncertainty. In the given situation this is: [equ. 2]
Digits
A digital multimeters can hold a specification of "±2.0 % rdg, + 4 digits. This means that 4 digits have to be added to the reading uncertainty of 2 %. As an example again a 3½ digit digital readout. This will read 5.00 V in while the 20 V range is selected. 2 % of the reading would mean an uncertainty of 0.1 V. Add to this the inaccuracy of the digits (= 0.04 V). The total uncertainty is therefore 0.14 V. The real value should be between 4.86 and 5.14 volts.
Cumulative uncertainty
Often only the uncertainty of the measuring instrument is taken into account. But also must be looked after the additional measurement uncertainty of the measurement accessories if these are used. Here are a couple of examples:
Increased uncertainty when using probe 1:10
When a 1:10 is used, not only the measurement uncertainty of the instrument must take into account. Also the input impedance of the used instrument and the resistance of the probe, who make together a voltage divider, shall influence the uncertainty. Fig. 5: A 1:1 probe attached to an oscilloscope.Figure 5 shows schematically an oscilloscope with a 1:1 probe. If we consider this probe as ideal (no series resistance), the voltage applied to the probe is offered directly at the input of the oscilloscope. The measurement uncertainty is now only determined by the tolerances in the attenuator, amplifier and further processing, and is specified by the manufacturer. (The uncertainty is also influenced by the resistance network that forms the internal resistance Ri. This is included in the specified tolerances.)
Fig. 6: A 1:10 probe connected to an oscilloscope introduces an additional uncertainty.Figure 6 shows the same scope, but now a 1:10 probe is connected to the input. This probe has an internal series resistance Rp and together with the input resistance of the oscilloscope Ri will this form a voltage divider. The tolerance of the resistors in the voltage divider will cause it's own uncertainty.
The tolerance of the input resistance of the oscilloscope can be found into the specifications. The tolerance of the series resistance Rp of the probe is not always given. However, the system uncertainty stated by the combination of the oscilloscope probe with a specified type oscilloscope will be known. If the probe is used with another type than the prescribed oscilloscope, the measurement uncertainty is undetermined. This must always be avoided.
Suppose that an oscilloscope has a tolerance of 1.5 % and a 1:10 probe is used with a system uncertainty of 2.5 %. These two specifications can be multiplied together to obtain total reading uncertainty: [equ. 3]
Measuring with a shunt resistor
Fig. 7: Increases of uncertainty when using a shunt resistor.To measure currents an external shunt resistor is often used. The shunt has a certain tolerance that affects the measurement.
The specified tolerance of the shunt resistor refers to the reading uncertainty. To find the total uncertainty, the tolerance of the shunt and the reading uncertainty of the measuring instrument are multiplied together: [equ. 4] In this example, the total reading uncertainty is 3.53 %.
The resistance of the shunt is temperature dependent. The resistance value is specified for a given temperature. The temperature dependence is often expressed in ppm/°C. As an example the calculating of the resistance value at ambient temperature (Tamb) of 30 °C. The shunt has a specification: R=100 Ω @ 22 °C (respectively Rnom & Tnom), and a temperature dependence of 20 ppm/°C. [equ. 5]
The current flowing through the shunt causes dissipation of energy in the shunt and this will result in rising of the temperature and therefore a change in resistance value. The change in resistance value due to the current flow is dependent on several factors. For very accurate measurements the shunt must be calibrated at a flow resistance and environmental conditions in which these will be used.
Precision
The term precision is used to express the random measurement error. The random nature of the deviations of the measured value is mostly of thermal origin. Because of the arbitrary nature of this noise it's not possible to give an absolute error. The precision gives only the probability that the measurement value is between given limits. Fig. 8: Probability distribution for μ=2 en σ=1.
Gaussian distribution
Thermal noise has a Gaussian or normal distribution. This is described by the following equation: [equ. 6]
Here is μ the mean value and σ indicates the degree of dispersion and corresponds to the RMS value of the noise signal. The function provides a probability distribution curve as shown in Figure 8 where the mean value μ 2 is and the effective noise amplitude σ 1.
Tabel 1: Probability Values
Border
Chance
0,5·σ
38.3 %
0,674·σ
50.0 %
1·σ
68.3 %
2·σ
95.4 %
3·σ
99.7 %
Probability table
Table 1 lists some chance values expressed at a certain limit. As seen, the probability that a measured value is within ±3·σ is 99.7 %.
Improving precision
The precision of a measurement can be improved by oversampeling or filtering. The individual measurements are averaged out so that the noise quantity is greatly reduced. The spread of the measured values is hereby also reduced. With oversampling or filtering must be taken into account that this may reduce the bandwidth.
Resolution
The resolution of a measurement system is the smallest yet to distinguish different in values. The specified resolution of an instrument has no relation to the accuracy of measurement.
Digital measuring systems
A digital system converts an analog signal to a digital equivalent with an AD converter. The difference between two values, the resolution, is therefore always equal to one bit. Or in the case of a digital multimeter, this is 1 digit.
It's also possible to express the resolution in other units than bits. As an example a digital oscilloscope which has an 8 bit AD converter. If the vertical sensitivity is set to 100 mV/div and the number of divisions is 8, the total range will be 800 mV. The 8 bits represent 28 = 256 different values. The resolution in volts is then 800 mV / 256 = 3125 mV.
Analog measuring systems
In the case of analog measuring instruments where the measured value is displayed in a mechanical way, such as a moving-coil meter, it's difficult to give an exact number for the resolution. Firstly, the resolution is limited by the mechanical hysteresis caused by friction of the bearings of the needle. On the other hand, resolution is determined by the observer, making this a subjective evaluation.
The case study electronic equipment in E-Money equipment
This ATM Bank Machine helps kids learn to manage money like grown-ups. Just insert your card, type in your secret PIN number and the machine knows your name and how much money you have. Insert coins to make deposits. Make withdrawals too but this smart machine won't let you get overdrawn.
Old technology talk to new technology equipment, costs money
Royalty-Free Stock Photo
Concept of integrating old technology to new, money making opportunities, and also costs money to support. Integration of old technology to talk to new technology equipment.
XXX . V0000 Measuring the Money Supply: Explanation and Examples
the money supply by exploring the components of the money stock. In this lesson, we also look at the money supply in terms of function and liquidity.
Measuring the Amount of Money in Circulation
The money supply is the total quantity of money in the economy at any given time. Economists measure the money supply because it is directly connected to the activity taking place all around us in the economy. In addition, the Federal Reserve's Board of Governors and the Federal Open Market Committee use this information as the basis of their monetary policy. What we're talking about in this lesson is: how do we measure the money supply?
While most people think that money supply is one big pile of cash in the economy, economists look at it very specifically. We can define the money supply in three different ways - M1, M2 and M3. M1 is the narrowest definition of money. M1 consists of coins and currency in circulation, checking accounts and traveler's checks. M2 is a more broad definition of money than M1. M2 = M1 + small savings accounts, money market funds and small time deposits. M3 is even more broad and includes M2 + large time deposits, large money market funds and repurchase agreements, which are financial instruments generally used by large businesses and institutions. Since 2006, the Federal Reserve stopped using M3 - so now we have M1 and M2.
These measures correspond to three definitions of money that the Federal Reserve uses.
Here's a snapshot of the money supply at the end of July 2012. As you can see, M1 consists of around $1 trillion in currency, about $4 billion in traveler's checks and another $1.26 trillion in demand deposits at banks. These three make up M1, which totaled about $2.3 trillion. M2 takes M1 and adds several other things to it. When you add savings accounts, small time deposits and small money market funds, you get a total of about $10 trillion, which economists refer to as M2.
The Money Supply in Terms of Function
A sample snapshot of the money supply for one month
Here's another way to think of these two measures of the money supply.
The money in M1 functions as a medium of exchange. When Bob deposits money into his checking account, this is part of M1. He can withdraw this money at any time and use it to buy stuff.
The money in M2 functions as a store of value. When Margie puts $10,000 into her savings account, for example, she's using the money as a store of value. This money will earn interest and help protect the purchasing power of her initial deposit.
The Money Supply in Terms of Liquidity
Finally, we can look at the money supply in terms of liquidity.
The money in M1 is more liquid than the money in M2, and the money in M2 is more liquid than the money in M3. Liquid means that you can convert something into cash quickly. Since M1 consists of coins and currency, that's already liquid. M1 also includes checking accounts, though. That's easily and quickly convertible to cash.
XXX . V000000 What should the future form of our money be?
Origins of the central bank
The Dutch financier Johan Palmstruch arrived in Stockholm in 1647. Some ten years later, he was granted permission to open a private bank, Stockholms Banco, where he combined two important innovations. The first of these, pioneered by Palmstruch, was to use customer deposits to fund lending. The second utilised Johannes Gutenberg’s invention, the printing press, to print the first European banknotes.
Stockholms Banco was authorised to issue banknotes backed by the copper and silver coins in use at the time. Coins could be deposited at the bank in return for banknotes, and banknotes could be exchanged for copper and silver at the bank. The banknotes proved to be popular and were soon in circulation.
Stockholm Banco also offered loans in the form of banknotes. For the Swedish king, Karl Gustav, this occurred at a convenient time. Wars were in progress that had to be financed, and a bank that would offer loans was like manna from heaven. King Karl Gustav made good use of the money. Sweden’s victory over Denmark-Norway in the 1658 Dano-Swedish War, leading to the permanent cession to Sweden of the strategically and historically important territory of Båhuslen in southeastern Norway, was thus at least partly the result of a financial innovation.
Things did not end well for Johan Palmstruch. There were no rules to limit the loans that could be issued by the bank, and Stockholms Banco’s loans far outstripped the value of the copper and silver held by the bank. Confidence in the banknotes began to evaporate, and their value fell. Demand to redeem the banknotes for copper and silver was high, but Stockholms Banco did not have enough metal to meet the demand, and Sweden experienced its first banking crisis. The bank was declared bankrupt and was liquidated. Johan Palmstruch was sentenced to death for irresponsible accounting. The death sentence was subsequently commuted, but Palmstruch had to spend the rest of his life in prison.
Nonetheless, the Stockholms Banco crisis left a permanent legacy: in 1668, the authority to conduct banking operations was transferred to a bank that was later to become the Riksbank, under the direct control of the Swedish parliament, Riksdagen.[1] The world’s first central bank was born.[2]
What is money?
So what is money exactly? The simple answer is that money is a means of payment. It is also a universally recognised common unit of account. Money has therefore a key role in all financial transactions – it is a practical means of assigning value to goods and services and of settling trades.
To perform these functions, money must have a fairly stable value. People will only accept money as payment if they believe it can be used again as a method of payment in the future. Money must therefore also function as a store of value.
The first coins to be struck, imprinted with the king’s mark as a guarantee of their weight, were produced in Lydia almost 2500 years ago – with the reverse bearing the mark of King Croesus. Since then, coins in a variety of metals have been widely used. The currency of Norway was directly linked to a metal for centuries, until the gold standard was abandoned in 1931.
Wealth in the form of silver and gold coins can – literally – be a heavy burden. The emergence of banknotes that could be exchanged for a specific monetary value in metal made it easier to manage large sums of money. A banknote is in reality a promissory note – an interest-free claim on the issuer. Its value depends on trust that the issuer will keep his word and that the banknote proves to have the promised value.
The issue of banknotes by private entities was a fundamentally unstable system. The solution was to establish central banks in order to build abiding trust in the currency. The Swedish central bank, the Riksbank, the first central bank in history, was founded because the issue of banknotes by a private bank – Stockholms Banco – led to a banking crisis. The origins of the US Federal Reserve are similar: during the so-called “free banking” era, private banks could issue their own banknotes in various denominations. However, the banks experienced repeated crises, and in 1913, the Federal Reserve was established to stabilise the private banking system.
In the post-war years, the value of western currencies was pegged to gold under the Bretton Woods system: an ounce of gold was worth USD 35. All the other member countries – including Norway – agreed to peg their currencies at a fixed rate to the US dollar. The gold standard was abandoned by President Nixon during the Vietnam War, and the traditional fixed exchange rate system was terminated in 1971.
The value of money is no longer linked to precious metals. Today, money is so-called fiat money. The term derives from the Latin “fiat”, meaning “let it become”.
In his book Sapiens – A Brief History of Humankind, Yuval Noah Harari writes: “Trust is the raw material from which all types of money are minted”.
And he goes on:
“..., the fact that another person believes in cowry shells, or dollars, or electronic data, is enough to strengthen our own belief in them, […]. Christians and Muslims who could not agree on religious beliefs could nevertheless agree on a monetary belief, because whereas religion asks us to believe in something, money asks us to believe that other people believe in something.”[3]
Money has value because – and only because – everyone believes in its value. Money is minted from trust.
But how is this possible? How can money retain stable value in a system exclusively based on belief and trust?
First, money must be usable. This is the domain of the authorities. All taxes in Norway must be paid in Norwegian kroner. The governments of most countries have defined the country’s banknotes and coins as legal tender. This means that a buyer is entitled to make a payment in the country’s currency, and a seller can require payment in this currency. Legal tender cannot be refused as payment by either party.[4] Buyer and seller can of course agree on a different method of payment if they so wish.
Second, trust is related to the role of the central bank. In most countries, it is taken as a matter of course that the central bank guarantees the value of the currency. The central bank is subject to democratic control. In Norway, Article 75 of the Constitution states that “It devolves upon the Storting [Norwegian parliament]… to supervise the monetary system of the realm”. At the same time, the people’s elected representatives have conferred independence on the central bank in the use of its instruments by means of the Norges Bank Act. This underpins trust in the central bank and ensures the democratic legitimacy of the system.
For Norway’s founding fathers, another important objective was to ensure that the king and his government did not have direct access to the banknote printing press. Past experience had shown that kings were not immune to temptation.
The stability of the value of the currency in Norway is guaranteed by Norges Bank, and ultimately by the Norwegian government. The authorities have delegated this task to Norges Bank and decided that the Bank’s monetary policy objective is to keep inflation low and stable. The inflation target is quantified in the regulation on monetary policy as annual consumer price inflation over time of close to 2.5 percent. The Bank’s policy instrument is the key policy rate. Confidence that inflation will be kept low and stable is underpinned by the central bank’s independence. Norges Bank has a clear mandate and an independent position. This fosters trust in the Bank’s ability to do its job.
But a regulation defining the inflation target and central bank independence are not enough. Confidence in the inflation target can only be upheld if the central bank actually ensures that inflation is low and stable over time, thereby maintaining monetary stability. Credibility and trust are built up over time. In Norway, inflation has been low and stable for a quarter of a century. As the expression goes, the proof of the pudding is in the eating.
How is money created?
Today, there are two forms of central bank money. One of the forms is common knowledge – banknotes and coins. The other, bank reserves at Norges Bank, is less well known. The sum total of banknotes and coins and bank reserves at Norges Bank is about NOK 85 billion.[5] But the total money supply is much larger than this. Customer deposits in banks are also money. These deposits, referred to as deposit money, total more than NOK 2 trillion in Norway. This money is created by banks, not by Norges Bank. Chart 1: Money supply and cash
Chart 1 shows the money supply and the supply of banknotes and coins in Norway since 1960. In Norway, the money supply mainly comprises deposit money in banks.[6] In the early 1960s, banknotes and coins accounted for a fifth of the money supply. Current accounts and cheques were already becoming commonplace. Since then, banks’ deposit money has increased dramatically, and today, banknotes and coins make up less than 2.5 percent of the money supply. In other words, virtually all the money we use has been created by banks.
So how do banks create money? The answer to that question comes as quite a surprise to most people.
When you borrow from a bank, the bank credits your bank account. The deposit – the money – is created by the bank the moment it issues the loan. The bank does not transfer the money from someone else’s bank account or from a vault full of money. The money lent to you by the bank has been created by the bank itself – out of nothing: fiat – let it become.
The money created by the bank does not disappear when it leaves your account. If you use it to make a payment, it is just transferred to the recipient’s account. The money is only removed from circulation when someone uses their deposits to repay a bank, as when we make a loan repayment.[7] The money supply is therefore only reduced when banks’ claims on the rest of the economy decrease.
Banks also fund lending by raising loans themselves instead of creating money in the form of deposits. In order to reduce risk, banks also use other forms of investment in addition to lending.[8] Nevertheless, the money supply is growing at almost at the same pace as total bank credit.
To sum up: banks create money out of nothing and withdraw it when loans are repaid. Growth in total bank credit is normally matched by growth in the money supply.[9]
This does not sound encouraging. Is money an illusion? Why is today’s privately issued deposit money often perceived to be as safe as money issued by the central bank?
First and foremost, maintaining confidence that the deposits are safe is the responsibility of the banks. If a bank takes on too much risk, trust in that bank will be impaired. For trust to be maintained, it is essential that a bank operates responsibly.
Customer deposits in Norway are also covered by a deposit guarantee. For customers with accounts in Norwegian banks, the guarantee covers deposits of up to NOK 2 million per depositor per bank. This guarantee is provided by the Norwegian Banks’ Guarantee Fund, a joint deposit insurance scheme funded by Norwegian banks.
Nonetheless, probably the most important factor is that the banking sector is one of the most highly regulated sectors in society and is subject to strict supervision. A bank cannot operate without a licence, and banks are required to satisfy a number of requirements relating to capital adequacy and liquidity management, all of which limit bank lending and money creation. Norwegian banks cannot behave as Stockholms Banco did in the 1600s. By ensuring that banks are solid and sufficiently liquid, regulation and supervision also underpin trust in the money we use.
The financial crisis in autumn 2008 was triggered by the collapse of an under-regulated financial institution – the Lehman Brothers investment bank.[10] In the years preceding the crisis, Lehman’s equity was less than two percent of its assets. With so little capital supporting loans, it does not take more than a puff of wind to bring down a house of cards.
New forms of payment and new forms of money
Trust is necessary, though not sufficient, for money to function as a universal means of payment. It must also be efficient and safe to use.
When you make a payment in a shop using a bank card, one of the largest systems we have is set in motion. Payments move back and forth between banks. Banks settle the payments by transferring money between their accounts at Norges Bank. Your payment then becomes available in the recipient’s account, normally a few hours after the payment process was initiated.
The hub of the payment system in Norway is Norges Bank’s settlement system, and it is our responsibility to make sure the system is efficient and reliable. Turnover is substantial, and transactions totalling close to NOK 240 billion were settled by Norges Bank in 2016 – every day.
As a society, we are completely dependent on the smooth functioning of the payment system. Without a stable settlement system, it would not be possible to use customer deposits in bank accounts as a means of payment, and substantial resources are allocated, both by banks and by Norges Bank, to make the system as robust and efficient as possible.
Technological innovation continues to bring us new methods of payment. Using smartphone apps such as Vipps and MobilePay, we can now make payments using our mobile phones. Technology giants such as Apple, Samsung and Google are also entering the payment market. Suppliers of goods and services are making their own apps and linking them to bonus and loyalty programmes. Although this may be a positive trend for many people, it comes at a price. It is difficult for us as consumers to keep track of the information we disclose and how it is used. This poses a challenge to data privacy and the security of the payment system.
The apps are only a customer interface. Behind them lie international card schemes such as Visa and Mastercard. Even though users do not cover costs directly, the costs involved in using these schemes are high, making these solutions an expensive alternative for banks. Eventually, banks’ customers foot the bill one way or another.
Cheaper alternatives are on their way. The new solutions could also result in faster payments. National payment card schemes, such as BankAxept in Norway, might provide an alternative to the international card schemes, including access to the new services. New regulations have been introduced to lower the costs related to international cards. A new EU regulation also provides for direct bank-to-bank payments, bypassing the card schemes entirely.
Technological innovation has given us not only new methods of payment, but also new forms of money – so-called e-money. E-money is electronic money issued by non-bank entities, but in existing currencies. Paypal customers can make payments through their Paypal account. Facebook has recently applied for a Europe-wide e-money licence. If large providers offer an attractive, user-friendly solution, this method of payment could become widespread. A key issue related to e-money is the question of consumer trust. E-money is a claim on the issuing company. E-money is not backed by a deposit insurance scheme or any authority.
Other companies are offering new forms of money – often in the form of a new currency – on closed platforms such as social networks and online games. Examples of such platform currencies are Amazon Coins, the virtual currency used in the online game World of Warcraft and Chinese Q Coins. These currencies might seem insignificant, but they have already been used as means of payment outside their own platforms.
A number of private digital currencies have also appeared. Some have gained ground in terms of turnover and use, while others were introduced for purely fraudulent purposes and have rapidly disappeared. The largest and best-known digital currency is Bitcoin, which was launched in 2009. Bitcoin has been the subject of widespread debate, but still has only a minor role in the payment system. Payment by Bitcoin is costly, and the system’s capacity is limited. Bitcoin prices have been highly volatile. A characteristic of private currencies such as bitcoin is the absence of any central institution backing the currency. But this is also a problem, making it difficult to establish the trust necessary for a widespread adoption of these currencies.
Cybercrime
New technology and new forms of payment are raising fundamental questions related to the security of the payment system. Cybercrime is evolving rapidly, with cyberattacks becoming increasingly advanced and well-organised.
Central banks are also targeted. In February last year, an attempt was made to steal USD 950 million from the central bank of Bangladesh. Most of the payments were stopped, but in the course of 48 hours, USD 81 million had found its way to a bank in the Philippines. A few days later, more than USD 60 million had disappeared through Philippine casinos. As far as I know, the money trail stopped there.
All the institutions involved in our payment system are devoting increasing resources to prevent cyberattacks, from banks and Norges Bank to our security authorities. However, we can never be completely certain that the system will be able to resist all possible attacks. We can lose money too. Ultimately, there may come a time when our systems have to be shut down for a period.
We need to be prepared for a situation where the payment system – or parts of it – has to be shut down for a period. Contingency arrangements must provide protection against a wide range of incidents, not just cyberattacks. These arrangements primarily comprise a number of reserve solutions in our electronic systems. Our ultimate contingency and reserve solution is our banknotes and coins. This part of our contingency arrangements must be strengthened. On the advice of Norges Bank and Finanstilsynet (Financial Supervisory Authority of Norway), the Ministry of Finance recently circulated a consultation paper proposing a regulation to ensure the availability of cash in a contingency.
What should the future form of money be?
The role of banknotes and coins, which have been our central bank money since Norges Bank was founded a little more than 200 years ago, continues to diminish. Everyday payments are increasingly made using deposit money in bank accounts. New forms of payment are a new stage of this trend. This prompts the following question: what should the future form of money be?
There are perhaps some who believe that deposit money will ultimately become the sole means of payment. Because Norwegian banks are well-run and well-capitalised, and because customer deposits are covered by the deposit guarantee scheme, we trust deposit money. As long as this is the case, using deposit money will be cheap and efficient for the consumer. But is it entirely unproblematic?
Imagine an ordinary consumer, let’s call him Ola, in a future when cash is no longer in frequent use. Ola hasn’t been to a bank for many years. He hasn’t used cash for a long time. He pays for everything digitally. But now he’s worried. Over the past few weeks, there have been several major cyberattacks against the bank he uses. The bank’s systems have been down for hours at a time, and staff are working overtime to fix the problem.
Ola decides he wants his money.
He logs on to his online bank, which for the time being is still open. He considers his options: he could transfer his money to an account in another bank. Or he could transfer money to a pre-paid card. But Ola does not trust either option. Who is really behind these solutions? How safe are they now?
Ola decides he wants cash and contacts his bank. But the bank cannot meet his request as it is currently unable to provide Norwegian banknotes. Ola faces the same options as before: use an account in another bank? or a payment card? The only option that does not involve using another bank account is to buy bitcoins. Ola does not want to do this. Perhaps he is a little stubborn. He wants cash.
The bank clerk is patient. He tells Ola that the bank can offer dollar or euro banknotes. Ola sees no alternative and withdraws euro banknotes. But he soon encounters another problem. In order to use this currency to make purchases in Norway, the shop has to accept payment in euros. If not, Ola will have to deposit the euro banknotes in his bank account in order to make the payment – bringing him back to square one.
What has been lost here? First, Ola has become completely dependent on a third party – the bank: payments can no longer be made directly between two parties, but must be channelled through a bank, a card company or an app. Today, you can settle a payment at a shop or with a neighbour in cash, without involving anyone else. Second, Ola has become dependent on the technology functioning as it should. Technology is not needed to settle payments in cash – as long as cash is available. Third, Ola is no longer anonymous when he makes a payment. All payment transactions using deposit money can be recorded. Anonymous payments are often associated with something negative, such as tax evasion or other criminal activity. But there is another side to anonymity – privacy. We may not be entirely comfortable with the thought that every purchase we make is recorded. It may be too reminiscent of the society described in George Orwell’s 70-year-old novel 1984. Fourth, Ola no longer has access to money directly backed by Norwegian authorities. We no longer have functional legal tender. The monetary system has been turned over to private entities. Alternatively, Ola has to use another country’s currency – in our hypothetical case, the euro.
We have to ask ourselves: should we allow private solutions to compete freely in developing means of payment, or must the authorities play a role?
The crucial factor is whether solutions based on private money deliver the characteristics the payment system should have. The system must be able to channel payments swiftly, safely, at low cost and in a user-friendly manner. The means of payment itself – our money – must be universal, because money is only useful if it is widely used. This requires trust.
Deposit guarantee schemes and banking regulation promote trust. The objective of monetary policy is to maintain stability in the value of the currency. Norges Bank assists private operators in implementing faster and safer payments. We cooperate with other authorities to oversee and supervise the payment infrastructure to ensure robustness and efficiency. Privacy rules prevent unauthorised access to payment information.
But there are some characteristics deposit money lacks. It cannot offer anonymous payments. The system is vulnerable to advanced attacks. Having more money on deposit than is covered by the deposit guarantee scheme involves risk. Nor is direct and immediate settlement between two parties, without the involvement of a third party, possible without cash.
In the future, new payment solutions may be able to offer these possibilities. Private digital currencies providing anonymity are already on the market. These currencies can also be used even if banks’ systems fail – as long as the Internet is still functioning. The same applies to platform currencies and e-money. However, there are other crucial characteristics missing from these solutions – they are not backed by any authority and the level of foreign exchange and credit risk can be high.
One alternative currently being discussed is the introduction of electronic central bank money. There are several ways of achieving this: consumers can have an account either at the central bank itself or in a system controlled by the central bank. Another possible solution is for Norges Bank to issue a payment card or develop an app for consumers to use for anonymous payments.
Which brings us to another question: which means of payment should be the statutory form of legal tender in Norway if we introduce electronic central bank money? Should it be banknotes and coins, or Norges Bank’s electronic money, or both?
We must also ask ourselves what the consequences will be for the banking system. For many consumers, electronic central bank money could provide an alternative to deposit money in a bank, as cash does today. Banks can attract deposits through the interest rates they offer. But their ability to create money and extend credit could nonetheless be affected, especially if this new form of electronic money enters into widespread use.
Norges Bank has begun the work of assessing what the future form of money should be. This is a long-term process. Whatever the conclusion, we can be fairly certain that banknotes and coins will be with us for many years yet. Deposit money in banks will most likely continue to be the dominant means of payment, even if electronic central bank money is introduced. Nevertheless, the very fact that these questions are being raised heralds a new era for our monetary system.
Choosing the direction our future monetary system and payment system will take requires not only economists, but also technologists, lawyers and other social scientists. And political decisions will ultimately need to be made by our elected representatives. It devolves upon the Storting to supervise the monetary system of the realm.
The questions are numerous, but we already have one of the answers. Central banks were established to build confidence in the monetary system. That is still our primary task. We cannot leave the monetary system entirely in the hands of private entities. There will be a role for central bank money. We must have a legislative framework and a means of payment backed by the authorities to ensure trust in our money
XXX . V0000000 Time Value of Money Terminology
Terminology can be a major impediment to understanding the concepts of finance. Fortunately, the vocabulary of time value of money concepts is pretty straightforward. Here are the basic definitions that you will need to understand to get started (calculator key abbreviations are in parentheses where appropriate):
Types of Cash Flow Streams
Annuity
An annuity is a series of equal cash flows paid at equal time intervals for a finite number of periods. A lease that calls for payments of $1000 each month for a year would be referred to as a “12-period, $1000 annuity.” Note that, strictly speaking, in order for a series of cash flows to be considered an annuity, each cash flow must be identical and the amount of time between each cash flow must be the same in all cases. There are two types of annuities that vary only in the timing of the first cash flow:
Regular Annuity – The first payment is made one period in the future (at period 1).
Annuity Due – The first payment is made immediately (at period 0).
Graduated Annuity
A graduated annuity (also called a growing annuity) is a series of cash flows that increases over time at a constant rate for a finite number of periods. A common example of a graduated annuity would be a lottery payout. A lottery winner (e.g., Powerball) may opt to receive their winnings as a series of 30 annual payments (the first payment is immediate, and there are 29 additional annual payments). In the case of Powerball, each payment will be 4% greater than the previous payment. Note that, strictly speaking, a graduated annuity requires that the growth rate of the payments be constant for the life of the annuity.
Lump Sum
A lump sum is a single cash flow. For example, an investment that is expected to pay $100 one year from now would have a “lump sum payment” of $100.
Perpetuity
A perpetuity is simply a type of annuity that has an infinite life. In other words, it is a “perpetual annuity.”
Uneven Cash Flow Stream
Any series of cash flows that doesn’t conform to the definition of an annuity is considered to be an uneven cash flow stream. For example, a series such as: $100, $100, $100, $200, $200, $200 would be considered an uneven cash flow stream. However, you might also note that it is also a series of two consecutive annuities (a 3-period $100 annuity followed by a 3-period $200 annuity). For help with valuing such cash flows, please choose your calculator from the navigation links on the left.
Other TVM Definitions
Amortization Schedule
An amortization schedule is a table that shows each loan payment over the life of a loan, and a breakdown of the amount of interest and principal paid. Typically, it will also show the remaining balance after each payment has been made.
Cash Flow Sign Convention
This convention, used by financial calculators and spreadsheet functions, specifies that the sign (i.e., positive or negative numbers) indicates the direction of the cash flow. Cash inflows are entered as positive numbers, and cash outflows are entered as negative numbers. Failure to properly adhere to this convention will usually result in incorrect answers from your calculator or spreadsheet. Please note that whether a cash flow is an inflow (+) or outflow (-) depends on the part that you play in a transaction. For example, loan payments are an outflow (-) for the borrower, but an inflow (+) for the lender.
Principle of Value Additivity
This fundamental principle states that the present value (future value) of a series of cash flows is the sum of the present value (future value) of each of the individual cash flows. For example, we can calculate the present value of an annuity by using a single formula, or by calculating the present value of each individual cash flow and then adding them together. This principle is very often useful for simplifying the calculation of the present or future value of uneven cash flow streams, particularly if the cash flows follow some identifiable pattern (such as several consecutive annuities).
Rule of 72
A simple rule that can be used to approximate how long it will take a given amount of money to double at a particular interest rate. It can also be used to determine the interest rate that is required to double your money in a particular amount of time. To determine how long it will take to double your money, simply divide 72 by the interest rate (in decimal form). For example, we know that it will take about 7.2 years to double your money at a 10% interest rate (72/10 = 7.2 years). Alternatively, we can see that to double your money in 5 years you would have to earn about 14.40% per year (72/5 = 14.40).
Time Line
A time line is a graphical depiction of the cash flows in a time value of money problem. Drawing a time line can be very helpful in solving a problem as it will help you to keep track of each cash flow and the time that it occurs. The image below shows an example of a time line for an uneven cash flow stream:
Banker's Year
A banker's year is 12 months, each of which contains 30 days. Therefore, there are 360 (not 365) days in a banker's year. This is a convention that goes back to the days when "calculator" and "computer" were job descriptions instead of electronic devices. Using 360 days for a year made calculations easier to do. This convention is still used today in some calculations such as the Bank Discount Rate that is used for discount (money market) securities.
Compound Interest
This refers to the situation where, in future periods, interest is earned not only on the original principal amount, but also on the previously earned interest. This is a very powerful concept that means money can grow at an exponential rate.
Compounding Frequency
This refers to how often interest is credited to the account. Once interest is credited it becomes, in effect, principal. Note that the compounding frequency and the frequency of cash flows are not always the same. In that case, the interest rate is typically adjusted to an effective rate that is of the same periodicity as the cash flows. For example, if we have quarterly cash flows with monthly compounding, we would typically convert the monthly rate into an effective quarterly rate to solve the problem.
Discount Rate
This is the interest rate that is used to convert between future values and present values. Note that the process of calculating present values is often referred to as “discounting” because present values are generally less than future values.
Frequency of Cash Flows
When using the cash flow functions, many financial calculators prompt you for both the cash flow (CFx) and then the frequency (Fx or #Times). The frequency is simple a shortcut to save both time and memory. If a cash flow occurs more than one time in a row, then you would enter the number of times that it occurs (in most cases, you will leave it at 1). The next cash flow that is entered will be the next different cash flow.
Future Value
This term refers to the value of a cash flow (or series of them) at some specific future time. Any cash flow that is scheduled to occur sometime later than today is referred to as a “future value.” Literally translated, future value means “what will it be worth at some future point in time?” For example, if an investment promises to pay $100 one year from now, then the $100 is the future value of the investment because that investment will be worth $100 at that point in time.
Internal Rate of Return
The compound average annual rate of return that is expected to be earned on an investment, assuming that the investment is held for its entire life and that the cash flows are reinvested at the same rate as the IRR. Investments that have an IRR that is greater than or equal to the cost of funds (WACC) should be accepted.
Modified Internal Rate of Return
The compound average annual rate of return that is expected to be earned on an investment, assuming that the investment is held for its entire life and that the cash flows are reinvested at a rate that is different from the IRR. Typically, the reinvestment rate is assumed to be the WACC. Investments that have an MIRR that is greater than or equal to the cost of funds (WACC) should be accepted. Note that the difference between MIRR and IRR is in the assumed reinvestment rate.
Net Present Value
The present value of the future cash flows less the cost of the investment. The NPV is a direct measure of "cost versus benefit." It represents the economic profit to be earned by making an investment. Rational investors will take all investment opportunities that have an expected NPV greater than or equal to zero. If you use Excel (or any other spreadsheet program) you should read my post about the misleading nature of the NPV function.
Number of Periods
The total number of periods is a key variable in all time value of money problems. It is important to distinguish between the number of periods and the number of years. For example, we may refer to a “30-year mortgage.” However, unless the payments are made annually, the number of periods is not 30. Instead, the number of periods would be 360 (= 30 years x 12 months per year). Similarly, we may say that “this bond has 10 years to maturity.” In this case, the number of periods would be 20 (= 10 years x 2 semiannual periods per year) because bonds typically pay interest semiannually.
Payment
The payment is the amount of a cash flow. Typically, payment refers to the amount of the cash flow in an annuity. This is especially true when using financial calculators or spreadsheet functions.
Period
A period is simply a unit of time. Note that, depending on the problem under consideration, the relevant definition of a period can vary. The length of a period is most often defined by the amount of time that passes between cash flows. Most commonly, a period will be a day, a week, a month, a quarter (three months), six months, or a year. In a problem that involves mortgage payments, a period would typically be one month since payments are usually made monthly. However, a problem that involves the valuation of a bond will usually have a period of six months since bond interest payments are typically made every six months (semiannually).
Present Value
This term refers to the current (today’s) value of a series of future cash flows. In other words, it is the amount that you would be willing to pay today in order to receive a cash flow (or a series of them) in the future. Literally translated, present value means “what is it worth right now?”
Required Return
The required return is simply the return that an investor believes he/she needs to earn in order to make an investment in a particular security. It is based on the perceived riskiness of the security, the rate of return available on alternative investments, and the investor's degree of risk aversion. It is likely that two investors looking at the same investment will have different required returns because of their differing risk tolerance. The required return, along with the size and timing of the expected cash flows, determines the value of the investment to the investor. Note that the required return is different from the yield (or promised rate of return), which is a function of the cost of the investment and the cash flows, and not of investor preferences.
TVM
A common abbreviation for "time value of money." This concept is most succinctly described by saying that a dollar today is worth more than a dollar tomorrow.
Money Spent Vs. Conversions EarnedThis is perhaps the simplest goal for marketing experts to define and measure. Is the money spent on the marketing initiative converting leads into paying customers?
Many marketing experts devote a substantial amount of budget to acquisition strategies. Those strategies can include Facebook Ads, Google Adwords, banners, partner affiliations, or email blasts, all of which have an associated cost. Marketing teams must measure how much budget they spend per channel on these initiatives compared to lead conversions. Attribution, or assigning monetary value to acquisition channels and looking into those conversions, can provide valuable insight into whether or not a strategy is effective.
Determining an appropriate lead conversion goal is the first step. Once the target is set, marketers must measure the budget spent against that number. If, for example, the goal is “15% of leads convert into buyers each month”, that goal should be set with the spend in mind. Then, once the initiative concludes, that goal can be measured and evaluated.
The good news is that by using smart data tools, brands can better reach customers where they are, and through the channel that will best catch their attention. They can then enjoy the reward of ensuring, whether through email, web, social, or ads, budget is being spent most effectively to best convert leads .
XXX . V000000000 How to Calculate the Value of Your Early-Stage Startup
Valuing mature companies is a fairly straightforward — albeit somewhat subjective — process. Things like market capitalization and sales multiples give investors a solid foundation from which to work with when determining a company’s valuation. For early-stage startups, however, the process looks quite different.
Without years of financial data to rely on, startups and their investors (angels and venture capitalists) have had to rely on more creative ways to substitute for these inputs. In a nutshell, the process goes back to quantifying a bit of basic finance: ‘risk versus reward’. In startup terminology, it’s: ‘traction versus market size’.
As a startup founder, you will invariably face a time when you need to think about the valuation of your company. Whether you’re pre-revenue, post-revenue, in fundraising mode, or simply granting your employees stock options, you’ll need to have a valuation to operate off of. Of course, in a fundraising setting your valuation will ultimately come down to a negotiation, but it’s worth utilizing some best practices to justify your number and gain as much leverage as possible in these situations.
This article focuses on the steps you should take to calculate a reasonable valuation for your early-stage startup, with some context added that explains why that number becomes so important should you hit the proverbial startup homerun.
Step 1: Perform a Self-Assessment
Make a List of Your Assets
The first thing to consider in formulating a valuation is your balance sheet. List out the assets in possession of the company (less any liabilities). Assets could include, but are not limited to, any of the following:
Proprietary Software
Product
Cash Flow
Patents
Customers/Users
Partnerships
Although you won’t be able to reference the true market value of most of your assets (outside of your cash flow), your list of assets sets you up to be able to look at comparable valuations of other, similarly-equipped startups.
Define “Revenue” (KPI’s)
For many startups, revenue initially serves primarily as market validation. That is, the revenue you earn in the very early days typically isn’t enough to sustain the growth the company needs to see in order to capture the market you want to own in the short-run. So, in addition to (or in place of) revenue, look to identify your key progress indicators (KPI’s) that will help you justify your valuation. This is where you can get a bit creative. Here are some common KPI’s:
user growth rate (monthly or weekly)
customer success rate
referral rate
daily usage statistics
At this point, it’s important to note that if you have little to nothing in the asset column and no KPI’s (i.e. you haven’t launched anything yet), it might be best to go the arbitrary valuation route, like this method from Guy Kawasaki.
Size Up Your Team
A good team can go a long way towards scoring a relatively high valuation. In other words, having solid talent in place is something that investors value highly. The goal of self-analyzing your team is not to necessarily put a number or value on specific personnel, but rather to simply take an honest look at your team on paper.
What experience do your team members have? What have you built together in the past? Have you ever launched or ran a startup company in the past? Do you have domain expertise? Have you had a successful exit? Did you work for a prestigious company or go to an elite school?
All of these things are examples of variables that move the proverbial needle in the minds of those you’ll be negotiating your valuation with: investors. Be prepared to highlight your team in the best light possible. Otherwise, the ‘team’ element could end up as a negative when it comes to your ultimate valuation.
Step 2: Choose a Model
Pre-Revenue
There are many competing approaches to valuing a startup without revenue. I’m going to highlight a few of the most commonly used and well-respected methods by investors.
Berkus Method
Dave Berkus is an active angel investor and lifelong entrepreneur. He came up with the following early-stage valuation model for startups:
If Exists:
Add to Company Value up to:
1. Sound Idea (basic value, product risk)
$1/2 million
2. Prototype (reducing technology risk)
$1/2 million
3. Quality Management Team (reducing execution risk)
$1/2 million
4. Strategic relationships (reducing market risk and competitive risk)
$1/2 million
5. Product Rollout or Sales (reducing financial or production risk)
$1/2 million
Since you’re pre-revenue, the fifth element (financial traction) doesn’t apply. Therefore, the maximum value of your company using this method is $2 million. Based on the factors you’ve considered in Step 1, take your best shot at objectively filling in relative values for the first four elements in order to reach your valuation target.
Risk Factor Summation Method
This model takes a broader approach to valuing your company by breaking the risk down into 12 sub-categories. They are as follows:
management
stage of the business
legislation/political risk
manufacturing risk
sales and marketing risk
funding/capital raising risk
competition risk
technology risk
litigation risk
international risk
reputation risk
potential lucrative exit
Each sub-category of risk is assigned a grade of ++, +, 0 (neutral), -, or --. The scale for scoring each element is:
++ = add $500 thousand
+ = add $250 thousand
0 = do nothing
- = subtract $250 thousand
-- = subtract $500 thousand
Again, you’ll have to do your research (see Additional Resources at the end of this article) to get closer to an objective, relative measure for each component. Use comparables to help you get there, then tally up the results to get your valuation.
Other Methods
To get the best sense of whether your valuation is accurate (or, “sellable”), it’s best to use a few different models and compare results. Here are links to some other popular methods:
If you’ve got a steady cash flow and are generating sustainable revenues, the method you utilize for valuation will look a lot more like the models investors use to value mature companies.
Ideally, you will show investors that your revenue stream reduces the financial risk of the company while increasing the prospect of a ‘big-win’ at the same time. Most investors are looking for a 10 to 20 times return on investment (ROI) opportunity, at least. So, revenue — along with your business model (and things like customer acquisition cost) — should help you demonstrate this possibility.
Follow these steps to calculate a baseline valuation figure:
Calculate your revenue run rate (RRR), which is the most recent month’s sales times 12.
Look at your historical growth curve to calculate monthly, or better yet, your weekly revenue growth rate.* If your revenue correlates to user growth, then use this figure.
Calculate an adjusted RRR based on your growth rate by applying the growth rate to the most recent month’s sales and extrapolating out over the course of a year.
Multiply your adjusted RRR by a factor of ten to put yourself ‘in the ballpark’ of a rational valuation figure.
Further adjustments will undoubtedly be made to your sales multiple based on the factors you considered in Step 1, but this method will give you a reasonable valuation number to work off of. * Note that, in order to use the adjusted RRR, investors will want to see a repeatable, rational sales process. Customer acquisition cost (CAC) becomes extremely important here. The further you can demonstrate that your CAC reduces the risk of you not hitting your adjusted RRR figure, the higher the sales multiple you’ll be in a position to command.
Step 3: Adjust for Reverse Factoring
Pre-Money Valuation Versus Post-Money Valuation
Heading into negotiations with investors, first-time founders need to understand the difference between pre-money valuations and post-money valuations, as well as the implications they each carry with them.
The current pre-money valuation of your company is simply the valuation of your company at the present moment before accepting investment proceeds. It’s the number we’ve focused on in this article because it’s the starting point. When you discuss negotiating a valuation, you’re dealing with the pre-money valuation. As you’ll see, the post-money valuation is a calculation, not a negotiation.
The post-money valuation can be calculated as: pre-money valuation + investment proceeds = post-money valuation.
Why is the post-money valuation so important? There are two primary reasons:
The post-money valuation sets the bar as the current value of the company immediately after receiving funding. This impacts stock option issuance prices as well as the ‘paper-value’ of existing shares held.
Additionally, the post-money valuation dictates how future pre-money valuations will be calculated. If the company continues to grow and hit goals, the next funding round should see a nice cushion between the prior post-money and the new pre-money. If not, you may experience a flat or down round, which isn’t good for you or your investors.
Setting Ownership Targets
Many early-stage investors aim to own a particular percentage of a company with their investment. For example, an investor may want to own 20% of a company with their seed round investment and have an investment range of $250 to $500 thousand per deal.
Using these parameters, you can reverse factor the valuations they typically fund. In this example, the 20% would be based on the post-money valuation. Let’s figure out the range:
Minimum:
$250,000 / (pre-money valuation + $250,000) = 20%
pre-money valuation = $1,000,000
Maximum:
$500,000 / (pre-money valuation + $500,000) = 20%
pre-money valuation = $2,000,000
If you’re outside of an investors’ comfort zone, you may want to adjust your numbers or find another investor.
An Example: Facebook
Facebook made a lot of people a lot of money, including its early-stage investors. Let’s look at one of their first investments as an example of how significant the valuation can be for the companies who achieve soaring success.
In May of 2004, Facebook began serving ads on its site to generate revenue. That year, they generated $382,000 in revenue and raised $500k from Peter Thiel & co. at about a $4.5 million pre-money valuation.
Based on the actual numbers, Peter Thiel paid about 12 times on year-one revenue (partial year) to invest. At the time, it’s likely that the targeted multiple used in structuring the investment was higher than this given the extraordinarily steep nature of the actual growth curve.
That $500 thousand investment yielded about a 10% stake in Facebook at the time of conversion to equity (the financial instrument was a convertible note rather than straight equity). At the time of Facebook’s IPO in 2012, Thiel’s $500 thousand investment was worth about $1,700,000,000.
Doing some quick math, you can see that each percentage point of ownership granted to Thiel at the end of 2004 ended up being worth about $170 million at IPO. Had the pre-money valuation been slightly higher and Thiel’s ownership percentage (and share total) been slightly lower, his overall take would have decreased by some nine digit number. Granted, he would have done fine regardless in this situation — but you get the point.
Keeping Perspective
By now, you should have a solid understanding of both how valuations are typically calculated for startups and why they ultimately matter. At the end of the day, a valuation is any number that your company and your investors agree it should be. That said, it’s best to do your homework before engaging in the negotiation process with a potential investor. Not only will it make you look prepared, it might even give you the extra bit of leverage you need to make the deal work in your favor.
XXX . V000000000 What Is Your Net Worth?
What Is Net Worth?
Your net worth can be an extremely useful tool in measuring your economic status and overall financial progress from year to year. Your net worth is essentially a grand total of all your assets minus your liabilities. In other words, your net worth is the figure you get when you add up everything you own from the value of your home to the cash in your bank account and then subtract from that the value of all of your debts which may include a mortgage, car or student loans, or even credit card balances.
The Theory Behind Calculating Net Worth
Theoretically, your net worth is the value in cash you would have if you were to sell everything you own and paid off all of your debts. In some cases, this number is actually negative, which indicates that you own more in liabilities than in assets. While this is not an ideal situation, it is very common for people just out of college or starting their careers. In that case, your net worth is also a measure of how much debt you would still owe if you emptied your bank accounts and sold everything you own to put towards your debt. Though neither is a realistic scenario, what your net worth measures is more important than the (generally unrealistic) assumptions that are made to get to that number.
In fact, when it comes to your financial health, so to speak, there is no ubiquitous magic net worth number you should be striving for, but you should use your net worth to track your progress from year to year and to hopefully see it improve and grow.
How to Calculate Your Net Worth
Calculating your net worth can be a simple process, but it requires that you gather all the information surrounding your current assets and liabilities. Most financial planners recommend that their clients keep a secure folder with information on all financial assets and liabilities to be updated at least once a year.
Gathering and organizing this information can be a bit of a chore at first, but ensures that you (and anyone else who might need it like your spouse or financial advisor) have access to the information when needed. Though such a folder can be turned into much more, calculating your net worth only requires basic financial information regarding the things you own and the debt that you owe. Here's how to get started:
Calculate Your Assets
Start by listing your largest assets. For most people, this could include the value of their home, any real estate properties, or vehicles like personal cars or boats. In the case of a business owner, this list would also include the value of their business, which has its own more complicated calculation. Make sure you use accurate estimates of market values in current dollars.
Next, you'll want to gather your latest statements for your more liquid assets. These assets include checking and savings accounts, cash, CDs or other investments such as brokerage accounts or retirement accounts.
Finally, consider listing other personal items that may be of value. These could include valuable jewelry, coin collections, musical instruments, etc. You don't need to itemize everything, but you can try to list items that are worth $500 or more.
Now, take all of the assets you have listed in the first three steps and add them together. This number represents your total assets.
Calculate Your Liabilities
Again, start with themajor outstanding liabilities such as the balance on your mortgage or car loans. List these loans and their most current balances.
Next, list all of your personal liabilities such as any balance on your credit cards, student loans, or any other debt you may owe.
Now, add up the balances on all of the liabilities you listed above. This number represents your total liabilities.
Calculate Your Net Worth
To calculate your net worth, simply subtract the total liabilities from the total assets. For this exercise, it doesn't matter how big or how small the number. It doesn't necessarily matter if the number is negative. Your net worth is just a starting point to have something to compare against in the future.
Repeat this process once a year and compare it with the previous year's number. By comparing the two, you can then determine if you are making progress or getting further behind on your goals.
Be conservative with estimates, especially with home and vehicle values. Inflating the value of large assets may look good on paper, but may not paint an accurate picture of your net worth.
XXX . V000000000 Velocity of money
what’s been happening to the supply and demand for money.
These discussions are sometimes conducted in terms of the following equation:
MV = PY.
Here M is a measure of the money supply, V its velocity, and nominal GDP is written as the product of the overall price level (P) with real GDP (Y). We have direct measurements on nominal GDP. And once we agree on a definition of the money supply (no trivial matter), we have a number for M. But where do we come up with data on this concept of the velocity of money, V?
The answer is, we don’t have independent measures of the velocity of money. So if people talk about velocity as something they could measure, they’re just referring to the value of V that makes the above equation true. That is, we measure the velocity of money from
V = PY/M.
As alluded to above, different people come up with different answers for how we should measure the money supply. One measure is M1, whose key components include currency held by the public and checkable deposits. Another measure is the monetary base, which is currency held by both banks and the public plus deposits banks hold in their accounts with the Federal Reserve. So we could use M1 as the value for M in the above equation, and call the resulting value for V the “velocity of M1”. Or we could put the monetary base in for M, and call the resulting V the “velocity of the monetary base”. You get the idea– use your favorite M to get your favorite V. Arnold Kling, for example, proposed that we might use for M the quantity of marbles.
Which perhaps sounds a little silly. Even if there’s no particular relation between the quantity of marbles and the stuff we care about (inflation and real GDP), you could still go ahead and use the equation above to define the velocity of marbles. But what you’d find is that when marbles go up, the marble velocity goes down, and it makes no difference for output or inflation.
OK, so let’s look at the velocity of M1. It turns out to look a lot like you’d expect the velocity of marbles to behave– when M1 goes up, the velocity of M1 goes down by an almost exactly offsetting amount. Here’s an update of a graph that I presented a year ago:
Top panel: annual growth rate of M1, 1980:Q1 to 2010:Q3. Bottom panel: annual growth rate of the ratio of M1 to nominal GDP. Horizontal line in each figure is drawn at the historical average for that series.
So maybe we’d be better off using the monetary base as our value for “M”? I don’t think so.
Top panel: level of monetary base, 1980:Q1 to 2010:Q3. Bottom panel: velocity of base.
Obviously the interest in an equation like MV = PY comes not from using it as a definition of V for some arbitrary choice of M. Instead there must be some kind of behavioral idea, such as that there is some desired value of M1, or monetary base, or marbles, that people want to hold. Suppose it was the case that to a first approximation, this desired quantity was essentially proportional to nominal GDP. If that were true, we would see the graphs of V above behaving roughly as constants instead of simply tracking the inverse of whatever happens to M.
Now, I think it is true that, in normal times, nominal GDP is one of the most important determinants of the demand for M1 or the monetary base. In the absence of other factors changing these demands, there certainly is a connection between money growth and inflation, and you do find a correlation if you look at much longer horizons than the quarterly changes plotted above.
But conditions at the moment are far from normal. In particular, something quite remarkable has happened to the demand for the monetary base. In the current environment, banks have shown themselves to be indifferent between holding reserves (a risk-free way to earn a modest interest rate from the Fed) and making other uses of overnight funds. For this reason, the demand for reserves, and with it the demand for the monetary base, has ballooned without any corresponding changes in output or inflation.
Some people felt I was making a sophistic distinction in emphasizing that the Fed is creating reserves as opposed to printing money ([1], [2]). But I maintain this is a critical distinction. The demand for reserves has increased by a trillion dollars since 2008. The demand for currency held by the public has not. The supply of reserves could therefore increase a trillion dollars without causing inflation. The quantity of currency held by the public could not.
Now, the time will come when banks do see something better to do with these reserves, at which point the Fed will need to take appropriate measures in response, namely a combination of raising the interest rate paid on reserves and selling off some of the assets the Fed has been accumulating. This is of course a key long-term story that we will all be following with interest.
But someone who insists that inflation (P) must go up just because the monetary base (M) has risen may have lost their marbles.
XXX . V0000000000 Globalization of Financial Markets
Even the most cursory review of major international economic trends over the past several decades shows there have been revolutionary changes in world financial markets. During the 1950s and 1960s, financial institutions and their regulatory structures in major industrial countries evolved in relative isolation from external developments. During those years, most countries, including the United States, imposed restrictions on international capital movements. Major international institutional agreements after World War II, such as the Bretton Woods agreement and the General Agreement on Tariffs and Trade, liberalized world trade but did little to free the movement of international capital. After the financial disruptions of the 1930s, many had questioned whether free capital flows and liberalized capital markets were even desirable. In the International Monetary Fund, the basic obligation of member nations—their code of good behavior—was framed exclusively in terms of avoiding restrictions on current account payments: that is, payments for merchandise trade, international services, investment incomes and payments, remittances, and official government transfers. Meanwhile, the rules and the philosophy with respect to capital transactions were far different: many countries restricted outward capital transfers either because they preferred their capital to be invested within their domestic economies or because they wished to prevent downward pressure on their exchange rates.
That situation and those views changed dramatically in the 1970s, and the pace of change accelerated in the 1980s.1 The interaction of several powerful forces has produced massive capital flows across national boundaries. At the same time, the structure and operation of world financial markets have been transformed. Today, world financial markets are highly integrated, and transactions have become increasingly complex. These phenomena are reflected in cross-listing of securities in several countries, cross-country hedging and portfolio diversification, and 24-hour trading in financial instruments at exchanges around the world.
Many of the channels used for financial transactions have also changed. There has been a major shift, relatively, from banks to nonbank financial intermediaries, such as brokerage houses, securities firms, insurance companies, and pension funds. There has also been a shift from loans to securities and a rise in the use of foreign financial centers. In addition, there has been a surge in the use of new financial instruments and, in particular, of derivative products (such as financial options, futures, and swaps on interest rates, foreign currencies, stocks, bonds, and commodities). These instruments have been developed to meet the needs and preferences of different customers, including their desire to hedge risks in an environment of fluctuating exchange rates, interest rates, stock prices, and commodity prices.
The unprecedented changes in world financial markets have had significant implications for public policy and data collection. Because of international capital movements, policies and developments in other countries increasingly influence domestic economic performance. As a consequence, there is a need for information about the new and emerging global financial environment. Yet changes that have taken place in world financial markets themselves compound the difficulty of acquiring the information.
Given the difficulties involved and the budgetary constraints faced by statistical agencies in the public sector, several questions arise: What is the current need for data on international capital transactions? In what ways are current U.S. collection systems adequate or inadequate? Are there conceptual flaws or data defi-
1
A number of significant international financial developments have occurred over the past half century, including the emergence of the Euromarkets in the early 1960s, which circumvented domestic financial regulations. This report focuses on changes in world capital markets associated with financial deregulations in major industrial countries since the late 1970s.
ciencies that should be corrected? Are there alternative ways to gather the data that would be more accurate, more useful, more timely, more technologically advanced, or less burdensome and costly?
THE STUDY AND THE REPORT
With the support of the Bureau of Economic Analysis (BEA) of the U.S. Department of Commerce, the Panel on International Capital Transactions was convened to examine the changes in the global financial environment, assess public and private needs for data on international capital transactions, review the adequacy of existing data, and consider alternative collection methods. Subsequent research grants from the Federal Reserve Board and the U.S. Department of State also supported the study. The panel's goal has been to develop recommendations for the collection of data on U.S. international capital transactions to help ensure that the data are accurate, timely, relevant, cost-effective, and useful for decision making in the years to come.
This study is a follow-on to the one completed by a previous panel of the Committee on National Statistics. That report, Behind the Numbers: U.S. Trade in the World Economy (Kester, 1992), reviewed the adequacy of data on U.S. merchandise trade and international services transactions. It recommended steps to correct the problems of underreporting of U.S. merchandise exports and inadequate coverage of U.S. international services transactions. It also proposed measures to improve monitoring of sales and purchases by U.S. firms at home and abroad, as well as those by foreign firms in the United States. It pointed out that, of all U.S. international transactions (in goods, services, and capital flows), transactions representing capital flows are the least adequately documented. That report concluded that improving the data on U.S. international capital transactions would yield high payoffs, and this report addresses that issue.
Although the changing global trade and financial environment has led several international organizations to undertake initiatives to improve the concepts and methods of compiling international economic statistics, none of the resulting studies focuses specifically on data on U.S. international capital transactions. Nevertheless, improving the quality of U.S. data would have major implications for international financial statistics. Better U.S. data would greatly enhance the usefulness of information on global capital flows because the United States accounts for a large
part of all international transactions. Other countries would also benefit if improved U.S. statistics were available, since U.S. transactions involve many other developed and developing countries, and the statistical problems of the U.S. data are not unique. Refining U.S. data concepts, definitions, and methodologies and harmonizing them with international ones would promote international data comparability. This improvement in comparability, of course, would apply to the data of other countries as well. Data comparability is important not only for international economic policy coordination, but also for data exchanges between the United States and other countries. The panel believes this report will contribute to a better understanding of the global financial flows that have come to characterize the rapidly evolving global economy.
In conducting this study, the panel extensively reviewed existing literature, including recent studies by the International Monetary Fund (1987, 1992b), the Federal Reserve Board (Stekler, 1991; Stekler and Truman, 1992), and the Bank for International Settlements (1986, 1992a, 1992b). It examined the concepts, methods, and procedures that U.S. federal agencies use to collect data on international capital transactions, as well as those used by other industrial countries. It drew on the insights and expertise of many individuals in federal agencies, international organizations, foreign government agencies, businesses, trade associations, and research organizations, including those from the U.S. Department of Commerce, the U.S. Department of the Treasury, and the U.S. Federal Reserve system, as well as the International Monetary Fund, the Bank for International Settlements, the Bank of England, the Bank of Japan, and the Deutsche Bundesbank. It con-suited experts in the accounting profession and other expert groups currently examining the changes in global financial markets and the treatment of complex financial transactions. The panel heard expert testimony and reviewed written comments from numerous government, academic, and industry users on the adequacy of the existing data. The panel also canvassed data filers from commercial and investment banks, securities firms, brokerage houses, and multinational corporations to learn their views on data reporting requirements.
In developing its recommendations, the panel took into account the current budgetary constraints that face statistical agencies, as well as the rapidly evolving world financial environment and the advent of innovative information and telecommunications technologies. Recommendations in this report are ranked in terms of
their relative importance; the most important are listed first in each section.
The rest of this chapter reviews the forces that have dramatically transformed world financial markets over the last decade or so and their implications for U.S. economic and financial policies. describes the existing system for compiling data on U.S. international capital transactions, noting its concept, coverage, and methods of collection. examines the adequacy of the existing system, taking into account the views of data collection agencies, data filers, and data users, and makes recommendations for improvements. reviews the surge of transactions in financial derivatives and discusses their implications for the coverage and the interpretation of existing data on U.S. international capital transactions. explores the feasibility of using alternative data sources and collection methods to improve the coverage and accuracy of existing data, including automation, the use of global custodians, exchanges, settlement and clearing houses, and databases of international organizations.
Appendix A highlights key features of the data collection systems of the United Kingdom, Germany, and Japan and discusses actions being taken by these countries to improve information on their international capital transactions. Appendix B summarizes the results of the panel's canvass of data compilers, filers, and users on the adequacy of the existing data system.
Throughout this report, following the balance-of-payments framework for current U.S. data, ''foreign" means non-U.S. resident, and international capital transactions are those between residents and nonresidents (foreigners). Other terms commonly used in the field, and in this report, are "offshore," "abroad," and "overseas," all of which are the same as foreign for purposes of international capital transactions, which are also sometimes called cross-border transactions.
FACTORS CONTRIBUTING TO GLOBALIZATION
The rapid expansion and integration of world financial markets since the late 1970s can be attributed to several factors. They include a worldwide move toward deregulation of financial institutions and transactions; macroeconomic imbalances among countries, which have induced capital flows; improved knowledge about market and economic conditions around the world; and breakthroughs in information and communications technology that have increased exponentially the capacity for handling large volumes
of financial transactions while significantly reducing unit transaction costs and making possible the use of new financial instruments. In addition, competition has grown among financial institutions of various types and in various countries, whose portfolio management strategies in volatile markets have resulted in new products and new modes of operation. The development of world financial markets in response to these forces and the U.S. experience can be traced back about two decades.
DEREGULATION AND LIBERALIZATION OF FINANCIAL ACTIVITIES
The trend toward financial deregulation accelerated in the early 1970s, when the government controls on financial activities that had been established in the 1950s and 1960s and earlier were proving ineffective and causing serious inefficiencies in the allocation of capital and the operation of monetary policy. The United States removed its last capital controls in 1973; Germany significantly reduced its restrictions on capital movements in the 1970s; and the United Kingdom dismantled its exchange controls in 1979, Japan in the early 1980s, and France and Italy in the late 1980s. Countries embraced deregulation because it was thought that free flows of capital would open up both saving and investment opportunities for firms and individuals and better match the changing needs of suppliers and users of funds, thereby facilitating the efficient allocation of capital and promoting growth in income and output.
In the United States, the liberalization of domestic financial markets since the late 1970s has further facilitated international capital flows. The phaseout of interest rate ceilings (Regulation Q),2 the easing of portfolio restrictions on pension funds and insurance companies, and the removal of a variety of restrictions on the permissible activities of banks3 have facilitated large transfers of money, both within national borders and across them. The lowering of institutional barriers was intended to allow firms and individuals to adjust their claims and liabilities with greater ease in order to improve the liquidity of their portfolios and diversify
2
Regulation Q set the maximum level of interest rates that banks and savings and loan companies could pay on deposits.
3
Banks are still limited in the extent to which they can diversify into insurance, investment, and underwriting services. As of mid-1994, banks, unlike enterprises in other industries, were prohibited from branching freely across state lines. However, under recently enacted legislation, this prohibition will be removed over the next few years.
their risks. The drive toward international diversification by U.S. institutional investors (especially pension funds, insurance companies, and mutual funds) has been a major force behind the internationalization and integration of U.S. financial markets.
The process of integration has also intensified as foreign investors and financial institutions have been allowed relatively freely to enter domestic markets in different parts of the world. Between 1978 and 1991, for example, the number of foreign banks in the United States rose from about 122 to 280. Branches and agencies of foreign banks held aggregate assets of $626 billion in 1991, up from $90 billion in 1978. In 1991 foreign banks accounted for 18 percent of total banking assets in this country and operated 565 offices (Federal Reserve Board of Governors, 1993:1).4 Meanwhile, at the time of the "big bang" of 1986—the deregulation of securities markets in the United Kingdom—many U.S. securities firms and banks expanded their presence in London through acquisitions and other means. There are other measures of increased integration of financial markets: over the same 1978-1991 period, the value of U.S. assets abroad rose more than three-fold while the value of foreign assets in the United States showed an even more dramatic six-fold increase. (Bureau of Economic Analysis, 1993a; 1994a).
MACROECONOMIC CONDITIONS
In an environment of deregulated and liberalized financial markets, international capital movements have been driven mainly by economic fundamentals. The macroeconomic conditions of various countries and their trade and tax policies, for example, affect the expected rates of return on various investments in different markets. In the mid- to late 1970s, large capital flows resulted from the recycling of the oil export surpluses of the Organization of Petroleum Exporting Countries, many of them through international banks to sovereign borrowers in the developing countries. During the late 1970s and early 1980s, there was considerable capital flight from many developing countries as uncompetitive interest rates and exchange rates, large fiscal deficits, and high
4
Foreign banks with U.S. branches and agencies first became subject to federal regulation with the adoption of the International Banking Act of 1978. Additional regulatory authority was provided by the Foreign Bank Supervision Enhancement Act in 1991.
external debt burdens took a toll in those countries. Beginning in the early 1980s, large capital inflows into the United States were an important source of financing for the sizable federal budget deficits being incurred.
Differences in the mix of fiscal and monetary policies between the United States and other industrial countries over the past decade have directly affected exchange rates for the dollar. The large movements of the dollar against other major currencies since the 1980s, in turn, have contributed to increases in sales and purchases of dollar-denominated securities and the expansion of foreign-currency trading.
In 1992, differentials approaching 6 percentage points or more in interest rates between the United States and Germany attracted capital to Germany from the United States (and other countries). Following unification, Germany relied on high interest rates to dampen inflationary pressures arising from the huge costs of revitalizing the economy of the former East Germany. Also in the early 1990s, rapid economic growth in East Asian countries and large export surpluses in those countries have generated pools of savings that flow into the global economy to finance the investments that offer the highest rates of return.
TECHNOLOGICAL INNOVATIONS
Technology is another force that has changed the operation and structure of international financial markets. Information and telecommunications technologies have greatly increased the speed with which information is processed and disseminated. Around the world, market participants are bombarded with a plethora of information and a cacophony of opinions, reports, and rumors, much of which is communicated by computers.
In addition, electronic trading has allowed orders to move across continents, directly from customers to brokers and dealers. Automated trade execution and international clearing and settlement have also encouraged cross-listing of securities and further integrated world financial markets. Today, traders have access to instruments and overseas markets after U.S. trading hours have ended. If they choose to, they can also "pass the book" to their affiliates in foreign markets, who can continue trading in daylight hours overseas.
Automated trading execution systems provide a 24-hour trading market, allowing traders to enter buy and sell orders that are automatically matched according to price and time preferences.
One example of such systems is GLOBEX, an electronic trading system launched by the Chicago Mercantile Exchange and the Chicago Board of Trade in conjunction with Reuter, the British information services firm. Key U.S. government securities and foreign exchange are traded in global markets. Round-the-clock trading is expanding because increases in speed and control over the direction of information flows can result in large profits or reduced losses in financial markets. The greater ease with which financial traders can gain access to different markets and their reduced costs have enabled them to take advantage of even small profit margins around the world.
Furthermore, interactions among markets, which have been facilitated by technological innovations, have provided market participants with opportunities to diversify, hedge, and increase profits on their investments, thereby promoting the use of new financial products and instruments. Over the past several years, there has been rapid growth in financial derivatives, such as forwards, futures, options, swaps, and sophisticated combinations of them on interest rates, exchange rates, stocks, and bonds. A primary purpose of these instruments is to hedge exposure against risk, and many are traded across borders. Accompanying this rise in derivatives has been the rapid expansion of over-the-counter markets that involve trading over computer networks in securities tailored to the specific needs of individual investors, borrowers, and intermediaries. (A detailed discussion of financial derivatives is presented in Chapter 4.)
COMPETITION AMONG FINANCIAL AND NONFINANCIAL INSTITUTIONS
The easing of capital controls, the liberalization of financial markets, and technological innovations have stimulated competition among financial and nonfinancial institutions in various countries. This, in turn, has further transformed the structure of world financial markets.
Over the past 25 years, a notable development in international finance has been the growth of securitization—a process of converting assets that would normally serve as collateral for a bank loan into securities that are more liquid and can be traded at a lower cost than the underlying asset. This process has been fostered, among other things, by technological innovations. With computers and electronic record-keeping, financial institutions can cheaply bundle together a portfolio of loans (originally, mortgage loans) with small denominations, collect the interest and princi-
pal payments, and sell the claims to these payments to a third party as a security. This process of pooling loans and selling securities backed by the loans has been found by financial institutions to be more efficient than traditional financing through financial intermediaries in certain situations, and it has been used, for example, for auto loans and credit card obligations.
In an environment of deregulation, nonbank financial companies have devised new and different ways to move money from savers to borrowers. In recent years in the United States, for example, pension funds, money market funds, and insurance companies, among others, have increasingly lured savings away from bank deposits. In turn, these institutional investors, which are better able than individuals to acquire the needed information for foreign investment, have heavily invested in foreign securities, fostering the rapid expansion of international bond and equity markets.5 Under these circumstances, there now are diverse institutions competing to provide financial services; securities have become an increasingly important element in international capital flows.
Meanwhile, multinational corporations that produce and sell goods and services on a global scale seek worldwide sources for their financing and investment needs. To serve these clients, financial institutions have diversified the services they offer, among which are transactions in foreign exchange, money market instruments, and derivative products, all on a worldwide scale. These sophisticated financial instruments allow investors an array of alternatives for hedging and shifting risks, which, at a cost, can provide greater certainty of international receipts and payments, or, in some cases, for taking on exposure with a highly leveraged position. There is a large market for such instruments in today's environment, as international businesses, speculators, and investors are faced with volatile exchange rates, interest rates, and commodity prices.
The rise in new financial instruments has added flexibility to
5
A 1993 study by a private financial consulting firm estimated that holdings of foreign stocks by U.S. public pension funds rose from $28.9 billion in 1991 to $48.1 billion in 1992; those of corporate pension funds rose from $59.3 billion to $70.7 billion during the same period. In 1992, foreign stocks accounted for almost 8 percent of assets of corporate pension funds and about 5.6 percent of assets of public pension funds. A survey of pension funds reported in the study showed that public and corporate pension funds expected to increase their holdings of foreign stocks to $100 billion and $116 billion, respectively, by 1995 (Greenwich Associates, 1993).
portfolio management operations. As a result, more and more debt and equity products now originate and are traded in several world financial centers and in different currencies. For example, hedging and other position taking can be carried out with financial and commodity futures and options; they can also be undertaken with interest rate swaps and forward agreements for major exchange rates and commodity prices. Hedging operations can also be combined with other lending arrangements (for example, in a commodity swap) to secure—at a cost—both access to additional funds and greater protection from changing international interest rates and commodity prices. In addition, some multinational corporations act, in effect, as their own in-house financial intermediaries, raising funds wherever they are cheapest and moving them through diverse channels (including offshore—foreign—holding companies) to where they are needed. To some extent, these organizations can be thought of as arbitraging national financial markets. Overall, these private firms, both financial and nonfinancial, now rely heavily for their funding on marketable instruments; the use of commercial paper,6 floating rate notes, bonds, convertible bonds, shares, and related instruments has grown rapidly in recent years at the expense of traditional bank deposits and loans in financing big businesses.
According to a recent Federal Reserve study (Post, 1992), the U.S. commercial paper market since the early 1980s has become an important source of short-term funds for manufacturers, commercial concerns, and utilities to finance increased production, new inventories, or new receivables. Business enterprises turned to commercial paper to avoid high interest rates on long-term funds and bank loans in an expanding economy. Two other developments in the late 1980s also increased the issuance of commercial paper: the numerous mergers and acquisitions and the expansion of the swaps market, as borrowers combined commercial paper with swaps to create liabilities in other currencies. Asset-backed commercial paper also came into use, providing off-balance-sheet financing for trade and credit card receivables. 7 Money market
6
Commercial paper consists of short-term unsecured promissory notes, which are issued mostly by corporations.
7
Off-balance-sheet activities are business transactions that do not generally involve recording assets or liabilities in the balance sheet: examples include trades in swaps, options, futures, and foreign exchange forwards and the granting of standby commitments and letters of credit.
mutual funds provided the largest source of funds to this market in the 1980s.
Over the past decade, commercial paper outstanding grew at an average annual rate of about 17 percent. In 1988 the size of the commercial paper market even temporarily surpassed that of the market in U.S. Treasury bills. The issuers of commercial paper in the United States have included foreign corporations and foreign financial institutions. According to the Federal Reserve study (Post, 1992), commercial paper will remain a major source of short-term funds for corporations in the 1990s. High-rated foreign corporations in the United States, attracted by the liquidity and the low cost of the market, are likely to be among the new issuers.
While foreign corporations have been raising capital in the United States, the use of foreign financial centers by U.S. businesses has also been extensive. The Federal Reserve Bank of New York (1992a) estimates that loans to U.S. commercial and industrial companies that originated offshore rose from $37 billion in 1983 to $174 billion by the end of 1991. Offshore bank loans to U.S. businesses surged in the 1980s as foreign banks availed themselves of the opportunity to avoid the reserve cost of making loans in the United States.8 The fastest growth in these offshore loans to U.S. commercial and industrial businesses has occurred in the Cayman Islands and in industrial countries, such as Japan.
In this competitive environment, banking activities have also significantly changed. During the late 1970s and the early 1980s, large commercial banks in many countries, including those in the United States, sought to boost their profits by lending large sums to developing countries. Since then, although deposit-taking and lending have remained the core business of commercial banks, an increasing portion of their income has come from sources other than the differentials between the interest they pay on deposits and the interest they charge on loans. To improve profit margins, in addition to offering fee-paying business advisory services, banks have increasingly packaged assets not traditionally traded (such as mortgage loans, car loans, corporate receivables, and credit card receivables) into tradable securities. They also have turned to derivative instruments as opportunities have declined in traditional interbank deposit markets.9 Banks have also pursued off-
8
The growth of offshore loans declined after the Federal Reserve removed the relevant reserve requirements in 1990.
9
The sharp cutback in interbank business has been attributed to the low returns and potentially large counterparty risks related to this type of business (Bank for International Settlements, 1992a).
balance-sheet activities to shift assets off their balance sheets and thereby improve their capital ratios. Currently, an increasing proportion of banks' credit and liquidity exposures has been incurred off their balance sheets With the growth of nonbank financial institutions, banks have also offered backup lines of credit or guarantees to these institutions, such as the backing of commercial paper issues. Under the 1988 Basle Capital Accord, banks' recommended capital requirements for these activities are much lower than for regular loans.10 One major role that large commercial banks have retained is to provide payments and clearing mechanisms for most financial transactions.
Yet another development in the structure of world financial markets is that, with the rise in the use of derivative instruments by both bank and nonbank financial institutions, securities, forwards, futures, and options markets have become increasingly linked. Advances in telecommunications technologies have facilitated interactions among these markets.
POLICY ISSUES ARISING FROM GLOBALIZATION
Several benefits have been cited as a result of the changes in the structure and operation of international financial markets. Capital mobility and financial innovations are credited with having provided savers and borrowers with a wider range of investment alternatives and easier and cheaper access to external financing. They are also believed to have facilitated greater diversification of portfolios and increased the size of markets. Internationalization of capital markets is said to have facilitated the financing of global payments imbalances and encouraged more efficient allocation of global resources.
Nonetheless, there has also been a widespread perception that deregulation, globalization, and financial innovations have complicated the formulation and the implementation of monetary and fiscal policies, led to greater volatility in financial markets, and introduced new and highly complex elements of risk that can
10
The Basle Capital Accord refers to the minimum capital standards agreed to by the Basle Committee on Banking Supervision for the supervision of international banking groups and their cross-border establishments. The Basle Committee is made up of the banking supervisors of the Group of Ten industrial countries and Luxembourg. The 1988 accord called for a minimum 8-percent ratio of a bank's capital to its risk-weighted exposure to credit risk, which was to be attained by the end of 1992. Proposals for capital standards covering market risks are under discussion.
cause major disruptions in international financial systems. International capital mobility not only has led to growing linkages of world financial markets, but also has increased the extent to which macroeconomic policies and market conditions of one country can significantly affect those of others. Meanwhile, the securitization of transactions and growth in the use of financial derivative instruments have made international financial flows more complex and less transparent, complicating supervision of financial institutions. This section discusses several aspects of the effect of new global realities in financial markets on a nation's economic policies and financial oversight.
MACROECONOMIC POLICIES
Interest rates and the availability of capital in an industrial country are now much more influenced than in the past by interest rates and credit availability in other countries. A corollary is that monetary (and fiscal) developments in a major industrial country have larger macroeconomic effects on other countries than they did when capital was less mobile internationally. A vivid example was the effect in 1992 of high interest rates in Germany on other members of the European Monetary System, as well as on other industrial countries, including the United States. The freer flow-of-funds among countries does not necessarily bring their interest rates into line with one another. Interest rates can differ among countries when there exists an expectation that exchange rates will change or when there is a premium related to other types of risk. Nonetheless, a change in interest rates in a major industrial country can strongly affect both interest rates and exchange rates in other countries.
The growth in cross-border deposits also has implications for monetary policies. When cross-border deposits were small and relatively stable, they could be ignored when examining the behavior of domestic monetary aggregates. In recent years, however, the growth in these deposits has added to questions about the usefulness of monetary aggregates as indicators of the tightness or slack of U.S. monetary conditions, in part because measures of U.S. monetary aggregates do not fully capture deposits held by U.S. residents in banks located in foreign countries.11 In
11
The three major measures are M1, M2, and M3. M1 includes currency outside the Treasury Department, Federal Reserve banks, and the vaults of depository institutions; traveler's checks of nonbank issuers; demand deposits at all commercial
addition, because of foreign offerings of dollar-denominated obligations, net U.S. international capital flows do not fully indicate exchange market pressures on the dollar (Cooper, 1986).
Furthermore, it is argued that under floating exchange rates, increased international capital mobility can quicken the speed with which tight monetary policies slow inflation, since currencies tend to appreciate in response to higher interest rates. The unusual speed of the U.S. disinflation in the early 1980s is an example (Willett and Wihlborg, 1990).
Enhanced capital mobility also affects fiscal policy. In the past, when a country's fiscal policy led to a large budget deficit, the effect was primarily domestic, in the form of more rapid expansion of national income and output and possibly also in some crowding out of private investment as the government borrowed more and interest rates rose. Now a significant result may be a large trade deficit, if high interest rates attract funds from abroad and the exchange rate appreciates. This phenomenon was evident in the United States in the 1980s, when large federal budget deficits were accompanied by large trade deficits.
Today, external imbalances are in many cases more easily financed than in the past by movements of foreign capital. As a result, large trade surpluses and deficits may cause less concern to market participants and to policy makers. From another perspective, the more ready availability of international capital may provide domestic officials with more time to undertake the adjustments needed to correct domestic and external imbalances. Changes in current account balances do, of course, affect domestic income and employment. And sustained imbalances can lead to the build-up of large international debtor and creditor positions that affect the real incomes and debt burdens of future generations.
Yet another effect of capital mobility on domestic macroeconomic policies is that tax incentives to boost domestic savings (for example, through increased tax deductions for individual retirement accounts) may be less likely than in the past to generate a rise in capital for domestic investment. Uncertainty about effects has
banks other than those due to depository institutions, the U.S. government, and foreign banks and official institutions; and other checkable deposits including share draft accounts in credit unions and demand deposits at thrift institutions. Overnight Eurodollar deposits of U.S. residents at foreign branches of U.S. banks are included in M2. Term Eurodollar deposits held by U.S. residents at foreign branches of U.S. banks and at all banking offices in the United Kingdom and Canada are included in M3.
risen because institutional investors and other professional money managers can move large pools of savings abroad. They increasingly do so when they calculate they can earn higher rates of return, after allowing for exchange risk.
ASSESSING THE STABILITY OF FINANCIAL MARKETS
As funds move more easily and more readily from one country to another, the prices of financial instruments (for example, securities and foreign exchange) may be subject to greater volatility. Increasingly, exchange rates (the prices of foreign exchange) are affected by ''news"—the flow of new information—and by the expectations it engenders. The prices of bonds and stocks are similarly influenced. And exchange rates and securities prices interact with each other. Hence, securities prices in one country can now be affected by the behavior of foreign as well as domestic lenders and investors, although the degree of influence differs from one situation to another, depending on a variety of circumstances. Thus, when the U.S. stock market declined sharply in October 1987, there were worldwide effects, but the large drop in the prices of Japanese stocks in 1991-1992 had little discernible impact on stock markets in the United States and other countries.
In principle, enhanced capital mobility could lead to more stable markets rather than to greater volatility of securities prices and exchange rates, since it makes markets less "thin" in terms of numbers of participants and potential flows of funds. Nonetheless, the information revolution, which has increased familiarity with economic, financial, and political conditions around the world and thereby encouraged international lending and investing, also brings a constant flow of news that can cause lenders and investors to make abrupt changes in their holdings in their own and other countries. Thus, markets are vulnerable to larger swings—both in the short and medium term—in a world of integrated financial markets and enormous worldwide liquidity. 12
12
The price dynamics created by derivative instruments can also exacerbate this potential. In foreign exchange markets, such swings in prices have led at times to coordinated intervention by central banks aimed at dampening the short-and medium-term volatility of exchange rates. Since the February 1987 meeting of the Group of Seven finance ministers and central bank governors at the Louvre, the monetary authorities of those countries have attempted to maintain their exchange rates within broad ranges.
MONITORING THE SOLVENCY AND LIQUIDITY OF MARKET PARTICIPANTS
The enormous volume of funds flowing across national boundaries and from one currency to another creates a risk that a breakdown in one financial system could spread across the world. The U.S. stock market crash of October 1987 demonstrated the speed with which major financial shocks can reverberate across global markets, and it drew attention to the types of liquidity, settlement, and clearance problems that can arise in money and equity markets.13 Many financial intermediaries receive and send extremely large sums, relative to their capital and liquid assets, through payments networks. To make the required payments, they are dependent on receipts from others. If one intermediary in the payments mechanism finds itself unable, for whatever reason, to make the payments for which it is liable and others will not lend to it, problems for other institutions and in other centers can develop quickly.
In the commercial banking system, central banks have long been prepared to act as lenders of last resort to enable banks to cope with liquidity problems. The bank examination process also aims to guard against insolvency in commercial banks, and there is close international cooperation among supervisors of commercial banks, who meet regularly at the Bank for International Settlements at Basle. But there are questions as to whether nonbank financial intermediaries—including brokers and dealers and investment banks—are equally well supervised and, if these nonbank institutions are adequately supervised, whether central banks should also act as their lenders of last resort.14
13
There have been some initiatives in the United States and abroad to improve the clearing and settlement systems since then.
14
The Technical Committee of the International Organization of Securities Commissions has been working toward international risk-based capital adequacy standards for securities firms. Efforts are being made to reconcile the differences between the capital requirements applicable to nonbank securities firms and those applicable to banks that engage in securities activities. In the United States, Congress recently provided authority to the Commodity Futures Trading Commission to more fully share information and cooperate with foreign regulators. In addition, the Securities and Exchange Commission is considering adjusting U.S. securities firms' capital standards to recognize more foreign markets and to collect data necessary to assess the need for additional regulation of the financial activities of U.S. securities firms' unregulated affiliates and broker-dealer holding companies.
Central banks and financial regulators have also become concerned about the risk exposure of participants engaging in derivatives transactions. Risks are posed in many ways, including by the volatility of the underlying markets. A market participant's exposure can change drastically with fluctuations in interest rates or equity prices: a small shift in share prices, for example, can result in a big change in the value of a stock-index option. Other risks pertain to the management of sizable positions by large financial institutions and the credit quality of these "wholesale" enterprises and their customers. Still another risk concerns illiquidity. Although derivatives traded on exchanges have many buyers and sellers, those tailored to specific customers' needs (such as those traded in the over-the-counter markets) are more difficult to liquidate since they are more difficult to value and to hedge against. In addition, the opaqueness of some of these transactions, especially over-the-counter contracts, compounds the difficulty for regulators of monitoring market participants in derivatives. Furthermore, as more and larger traders, driven by technical trading methods, seek to move increasingly large sums between markets, market volatility is likely to increase. The closer linkages among markets that are fostered by the growth of derivatives mean that financial shocks can be transmitted across markets quickly.
The growth in derivative instruments has created not only complex chains of counterparty (buyer or seller) exposures but also, in the case of exchange rate contracts, a significant expansion of international payment and settlement activities. To reduce risks and guard against payment "gridlock," the Federal Reserve and other central banks are closely monitoring their payment and settlement mechanisms. In addition, the Basle Committee has focused on ways of expanding the Basle Capital Accord to cover credit risk and various types of market risks, such as foreign exchange rate risk, interest rate risk, and position risks in traded equity securities. (For a discussion of the various types of risks arising from derivatives transactions, see Federal Reserve Board of Governors et al., 1993; Bank for International Settlements, 1992b; Group of Thirty, 1993.)
In sum, the interactions among countries' interest rates, exchange rates, and securities prices, hastened by the increase in capital mobility and the linkages of world financial markets, have major policy implications. The economic performance of one country—especially an industrial one with high capital mobility—will be affected by policies and market developments in other coun-
tries. There is a blurring of the traditional distinction between domestic and international economic policy. Policy makers in major industrial countries need to take account of policies and policy intentions elsewhere. In a world of growing interdependence among nations, enhanced capital mobility will, in some cases, help policy makers achieve their domestic macroeconomic objectives; in other cases, however, it may undercut the effect of national policies on domestic economic performance.
IMPLICATIONS OF GLOBALIZATION FOR DATA COLLECTION
In this new global economic environment, to better formulate U.S. macroeconomic policy, monitor financial market performance, and oversee the stability of the domestic financial system, comprehensive information on U.S. international capital transactions will be required. At the same time, the unprecedented changes in global financial markets have reduced the effectiveness of traditional data collection methods and the adequacy of the existing data. This section provides an overview and some examples of the deficiencies of the existing data. The rest of the report addresses the shortcomings in detail and presents the panel's recommendations for data improvement.
The present U.S. data collection system for international capital transactions originated some 50 years ago (see Chapter 2). At that time, portfolio investment was largely channeled through such traditional financial instruments as bank loans and deposits, denominated mostly in U.S. dollars, and handled by a relatively small number of large banks and financial institutions. The current system, as it has evolved, still emphasizes the collection of data on traditional international banking transactions. But the rise in nonbank market participants (in particular, institutional investors), the surge in international financial flows and their diversification across currencies, the increase in offshore financial activities, and the burgeoning international trade in derivative financial instruments have outstripped the coverage of the U.S. data system. Rapid technological innovations have also allowed numerous transactions to bypass domestic financial intermediaries, and such transactions are beyond the reach of the traditional reporting mechanisms, thus raising questions about the adequacy of relying largely on domestic data filers. Meanwhile, as U.S. international capital transactions have proliferated and become more complex, the work required to compile comprehensive in-
formation on them has greatly expanded and become much more costly for both statistical agencies and those who report the raw data.
The conceptual framework under which the existing data are collected, that of the balance of payments, defines U.S. international transactions as those between U.S. residents and those outside U.S. boundaries. (See Chapter 2 for a detailed discussion of the U.S. balance-of-payments accounts.) The purpose of this framework is to compile information on economic exchanges that cross the border between the United States and the rest of the world. These data provide vital information needed to understand the external sector of the economy and how it affects domestic economic activity. International transactions, defined in this way, are a component of the national accounts (which include the national income and product accounts, the flow-of-funds accounts, and the balance sheets of the U.S. economy). However, as financial activities have become global in nature, the resident-nonresident distinction has become inadequate to fully depict all facets of these activities. Increasingly, cross-border financial exchanges represent capital transfers among the worldwide offices and branches of U.S. financial institutions, rather than transactions largely between U.S. firms and foreign firms. There is also a growing presence of foreign-owned firms in the U.S. domestic markets and of U.S.-owned firms in markets abroad. These developments have complicated the identification of resident versus nonresident transactions. More important, as discussed above, internationalization of financial transactions has given rise to policy concerns about the liquidity, solvency, and stability of the U.S. financial system insofar as it is affected by foreign markets. These are issues the balance-of-payments framework was not designed to treat. There is need to supplement the existing balance-of-payments data with other information on U.S. financial activities to guide the decisions to be made on myriad emerging public policies.
In its report (Kester, 1992), the Panel on Foreign Trade Statistics recommended supplementing the existing trade statistics, collected under the balance-of-payments framework, with economic information collected outside it to better depict the globalized U.S. business activities in goods and services. Such a broader framework would greatly assist in addressing such issues as U.S. international competitiveness and the impact of foreign trade and direct investment on U.S. employment and production. This report makes recommendations to improve the coverage and accuracy of the existing data, but it also proposes ways to supplement them
with data on the burgeoning financial derivatives transactions collected outside the traditional balance-of-payments framework.
The need for improved data is further evidenced by the incomplete accounting of the sizable U.S. international capital flows in recent years and the uncertainty associated with it about the U.S. financial position in the world economy and other economic and financial developments. A few examples follow.
U.S. statistics for 1982 indicate that the rate at which nonresidents were acquiring assets in the United States was less than the rate at which U.S. residents were securing assets abroad. But the statistical discrepancy of the U.S. balance-of-payments accounts in that year was larger than the difference between these two totals: current account receipts or net inflows of capital of about $41 billion were not identified or recorded. Thus, the direction of the net capital flow could have been the opposite of that reported in the 1982 U.S. balance-of-payments accounts.
When initially released, data for 1985 on the U.S. net international investment position showed that foreign assets of U.S. residents were less than their liabilities to foreigners. The press referred to the United States as being "a debtor nation" for the first time since before World War I. The cumulating liabilities, whose burden could fall on the next generation as well, were deemed to imply the obligation to pay future interest, dividends, profits, and amortization to foreign investors. However, the U.S. data on U.S. residents' direct investments and claims on foreigners was listed at book value, omitting any increase in market value of the investment over time. Some analysts believed that this source of understatement in the U.S. international investment position was so large that U.S. liabilities to foreigners for 1985 were, in fact, smaller than U.S. holdings of foreign assets. Yet others pointed out a measurement error in the other direction: the cumulative statistical discrepancy in the U.S. balance-of-payments accounts as reported at the same time totaled $117 billion for the years 1981-1985 alone, indicating possibly sizable unreported capital inflows.
These data have subsequently undergone several revisions, and BEA has also begun publishing market value as well as historical cost estimates of total asset values. According to recently published data (Bureau of Economic Analysis, 1994a:71), foreign assets owned by U.S. residents in 1985 exceeded foreigners' ownership of U.S. assets, measured either by historical cost or market value. Since 1989 however, foreigners' ownership of U.S. assets
has exceeded the foreign holdings of U.S. residents', using either the historical cost or market value measures.
Even the revised data may tend to more closely track foreigners' investments in the United States than U.S. residents' investments abroad, however. Until 1994, U.S. holdings of foreign securities had not been comprehensively surveyed since World War II.15 In addition, despite the recorded "net indebtedness," official statistics show that U.S. earnings (interest and profits) on investments abroad continue to be larger than the earnings paid by the United States to foreigners on their U.S. investments.
Until the 1980s, as noted above, banks dominated the international financial system, but securitization has occurred rapidly since then. U.S. official statistics show foreign purchases of U.S. securities as exceeding bank-reported liabilities as the largest component of the capital inflow in 1985. But a recent study by the Federal Reserve Bank of New York (1992a) indicates that as much as $70 billion of foreign lending to U.S. business that took place offshore in the 1980s was not included in the official statistics of U.S. international capital transactions. This funding raises the question of whether official statistics have overstated securities as a source of financing and understated the major role still played by banks.16
U.S. statistics show that 1985 sales of U.S. Treasury securities to foreigners, although many times greater than those in 1980, were still relatively small ($20.5 billion, of which 83 percent was sold to Japanese residents) (Frankel, 1988:592). Yet official Japanese statistics show that the value of U.S. Treasury securities bought by Japanese residents was much larger than was shown in the U.S. data. For 1986, the discrepancy between U.S.-reported sales of U.S. Treasury securities to Japan and Japanese-reported purchases of U.S. Treasury securities was $37 billion ($12.8 billion and $49.4 billion, respectively). Since U.S. Treasury securities are sold in global markets and the U.S. official data do not identify the ultimate owner of the securities, the holdings of U.S.
15
The survey was conducted in 1994, but as of mid-1994 there was no firm schedule for data release.
16
Recently published revised data (Bureau of Economic Analysis, 1994a) contain dramatic upward revisions in estimates of U.S. nonbanks liabilities to foreigners for the years 1983-1993. These revisions result largely from BEA's continuing program to use data reported by foreign banks. Much of the revision is based on data from the Bank for International Settlements (BIS) on bank claims reported in Caribbean and Asian banking centers.
Treasury securities held by particular countries remain unclear. In addition, U.S. data on capital transactions do not identify the extent to which U.S. assets held by foreigners are in practice hedged in foreign currencies. This deficiency has hampered the analysis of the vulnerability of the dollar to foreign portfolio shifts.
The United States was able to continue financing large trade deficits in 1987 and thereafter without major depreciation of the dollar: one explanation is that foreign central banks stepped in to buy dollars when private investors had become wary of trading. Although official statistics on central bank transactions are believed to be better than those on private transactions, even the official statistics are problematic. When a foreign central bank acquires dollars and deposits them in a commercial bank abroad, the dollar holdings will not show up in the U.S. statistics as foreign official holdings of dollars. They will appear as U.S. liabilities to foreign commercial banks. The published figures of foreign official holdings of dollars, therefore, may understate the extent of foreign government intervention in foreign exchange markets; this happened in 1987. The Federal Reserve Bank of New York, using its own data and other sources, has estimated that foreign official purchases of dollars in 1987, including the private channeling of official capital, may have been almost three times higher than the $45 billion that was recorded in the U.S. balance-of-payments accounts.
In the late 1980s, Americans became more concerned about another sizable component of the capital inflow: foreign direct investment in the United States. The news media carried stories that Japanese and other foreign investors were building factories and buying assets in the United States, including such national symbols as Rockefeller Center and the Seattle Mariners baseball team. How extensive is foreign direct investment in the United States and what is its economic impact? The availability of data bearing on these questions has expanded in the last few years, but gaps remain (see Chapter 3).
In 1990 and 1991, with the American economy in recession, the question arose as to whether monetary policy had been too tight. During 1990, M1 grew at 4.0 percent, and it grew 8.7 percent in 1991. On the face of it, this might have appeared to be adequate money growth to finance the economy. In 1990, however, an increase in currency outstanding constituted three-quarters of the increase in M1 ($24.2 billion of $32.0 billion). Some estimates suggest that over half of U.S. dollar currency outstanding is held in Latin America and other foreign countries, where it
is often a good shelter from local inflation and taxation. A Federal Reserve analysis suggests that there was a large unmeasured outflow of U.S. currency in 1990 (perhaps $15 billion of the $47.4 billion errors and omissions in the U.S. international transaction accounts 17) and that, as a result, the observed M1 growth gave a misleadingly expansionary indication of monetary conditions (Stekler and Truman, 1992:5). In 1991, the increase in currency explains only 28 percent of the increase in M1 ($20.5 billion of $72.0 billion). Clearly, better data on international shipments of U.S. currency would help the Federal Reserve to design monetary policies for the goals it seeks.
In summary, U.S. financial activities are becoming increasingly globalized. The formulation of U.S. macroeconomic and financial supervisory policies and the public debate over U.S. external indebtedness depend on reliable statistics that accurately depict the nature and extent of U.S. international financial transactions. They are also needed to evaluate exchange market conditions and potential pressures, to examine the risk exposure of U.S. financial institutions, and to assess foreign ownership of U.S. business. Without such statistics, informed decisions will be difficult to make and sound policies will at times be lacking.
It should be noted here that the United States produces as much detailed data on its international capital transactions as any country in the world. The United States is not alone in facing problems of collecting and integrating data on such transactions. Other countries are confronted with similar problems and are working to improve their data In principle, global outflows should equal global inflows. However, as reported by the International Monetary Fund (1993b), the statistical discrepancy in the global capital account averaged nearly $120 billion a year during 1989-1992: that is, recorded capital inflows exceeded outflows by that amount, on average, for every year during that period.
XXX . V0000000000 What will be the future of crypto currencies?
The emergence of Bitcoin has sparked a debate about its future and that of other cryptocurrencies. Despite Bitcoin’s recent issues, its success since its 2009 launch has inspired the creation of alternative cryptocurrencies such as Litecoin, Ripple and MintChip. In these experiences the speculative motive seems to be preailing. However, recently, digital social currencies' experiments are diffusing, by starting from the Bicoin protocol. when studying the future of cryptocurrencies you should take into consideration the potential regulatory deterrents that may emerge as Central Banks and Local Governments start paying more attention to these competing currencies . The success of Bitcoin was spectacular, however this cryptocurrency showed its drawbacks. Mainly the problem is with money supply, which in case of Bitcoin is limited by design (high computation power is required to mint new Bitcoins). This limited supply causes Bitcoin to be susceptible to speculation. As demand for Bitcoin rises its value increases and vice versa.
Nowadays we use fiat money (legal tender), which value is forced by law. In case of cryptocurrencies there is no real value in background nor the law. So cryptocurrencies are risky from definition. On the other hand, there are some businesses offering electronic money backed by precious metals as gold or platin (e.g. goldmoney.com). In order to begin speculating on the future of Bitcoin and cryptocurrency technology, it is important to define Bitcoin as it exists today. Currently, anybody can send value to anybody in the world, instantly, for free, without the consent of any entity. The only requirements are a cheap computer and an internet connection (although there are ways of sending Bitcoin over GSM [Link 1] and radio [2] as well).
Strictly regarding the technology of Bitcoin, the means of exchange is already superior to mainstream electronic payments, and the addition of financial instrument libraries such as Open Transactions [3] will soon enable Bitcoin to be a superior unit of account as well. It has been called the first practical solution to a long-standing mathematical problem, The Byzantine Generals Problem [4].
At least three banks have begun implementing the Ripple Protocol (a blockchain spinoff) for their international payment gateways [5,6] as well.
While it is highly unlikely that the currency application of Bitcoin will become the standard, international currency, it is very likely that the technology underlying it will become useful for reducing the need for trust, something which the current monetary system heavily depends on.
If cryptocurrencies continue their upward trend, one can easily foresee a restructuring in, e.g. the concept of a bank. Banks currently provide financial services AND act as custodians of customers' money. Bitcoin and blockchain technology can potentially allow banking services to be performed without the need to trust banks with your money.
Other future applications of Bitcoin include smart property (a la vending machines, Uber ridesharing service), assurance contracts, contract exchanges, notary services, escrow, oracle-automated transactions (when X occurs, send money to A), and others [7]. The theoretical benefits of Bitcoin for the unbanked are enormous, operating as it does on a peer-to-peer volunteer computer network without the need for a third-party bank or mobile money platform. Yet, the theoretical benefits of mobile money for the unbanked are also huge; transforming that theory into practice, however, has proved to be a significantly harder nut to crack, as is well known. And in this regard cryptocurrencies have to overcome the same hurdles that mobile money does, if people in emerging markets are going to be likely to entrust their money into a volatile cryptocurrency system which, actually, very few people in more advanced economies actually understand. As you have said, recently, many cryptocurrencies have been created. In most of them have prevailed speculative motivations. But following the experience of bitcoin, there are other projects of social-currencies with social objectives.
These new currencies try to avoid the negative effects of the current monetary system on the stability and sustainability (see Lietaer), specially the way in which money is created by banking system today and the effects on the debt imperative which drives a groth imperative.
Future Money explains in plain language and convincing detail how our money system is propelling us toward the self-destruction of our species - and what we should do about it. Our present money system frustrates the well-meaning efforts of active citizens, NGOs and governments to deal with our present ills and problems - including worldwide poverty, environmental destruction, social injustice, economic inefficiency and political unrest and violence within and between nations. Failure to reform the world's money system urgently and radically - that is, from its roots up - could bring disaster for human civilization before the end of this century. Future Money shows clearly how our money system operates and how it could be reformed so that it acts for the benefit of people and society rather than the opposite, and describes the obstacles that currently prevent that reform.
The world's financial experts and leaders in politics, government and business, and most mainstream academic and media commentators, have demonstrated that they are not yet able or willing to diagnose and treat the profound and pervasive problems that are directly caused by the money system. Future Money speaks explicitly to active, independent-minded citizens, including young people, with the hope that it will help them to understand why people committed to careers in almost every important walk of life today find it difficult to recognize the problem and grasp the nettle. It shows why we have to take the initiative now, and urgently, to get the issue on to mainstream agendas worldwide. The state of the global economy affects every single one of us. With economic growth threatened by financial regulation and the East and West at competitive odds, the real solutions to global recession can only come through international co-operation. Featuring World leaders, Nobel Prize-winning economists, award-winning writers and opinion formers The Future of Money brings together the finest thinking to suggest solutions to this global predicament.
As the recent financial crisis has revealed, the state is central to the stability of the money system, while the chaotic privately-ow point of view it will turn out at the end that a private funded money is a product like all kind of products. Selling a product for a high (other) monetary value is nice for the creator - but the extrem volatile behavior of such a computer generized product as a replacement for money is not very good for the normal use of money.
One remark: I see money only as a product because money is not having a defined unit to measure values. This is because there is no defined "one part of economy" for a reference for "one part of money".
And money can not really store any kind of value. The conditions around the usage of money "stores" value ... (or make it look like money can store value) but it is the continuity of external conditions which makes a money worth something tomorrow. Not the money itself. need banks reap the benefits without shouldering the risks. This book argues that money is a public resource that has been hijacked by capitalism.
Mary Mellor explores the history of money and modern banking, showing how finance capital has captured bank-created money to enhance speculative leveraged profits as well as destroying collective approaches to economic life. Meanwhile, most individuals, and the public economy, have been mired in debt. To correct this obvious injustice, Mellor proposes a public and democratic future for money. Ways are put forward for structuring the money and banking system to provision societies on an equitable, ecologically sustainable sufficiency basis.
This fascinating study of money should be read by all economics students looking for an original analysis of the economy during the current crisis.
"Freecoin is not a currency, but a suite to create P2P currencies. What can be considered naïve in Bitcoin is a premature investment of time and resources in it. Bitcoin has been linked too fast to the already problematic world of existing physical currencies, especially considering its stage of development and its usability. While it is fun to see it works, it is also obvious to many that this technology needs more development and that we cannot be concerned about the integrity of a network of stakeholders while at the same time adding features and correcting bugs. In these regards, Freecoin can be seen as consolidated playground for experimentation on P2P crypto currencies and further growth of this technology, still open to the use people will make of it in future. Additionally, one of the main points of Freecoin is that to make the genesis code configurable at runtime, meaning it will be possible to use the same technology that circulates Bitcoin today for new and diverse currencies in future, relying on a shared code-base and a set of configuration files that represent the “unique genetic code” for each currency."
XXX . V00000000000 How Money Became the Measure of Everything
Money and markets have been around for thousands of years. Yet as central as currency has been to so many civilizations, people in societies as different as ancient Greece, imperial China, medieval Europe, and colonial America did not measure residents’ well-being in terms of monetary earnings or economic output.
In the mid-19th century, the United States—and to a lesser extent other industrializing nations such as England and Germany—departed from this historical pattern. It was then that American businesspeople and policymakers started to measure progress in dollar amounts, tabulating social welfare based on people’s capacity to generate income. This fundamental shift, in time, transformed the way Americans appraised not only investments and businesses but also their communities, their environment, and even themselves.
Today, well-being may seem hard to quantify in a nonmonetary way, but indeed other metrics—from incarceration rates to life expectancy—have held sway in the course of the country’s history. The turn away from these statistics, and toward financial ones, means that rather than considering how economic developments
could meet Americans’ needs, the default stance—in policy, business, and everyday life—is to assess whether individuals are meeting the exigencies of the economy.
At the turn of the 19th century, it did not appear that financial metrics were going to define Americans’ concept of progress. In 1791, then-Secretary of the Treasury Alexander Hamilton wrote to various Americans across the country, asking them to calculate the moneymaking capacities of their farms, workshops, and families so that he could use that data to create economic indicators for his famous Report on Manufactures. Hamilton was greatly disappointed by the paltry responses he received and had to give up on adding price statistics to his report. Apparently, most Americans in the early republic did not see, count, or put a price on the world as he did.
Until the 1850s, in fact, by far the most popular and dominant form of social measurement in 19th-century America (as in Europe) were a collection of social indicators known then as “moral statistics,” which quantified such phenomena as prostitution, incarceration, literacy, crime, education, insanity, pauperism, life expectancy, and disease. While these moral statistics were laden with paternalism, they nevertheless focused squarely on the physical, social, spiritual, and mental condition of the American people. For better or for worse, they placed human beings at the center of their calculating vision. Their unit of measure was bodies and minds, never dollars and cents.
Yet around the middle of the century, money-based economic indicators began to gain prominence, eventually supplanting moral statistics as the leading benchmarks of American prosperity. This epochal shift can be seen in the national debates over slavery. In the earlier parts of the 19th century, Americans in the North and South wielded moral statistics in order to prove that their society was the more advanced and successful one. In the North, abolitionist newspapers like the Liberty Almanac pointed to the fact that the North had far more students, scholars, libraries, and colleges. In the South, politicians like John Calhoun used dubious data to argue that freedom was bad for black people. The proportion of Northern blacks “who are deaf and dumb, blind, idiots, insane, paupers and in prison,” Calhoun claimed in 1844, was “one out of every six,” while in the South it was “one of every one hundred and fifty-four.”
By the late 1850s, however, most Northern and Southern politicians and businessmen had abandoned such moral statistics in favor of economic metrics. In the opening chapter of his best-selling 1857 book against slavery, the author Hinton Helper measured the “progress and prosperity” of the North and the South by tabulating the cash value of agricultural produce that both regions had extracted from the earth. In so doing, he calculated that in 1850 the North was clearly the more advanced society, for it had produced $351,709,703 of goods and the South only $306,927,067. Speaking the language of productivity, Helper’s book became a hit with Northern businessmen, turning many men of capital to the antislavery cause.
The Southern planter class, meanwhile, underwent a similar shift. When South Carolina’s governor, the planter and enslaver James Henry Hammond, sought to legitimize slavery in his famous 1858 “Cotton Is King” speech, he did so in part by declaring that “there is not a nation on the face of the earth, with any numerous population, that can compete with us in produce per capita … It amounts to $16.66 per head.”
What happened in the mid-19th century that led to this historically unprecedented pricing of progress? The short answer is straightforward enough: Capitalism happened. In the first few decades of the Republic, the United States developed into a commercial society, but not yet a fully capitalist one. One of the main elements that distinguishes capitalism from other forms of social and cultural organization is not just the existence of markets but also of capitalized investment, the act through which basic elements of society and life—including natural resources, technological discoveries, works of art, urban spaces, educational institutions, human beings, and nations—are transformed (or “capitalized”) into income-generating assets that are valued and allocated in accordance with their capacity to make money and yield future returns. Save for a smattering of government-issued bonds and insurance companies, such a capitalization of everyday life was mostly absent until the mid-19th century. There existed few assets in early America through which one could invest wealth and earn an annual return.
Capitalization, then, was crucial to the rise of economic indicators. As upper-class Americans in both the North and South began to plow their wealth into novel financial assets, they began to imagine not only their portfolio but their entire society as a capitalized investment and its inhabitants (free or enslaved) as inputs of human capital that could be plugged into output-maximizing equations of monetized growth.
In the North, such investments mostly took the form of urban real estate and companies that were building railroads. As capital flowed into these new channels, investors were putting money—via loans, bonds, stocks, banks, trusts, mortgages, and other financial instruments—into communities they might never even set foot in. As local businesspeople and producers lost significant power to these distant East Coast investors, a national business class came into being that cared less about moral statistics—say, the number of prostitutes in Peoria or drunks in Detroit—than about a town’s industrial output, population growth, real-estate prices, labor costs, railway traffic, and per-capita productivity.
Capitalization was also behind the statistical shift in the South, only there it was less about investment in railroad stocks or urban real estate than in human bodies. Enslaved people had long been seen as pieces of property in the United States, but only in the antebellum Deep South did they truly become pieces of capital that could be mortgaged, rented, insured, and sold in highly liquid markets. Viewing enslaved people first and foremost as income-yielding investments, planters began to keep careful track of their market output and value. Hammond, in his speech, had chosen to measure American prosperity in the same way that he valued, monitored, and disciplined those forced to work on his own cotton plantation.
As corporate consolidation and factories’ technological capabilities ramped up in the Gilded Age and Progressive Era, additional techniques of capitalist quantification seeped from the business world into other facets of American society. By the Progressive Era, the logic of money could be found everywhere. “An eight-pound baby is worth, at birth, $362 a pound,” declared TheNew York Times on January 30th, 1910. “That is a child’s value as a potential wealth-producer. If he lives out the normal term of years, he can produce $2900 more wealth than it costs to rear him and maintain him as an adult.” The title of this article was “What the Baby Is Worth as a National Asset: Last Year’s Crop Reached a Value Estimated at $6,960,000,000.” During this era, an array of Progressive reformers priced not only babies but the annual social cost of everything from intemperance ($2 billion), the common cold ($21 a month per employee), typhoid ($271 million), and housewife labor ($7.5 billion), as well as the annual social benefit of skunks ($3 million), Niagara Falls ($122.5 million), and government health insurance ($3 billion).
This particular way of thinking is still around, and hard to miss today in reports from the government, research organizations, and the media. For instance, researchers in this century have calculated the annual cost of excessive alcohol consumption ($223.5 billion) and of mental disorders ($467 billion), as well as the value of the average American life ($9.1 million according to one Obama-era government estimate, up from $6.8 million at one point during George W. Bush’s presidency).
A century ago, money-based ideas of progress resonated most with business executives, most of whom were well-to-do white men. Measuring prosperity according to the Dow Jones Industrial Average (invented in 1896), manufacturing output, or per-capita wealth made a good deal of sense for America’s upper classes, since they were usually the ones who possessed the stocks, owned the factories, and held the wealth. As recognized by the Yale economist Irving Fisher, a man who rarely met a social problem he did not put a price on, economic statistics could be potent in early-20th-century political debates. In arguing for why people needed to be treated as “money-making machines,” Fisher explained how “newspapers showed a strong aversion to the harrowing side of the tuberculosis campaign but were always ready to ‘sit up and take notice’ when the cost of tuberculosis in dollars and cents was mentioned.”
John Rockefeller Jr., J.P. Morgan, and other millionaire capitalists also came to recognize the power of financial metrics in their era. They began to plan for a private research bureau that would focus on the pricing of everyday life. Those plans came to fruition in the 1920s with the formation of the corporate-funded National Bureau of Economic Research. The private institution would go on to play a major role in the invention of Gross Net Product in the 1930s (and continues to operate today).
Many working-class Americans, though, were not as enthusiastic about the rise of economic indicators. This was largely because they believed the human experience to be “priceless” (a word that took off just as progress became conceptualized in terms of money) and because they (astutely) viewed such figures as tools that could be used to justify increased production quotas, more control over workers, or reduced wages. Massachusetts labor activists fighting for the eight-hour workday spoke for many American workers when they said, in 1870, that “the true prosperity and abiding good of the commonwealth can only be learned, by placing money [on] one scale, and man [on another].”
The assignment of prices to features of daily life, therefore, was never a foregone conclusion but rather a highly contested development. In the Gilded Age, some labor unions and Populist farmers succeeded in pushing state bureaus of labor statistics to offer up a series of alternative metrics that measured not economic growth or market output, but rather urban poverty, gender discrimination, leisure time, indebtedness, class mobility, rent-seeking behavior, and exploitation of workers. The interests of businessmen, though, won the day more often than not, and by the mid-20th century economic indicators that focused on monetary output came to be seen as apolitical and objective.
That shift carried tremendous social ramifications: The necessary conditions for economic growth were frequently placed before the necessary conditions for individuals’ well-being. In 1911, Frederick Winslow Taylor, the efficiency expert who dreamed of measuring every human movement in terms of its cost to employers, bluntly articulated this reversal of ends and means: “In the past the man has been first; in the future the system must be first.”
In the end, men like Taylor got their wish. Since the mid-20th century—whether in the Keynesian 1950s or the neoliberal 1980s—economic indicators have promoted an idea of American society as a capital investment whose main goal, like that of any investment, is ever-increasing monetary growth. Americans have surely benefited materially from the remarkable economic growth over this period of time, an expansion wholly unique to capitalist societies. Nevertheless, by making capital accumulation synonymous with progress, money-based metrics have turned human betterment into a secondary concern. By the early 21st century, American society’s top priority became its bottom line, net worth became synonymous with self-worth, and a billionaire businessman who repeatedly pointed to his own wealth as proof of his fitness for office was elected president.
====== MA THEREFORE MEASURE AND CALCULATE E-MONEY MATIC ======


 [equ. 1]
 [equ. 2]

 [equ. 3]
 [equ. 4]
 [equ. 5]
 [equ. 6]


/GettyImages-179708575-57a57c2d5f9b58974aeac9b7.jpg)