


With respect to the importance of a currency for each country with a very fast, precise and efficient and correct transaction process, it is necessary to have an electronic currency transaction which will provide a sense of security and comfort as well as the accuracy of both time and value for the user of the currency or user. at the time when my graduate studies in business and finance in the year 1996 - 1999 seen that at that time currency transactions are still using the currency of currency means currency in the form of liquid transactions are very difficult and not easy in the transaction because the required amount and paper money for enormous amounts of money for money-making transactions that may make us impractical in the use of money and inflexible for the users of every citizen. A global currency is one that is accepted for trade throughout the world. Some of the world's currencies are accepted for most international transactions. The most popular are the U.S. dollar, the euro, and the yen. Another name for global currency is reserve currency.
Gen . Mac Tech
Electronic Transfer Account The Low-Cost Way To Receive Federal Benefits
The benefits of "electronic" banking--and Direct Deposit in particular--include convenience, immediate access to deposits and personal safety. You no longer need to make a trip to the bank or grocery store to cash your check, wait for a check to clear, or carry large amounts of cash.
To encourage Federal check recipients to consider an account at a financial institution and use Direct Deposit, the Department of the Treasury recently introduced an easy and affordable option-the Electronic Transfer Account (ETA). The new ETA is available through participating Federally insured financial institutions, including banks, savings and loans, and credit unions.
The account, which provides the full range of consumer protections, is available to any one who receives a Federal benefit, wage, salary or retirement payment. Features of an ETA include-
- a maximum cost of $3.00 per month;
- a minimum of four cash withdrawals per month.
- Your bank, savings and loan, or credit union will tell you whether you can get your money from a teller, an Automated Teller Machine (ATM) or both. If you use ATMs at certain locations - it may cost extra;
- no minimum balance, unless the law requires it;
- a monthly statement listing all deposits and withdrawals; and
- federally insured accounts.
Electronic Concept for Electronic Transfer Account or study compare
Switch Soft Starter – Principle and Working
A soft starter is any device which controls the acceleration of an electric motor by means of controlling the applied voltage.
Now let us have a brief recall of the need for having a starter for any motor.
An Induction motor has the ability to self start owing to the interaction between the rotating magnetic field flux and the rotor winding flux, causing a high rotor current as torque is increased. As a result the stator draws high current and by the time the motor reaches to full speed, a large amount of current (greater than the rated current) is drawn and this can cause heating up of the motor, eventually damaging it. To prevent this, motor starters are needed.
Motor starting can be in 3 ways
- Applying full load voltage at intervals of time: Direct On Line Starting
- Applying reduced voltage gradually : Star Delta Starter and Soft starter
- Applying part winding starting: Autotransformer starter
Defining Soft Starting
Now let us shift our particular attention to soft starting.
In technical terms, a soft starter is any device which reduces the torque applied to the electric motor. It generally consists of solid state devices like thyristors to control the application of supply voltage to the motor. The starter works on the fact that the torque is proportional to the square of the starting current, which in turn is proportional to the applied voltage. Thus the torque and the current can be adjusted by reducing the voltage at the time of starting the motor.
There can be two types of control using soft starter:
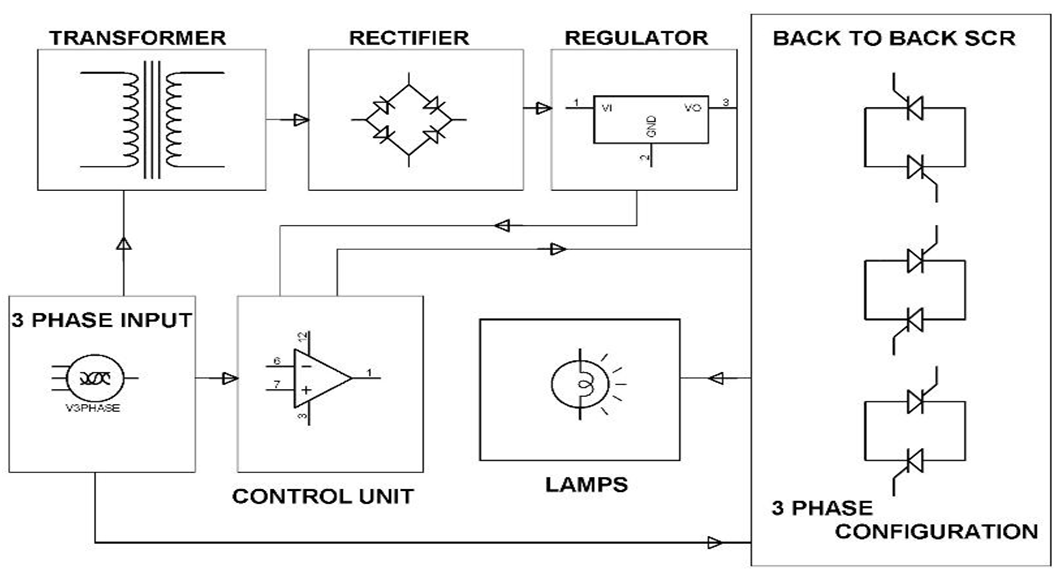
Open Control: A start voltage is applied with time, irrespective of the current drawn or the speed of the motor. For each phase two SCRs are connected back to back and the SCRs are conducted initially at a delay of 180 degrees during the respective half wave cycles (for which each SCR conducts). This delay is reduced gradually with time until the applied voltage ramps up to the full supply voltage. This is also known as Time Voltage Ramp System. This method is not relevant as it doesn’t actually control the motor acceleration.
Closed Loop Control: Any of the motor output characteristics like the current drawn or the speed is monitored and the starting voltage is modified accordingly to get the required response. The current in each phase is monitored and if it exceeds a certain set point, the time voltage ramp is halted.
Thus basic principle of soft starter is by controlling the conduction angle of the SCRs the application of supply voltage can be controlled.
2 Components of a basic soft starter
- Power switches like SCRs which need to be phase controlled such that they are applied for each part of the cycle. For a 3 phase motor, two SCRs are connected back to back for each phase. The switching devices need to be rated at least three times more than the line voltage.
- Control Logic using PID controllers or Microcontrollers or any other logic to control the application of gate voltage to the SCR, i.e. to control the firing angle of SCRs in order to make the SCR conduct at the required part of the supply voltage cycle.
Working Example of Electronic Soft Start System for 3 phase induction motor
The system consists of the following components.
- Two back to back SCRs for each phase, i.e. 6 SCRs in total.
- Control Logic circuitry in form of two comparators- LM324 and LM339 to produce the level and the ramp voltage and an opto-isolator to control the application of gate voltage to the each SCR in each phase.
A power supply circuitry to provide the required dc supply voltage.
The level voltage is generated using the comparator LM324 whose inverting terminal is fed using a fixed voltage source and the non inverting terminal is fed through a capacitor connected to the collector of an NPN transistor. The charging and discharging of the capacitor causes the output of the comparator to change accordingly and the voltage level to change from high to low. This output level voltage is applied to the non inverting terminal of another comparator LM339 whose inverting terminal is fed using a ramp voltage. This ramp voltage is produced using another comparator LM339 which compares the pulsating DC voltage applied at its inverting terminal to the pure DC voltage at its non inverting terminal and generates a zero voltage reference signal which is converted to a ramp signal by the charging and discharging of a electrolyte capacitor.
The 3rd comparator LM339 produces a High pulse width signal for every high level voltage, which decreases gradually as the level voltage reduces. This signal is inverted and applied to the Opto isolator, which provides gate pulses to the SCRs. As voltage level falls, the pulse width of the Opto isolator increases and more the pulse width, lesser is the delay and gradually the SCR is triggered without any delay. Thus by controlling the duration between the pulses or delay between applications of pulses, the firing angle of SCR is controlled and the application of supply current is controlled, thus controlling the motor output torque.
The whole process is actually an open loop control system where the time of application of gate triggering pulses to each SCR is controlled based on the how earlier the ramp voltage decreases from the level voltage.
Advantages of Soft Start
Now that we have learnt about how an electronic soft start system works, let us recollect few reasons why it is preferred over other methods.
- Improved Efficiency: The efficiency of soft starter system using solid state switches is more owing to the low on state voltage.
- Controlled startup: The starting current can be controlled smoothly by easily altering the starting voltage and this ensures smooth starting of the motor without any jerks.
- Controlled acceleration: Motor acceleration is controlled smoothly.
- Low Cost and size: This is ensured with the use of solid state switches.
Battery Management Systems in Electric and Hybrid Vehicles
The battery management system (BMS) is a critical component of electric and hybrid electric vehicles. The purpose of the BMS is to guarantee safe and reliable battery operation. To maintain the safety and reliability of the battery, state monitoring and evaluation, charge control, and cell balancing are functionalities that have been implemented in BMS. As an electrochemical product, a battery acts differently under different operational and environmental conditions. The uncertainty of a battery’s performance poses a challenge to the implementation of these functions. This paper addresses concerns for current BMSs. State evaluation of a battery, including state of charge, state of health, and state of life, is a critical task for a BMS. Through reviewing the latest methodologies for the state evaluation of batteries, the future challenges for BMSs are presented and possible solutions are proposed as well.
Opinions on transactions demand
We have a list of opinions about transactions demand and you can also give us your opinion about it.We will see other people's opinions about transactions demand and we will find out what the others say about it.
Also, We will see opinions about other terms. Do not forget to leave our opinion about this topic and others related.

In the image below, you can see a graph with the evolution of the times that people look for transactions demand. And below it, you can see how many pieces of news have been created about transactions demand in the last years.
we can see the interest transactions demand has and the evolution of its popularity.
we can see the interest transactions demand has and the evolution of its popularity.
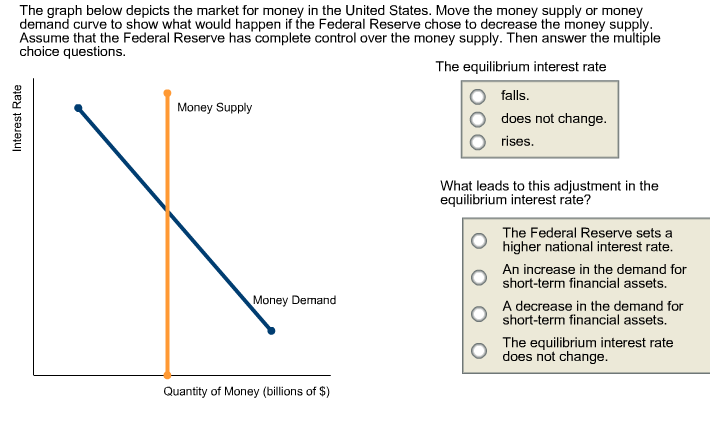
Demand, Supply, and Equilibrium in the Money Market
( Charge , Discharge, and Stabilization in the Money Market For Dollar Adapter )
we will explore the link between money markets, bond markets, and interest rates. We first look at the demand for money. The demand curve for money is derived like any other demand curve, by examining the relationship between the “price” of money (which, we will see, is the interest rate) and the quantity demanded, holding all other determinants unchanged. We then link the demand for money to the concept of money supply developed in the last chapter, to determine the equilibrium rate of interest. In turn, we show how changes in interest rates affect the macro economy.
The Demand for Money
In deciding how much money to hold, people make a choice about how to hold their wealth. How much wealth shall be held as money and how much as other assets? For a given amount of wealth, the answer to this question will depend on the relative costs and benefits of holding money versus other assets. The demand for money is the relationship between the quantity of money people want to hold and the factors that determine that quantity.
To simplify our analysis, we will assume there are only two ways to hold wealth: as money in a checking account, or as funds in a bond market mutual fund that purchases long-term bonds on behalf of its subscribers. A bond fund is not money. Some money deposits earn interest, but the return on these accounts is generally lower than what could be obtained in a bond fund. The advantage of checking accounts is that they are highly liquid and can thus be spent easily. We will think of the demand for money as a curve that represents the outcomes of choices between the greater liquidity of money deposits and the higher interest rates that can be earned by holding a bond fund. The difference between the interest rates paid on money deposits and the interest return available from bonds is the cost of holding money.
Motives for Holding Money
One reason people hold their assets as money is so that they can purchase goods and services. The money held for the purchase of goods and services may be for everyday transactions such as buying groceries or paying the rent, or it may be kept on hand for contingencies such as having the funds available to pay to have the car fixed or to pay for a trip to the doctor.
The transactions demand for money is money people hold to pay for goods and services they anticipate buying. When you carry money in your purse or wallet to buy a movie ticket or maintain a checking account balance so you can purchase groceries later in the month, you are holding the money as part of your transactions demand for money.
The money people hold for contingencies represents their precautionary demand for money. Money held for precautionary purposes may include checking account balances kept for possible home repairs or health-care needs. People do not know precisely when the need for such expenditures will occur, but they can prepare for them by holding money so that they’ll have it available when the need arises.
People also hold money for speculative purposes. Bond prices fluctuate constantly. As a result, holders of bonds not only earn interest but experience gains or losses in the value of their assets. Bondholders enjoy gains when bond prices rise and suffer losses when bond prices fall. Because of this, expectations play an important role as a determinant of the demand for bonds. Holding bonds is one alternative to holding money, so these same expectations can affect the demand for money.
John Maynard Keynes, who was an enormously successful speculator in bond markets himself, suggested that bondholders who anticipate a drop in bond prices will try to sell their bonds ahead of the price drop in order to avoid this loss in asset value. Selling a bond means converting it to money. Keynes referred to the speculative demand for money as the money held in response to concern that bond prices and the prices of other financial assets might change.
Of course, money is money. One cannot sort through someone’s checking account and locate which funds are held for transactions and which funds are there because the owner of the account is worried about a drop in bond prices or is taking a precaution. We distinguish money held for different motives in order to understand how the quantity of money demanded will be affected by a key determinant of the demand for money: the interest rate.
Interest Rates and the Demand for Money
The quantity of money people hold to pay for transactions and to satisfy precautionary and speculative demand is likely to vary with the interest rates they can earn from alternative assets such as bonds. When interest rates rise relative to the rates that can be earned on money deposits, people hold less money. When interest rates fall, people hold more money. The logic of these conclusions about the money people hold and interest rates depends on the people’s motives for holding money.
The quantity of money households want to hold varies according to their income and the interest rate; different average quantities of money held can satisfy their transactions and precautionary demands for money. To see why, suppose a household earns and spends $3,000 per month. It spends an equal amount of money each day. For a month with 30 days, that is $100 per day. One way the household could manage this spending would be to leave the money in a checking account, which we will assume pays zero interest. The household would thus have $3,000 in the checking account when the month begins, $2,900 at the end of the first day, $1,500 halfway through the month, and zero at the end of the last day of the month. Averaging the daily balances, we find that the quantity of money the household demands equals $1,500. This approach to money management, which we will call the “cash approach,” has the virtue of simplicity, but the household will earn no interest on its funds.
Consider an alternative money management approach that permits the same pattern of spending. At the beginning of the month, the household deposits $1,000 in its checking account and the other $2,000 in a bond fund. Assume the bond fund pays 1% interest per month, or an annual interest rate of 12.7%. After 10 days, the money in the checking account is exhausted, and the household withdraws another $1,000 from the bond fund for the next 10 days. On the 20th day, the final $1,000 from the bond fund goes into the checking account. With this strategy, the household has an average daily balance of $500, which is the quantity of money it demands. Let us call this money management strategy the “bond fund approach.”
Remember that both approaches allow the household to spend $3,000 per month, $100 per day. The cash approach requires a quantity of money demanded of $1,500, while the bond fund approach lowers this quantity to $500.
The bond fund approach generates some interest income. The household has $1,000 in the fund for 10 days (1/3 of a month) and $1,000 for 20 days (2/3 of a month). With an interest rate of 1% per month, the household earns $10 in interest each month ([$1,000 × 0.01 × 1/3] + [$1,000 × 0.01 × 2/3]). The disadvantage of the bond fund, of course, is that it requires more attention—$1,000 must be transferred from the fund twice each month. There may also be fees associated with the transfers.
Of course, the bond fund strategy we have examined here is just one of many. The household could begin each month with $1,500 in the checking account and $1,500 in the bond fund, transferring $1,500 to the checking account midway through the month. This strategy requires one less transfer, but it also generates less interest—$7.50 (= $1,500 × 0.01 × 1/2). With this strategy, the household demands a quantity of money of $750. The household could also maintain a much smaller average quantity of money in its checking account and keep more in its bond fund. For simplicity, we can think of any strategy that involves transferring money in and out of a bond fund or another interest-earning asset as a bond fund strategy.
Which approach should the household use? That is a choice each household must make—it is a question of weighing the interest a bond fund strategy creates against the hassle and possible fees associated with the transfers it requires. Our example does not yield a clear-cut choice for any one household, but we can make some generalizations about its implications.
First, a household is more likely to adopt a bond fund strategy when the interest rate is higher. At low interest rates, a household does not sacrifice much income by pursuing the simpler cash strategy. As the interest rate rises, a bond fund strategy becomes more attractive. That means that the higher the interest rate, the lower the quantity of money demanded.
Second, people are more likely to use a bond fund strategy when the cost of transferring funds is lower. The creation of savings plans, which began in the 1970s and 1980s, that allowed easy transfer of funds between interest-earning assets and checkable deposits tended to reduce the demand for money.
Some money deposits, such as savings accounts and money market deposit accounts, pay interest. In evaluating the choice between holding assets as some form of money or in other forms such as bonds, households will look at the differential between what those funds pay and what they could earn in the bond market. A higher interest rate in the bond market is likely to increase this differential; a lower interest rate will reduce it. An increase in the spread between rates on money deposits and the interest rate in the bond market reduces the quantity of money demanded; a reduction in the spread increases the quantity of money demanded.
Firms, too, must determine how to manage their earnings and expenditures. However, instead of worrying about $3,000 per month, even a relatively small firm may be concerned about $3,000,000 per month. Rather than facing the difference of $10 versus $7.50 in interest earnings used in our household example, this small firm would face a difference of $2,500 per month ($10,000 versus $7,500). For very large firms such as Toyota or AT&T, interest rate differentials among various forms of holding their financial assets translate into millions of dollars per day.
How is the speculative demand for money related to interest rates? When financial investors believe that the prices of bonds and other assets will fall, their speculative demand for money goes up. The speculative demand for money thus depends on expectations about future changes in asset prices. Will this demand also be affected by present interest rates?
If interest rates are low, bond prices are high. It seems likely that if bond prices are high, financial investors will become concerned that bond prices might fall. That suggests that high bond prices—low interest rates—would increase the quantity of money held for speculative purposes. Conversely, if bond prices are already relatively low, it is likely that fewer financial investors will expect them to fall still further. They will hold smaller speculative balances. Economists thus expect that the quantity of money demanded for speculative reasons will vary negatively with the interest rate.
The Demand Curve for Money
We have seen that the transactions, precautionary, and speculative demands for money vary negatively with the interest rate. Putting those three sources of demand together, we can draw a demand curve for money to show how the interest rate affects the total quantity of money people hold. The demand curve for money shows the quantity of money demanded at each interest rate, all other things unchanged. Such a curve is shown in Figure 25.7 “The Demand Curve for Money”. An increase in the interest rate reduces the quantity of money demanded. A reduction in the interest rate increases the quantity of money demanded.
Figure 25.7 The Demand Curve for Money

The demand curve for money shows the quantity of money demanded at each interest rate. Its downward slope expresses the negative relationship between the quantity of money demanded and the interest rate.
The relationship between interest rates and the quantity of money demanded is an application of the law of demand. If we think of the alternative to holding money as holding bonds, then the interest rate—or the differential between the interest rate in the bond market and the interest paid on money deposits—represents the price of holding money. As is the case with all goods and services, an increase in price reduces the quantity demanded.
Other Determinants of the Demand for Money
We draw the demand curve for money to show the quantity of money people will hold at each interest rate, all other determinants of money demand unchanged. A change in those “other determinants” will shift the demand for money. Among the most important variables that can shift the demand for money are the level of income and real GDP, the price level, expectations, transfer costs, and preferences.
Real GDP
A household with an income of $10,000 per month is likely to demand a larger quantity of money than a household with an income of $1,000 per month. That relationship suggests that money is a normal good: as income increases, people demand more money at each interest rate, and as income falls, they demand less.
An increase in real GDP increases incomes throughout the economy. The demand for money in the economy is therefore likely to be greater when real GDP is greater.
The Price Level
The higher the price level, the more money is required to purchase a given quantity of goods and services. All other things unchanged, the higher the price level, the greater the demand for money.
Expectations
The speculative demand for money is based on expectations about bond prices. All other things unchanged, if people expect bond prices to fall, they will increase their demand for money. If they expect bond prices to rise, they will reduce their demand for money.
The expectation that bond prices are about to change actually causes bond prices to change. If people expect bond prices to fall, for example, they will sell their bonds, exchanging them for money. That will shift the supply curve for bonds to the right, thus lowering their price. The importance of expectations in moving markets can lead to a self-fulfilling prophecy.
Expectations about future price levels also affect the demand for money. The expectation of a higher price level means that people expect the money they are holding to fall in value. Given that expectation, they are likely to hold less of it in anticipation of a jump in prices.
Expectations about future price levels play a particularly important role during periods of hyperinflation. If prices rise very rapidly and people expect them to continue rising, people are likely to try to reduce the amount of money they hold, knowing that it will fall in value as it sits in their wallets or their bank accounts. Toward the end of the great German hyperinflation of the early 1920s, prices were doubling as often as three times a day. Under those circumstances, people tried not to hold money even for a few minutes—within the space of eight hours money would lose half its value!
Transfer Costs
For a given level of expenditures, reducing the quantity of money demanded requires more frequent transfers between nonmoney and money deposits. As the cost of such transfers rises, some consumers will choose to make fewer of them. They will therefore increase the quantity of money they demand. In general, the demand for money will increase as it becomes more expensive to transfer between money and nonmoney accounts. The demand for money will fall if transfer costs decline. In recent years, transfer costs have fallen, leading to a decrease in money demand.
Preferences
Preferences also play a role in determining the demand for money. Some people place a high value on having a considerable amount of money on hand. For others, this may not be important.
Household attitudes toward risk are another aspect of preferences that affect money demand. As we have seen, bonds pay higher interest rates than money deposits, but holding bonds entails a risk that bond prices might fall. There is also a chance that the issuer of a bond will default, that is, will not pay the amount specified on the bond to bondholders; indeed, bond issuers may end up paying nothing at all. A money deposit, such as a savings deposit, might earn a lower yield, but it is a safe yield. People’s attitudes about the trade-off between risk and yields affect the degree to which they hold their wealth as money. Heightened concerns about risk in the last half of 2008 led many households to increase their demand for money.
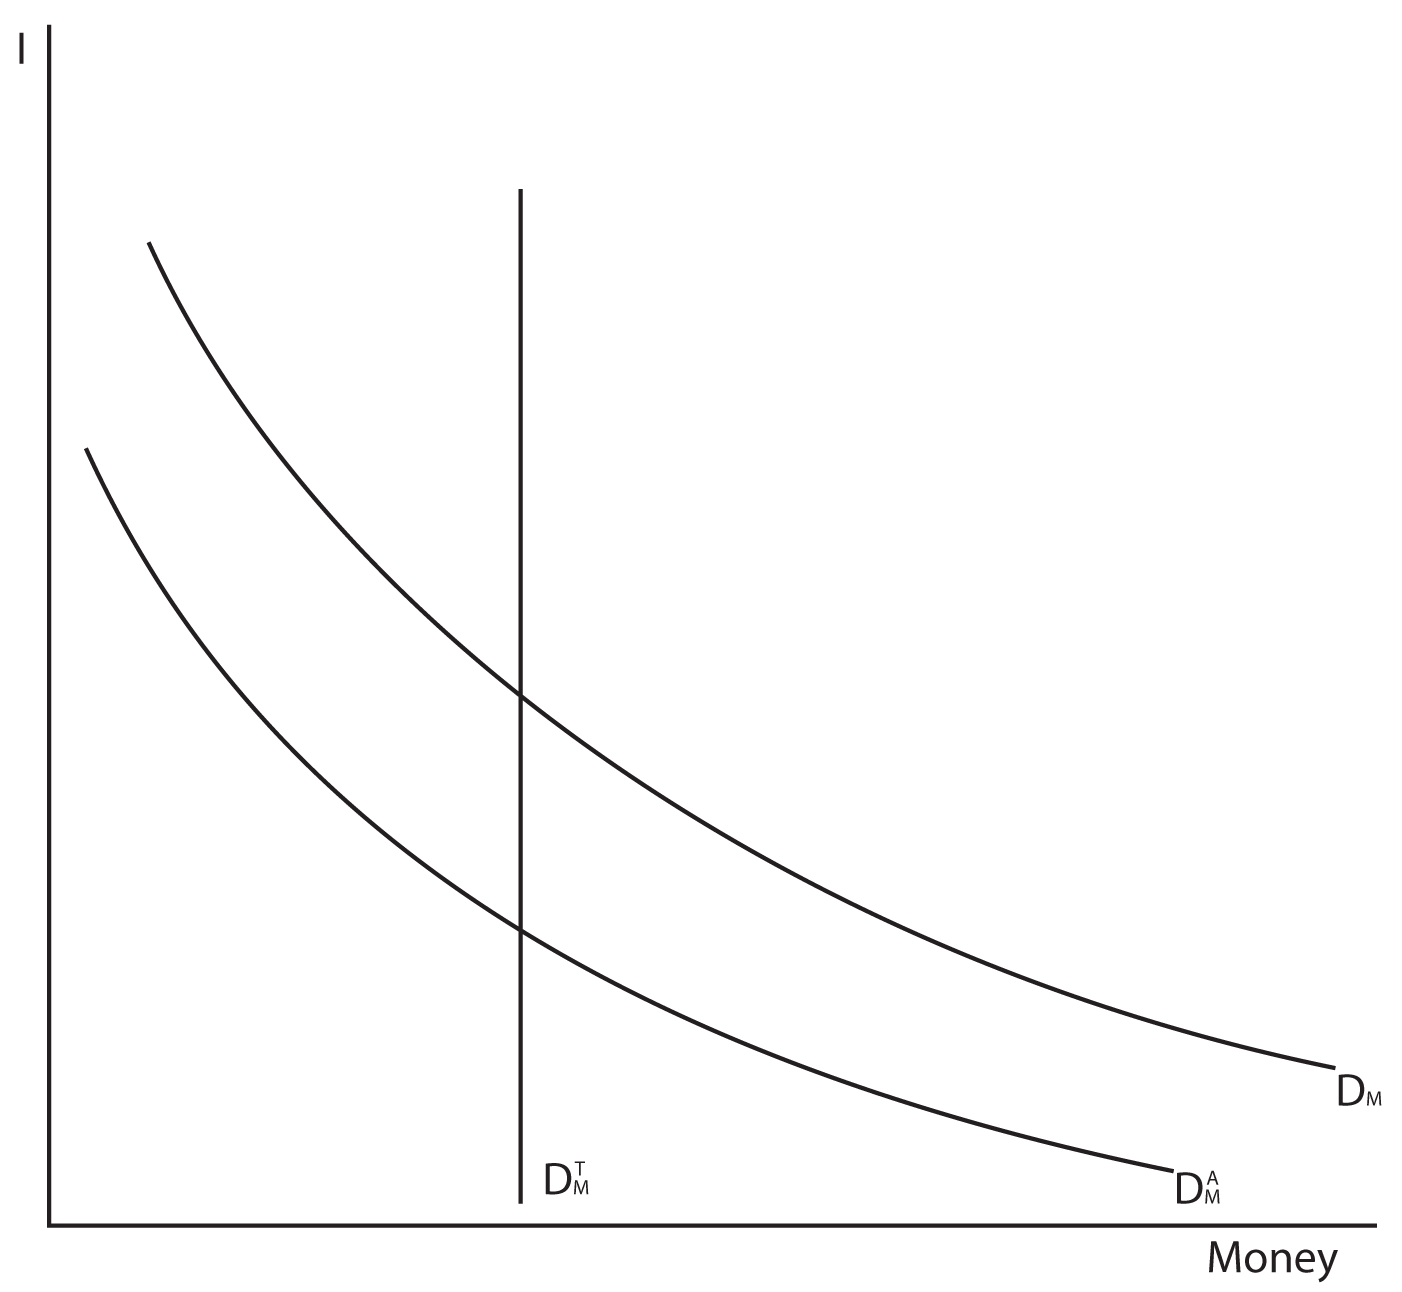
Figure 25.8 “An Increase in Money Demand” shows an increase in the demand for money. Such an increase could result from a higher real GDP, a higher price level, a change in expectations, an increase in transfer costs, or a change in preferences.
Figure 25.8 An Increase in Money Demand

An increase in real GDP, the price level, or transfer costs, for example, will increase the quantity of money demanded at any interest rate r, increasing the demand for money from D1 to D2. The quantity of money demanded at interest rate r rises from M to M′. The reverse of any such events would reduce the quantity of money demanded at every interest rate, shifting the demand curve to the left.
The Supply of Money
The supply curve of money shows the relationship between the quantity of money supplied and the market interest rate, all other determinants of supply unchanged. We have learned that the Fed, through its open-market operations, determines the total quantity of reserves in the banking system. We shall assume that banks increase the money supply in fixed proportion to their reserves. Because the quantity of reserves is determined by Federal Reserve policy, we draw the supply curve of money in Figure 25.9 “The Supply Curve of Money” as a vertical line, determined by the Fed’s monetary policies. In drawing the supply curve of money as a vertical line, we are assuming the money supply does not depend on the interest rate. Changing the quantity of reserves and hence the money supply is an example of monetary policy.
Figure 25.9 The Supply Curve of Money

We assume that the quantity of money supplied in the economy is determined as a fixed multiple of the quantity of bank reserves, which is determined by the Fed. The supply curve of money is a vertical line at that quantity.
Equilibrium in the Market for Money
The money market is the interaction among institutions through which money is supplied to individuals, firms, and other institutions that demand money. Money market equilibrium occurs at the interest rate at which the quantity of money demanded is equal to the quantity of money supplied. Figure 25.10 “Money Market Equilibrium” combines demand and supply curves for money to illustrate equilibrium in the market for money. With a stock of money (M), the equilibrium interest rate is r.
Figure 25.10 Money Market Equilibrium

The market for money is in equilibrium if the quantity of money demanded is equal to the quantity of money supplied. Here, equilibrium occurs at interest rate r.
Effects of Changes in the Money Market
A shift in money demand or supply will lead to a change in the equilibrium interest rate. Let’s look at the effects of such changes on the economy.
Changes in Money Demand
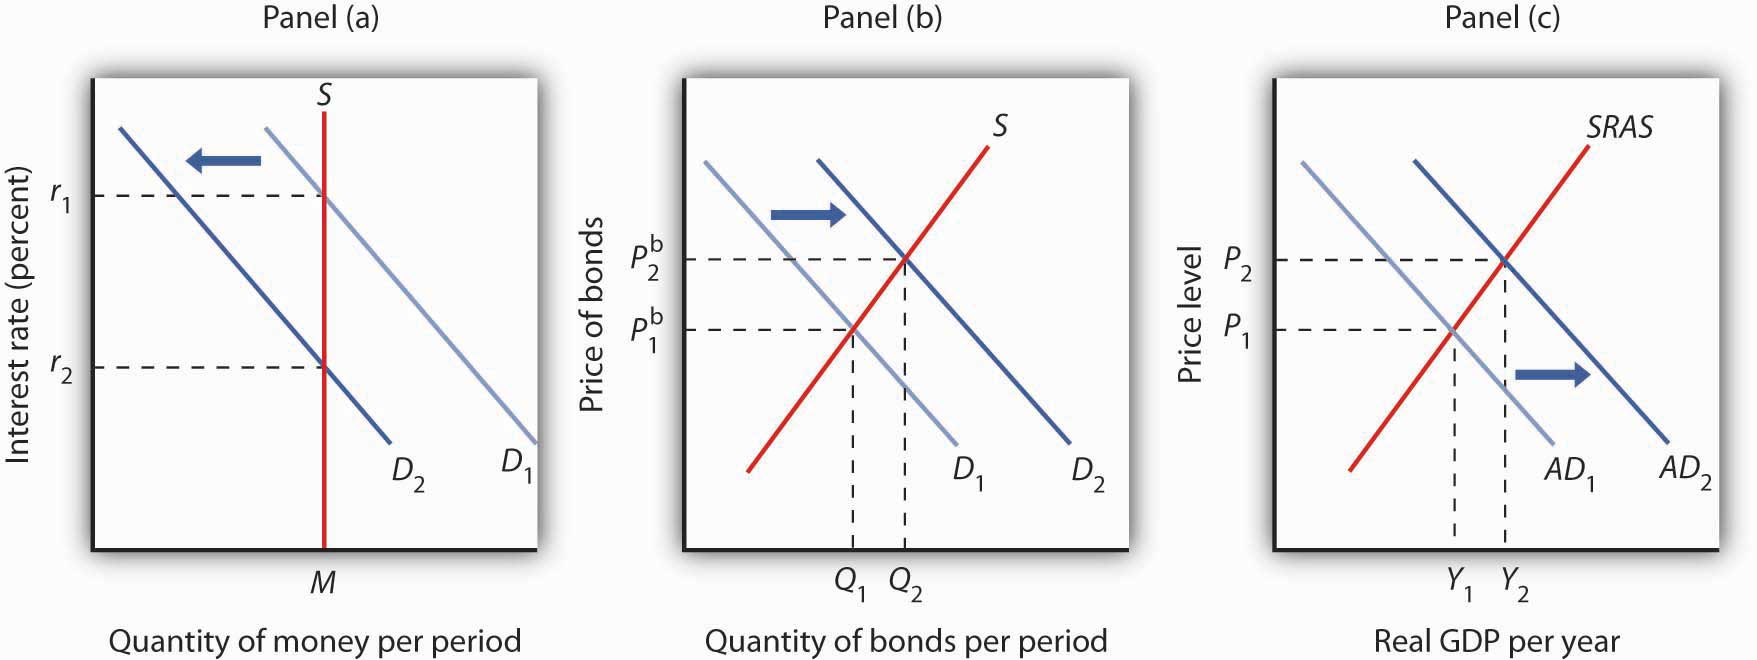
Suppose that the money market is initially in equilibrium at r1 with supply curve S and a demand curve D1 as shown in Panel (a) of Figure 25.11 “A Decrease in the Demand for Money”. Now suppose that there is a decrease in money demand, all other things unchanged. A decrease in money demand could result from a decrease in the cost of transferring between money and nonmoney deposits, from a change in expectations, or from a change in preferences1. Panel (a) shows that the money demand curve shifts to the left to D2. We can see that the interest rate will fall to r2. To see why the interest rate falls, we recall that if people want to hold less money, then they will want to hold more bonds. Thus, Panel (b) shows that the demand for bonds increases. The higher price of bonds means lower interest rates; lower interest rates restore equilibrium in the money market.
Figure 25.11 A Decrease in the Demand for Money

A decrease in the demand for money due to a change in transactions costs, preferences, or expectations, as shown in Panel (a), will be accompanied by an increase in the demand for bonds as shown in Panel (b), and a fall in the interest rate. The fall in the interest rate will cause a rightward shift in the aggregate demand curve from AD1 to AD2, as shown in Panel (c). As a result, real GDP and the price level rise.
Lower interest rates in turn increase the quantity of investment. They also stimulate net exports, as lower interest rates lead to a lower exchange rate. The aggregate demand curve shifts to the right as shown in Panel (c) from AD1 to AD2. Given the short-run aggregate supply curve SRAS, the economy moves to a higher real GDP and a higher price level.
An increase in money demand due to a change in expectations, preferences, or transactions costs that make people want to hold more money at each interest rate will have the opposite effect. The money demand curve will shift to the right and the demand for bonds will shift to the left. The resulting higher interest rate will lead to a lower quantity of investment. Also, higher interest rates will lead to a higher exchange rate and depress net exports. Thus, the aggregate demand curve will shift to the left. All other things unchanged, real GDP and the price level will fall.
Changes in the Money Supply
Now suppose the market for money is in equilibrium and the Fed changes the money supply. All other things unchanged, how will this change in the money supply affect the equilibrium interest rate and aggregate demand, real GDP, and the price level?
Suppose the Fed conducts open-market operations in which it buys bonds. This is an example of expansionary monetary policy. The impact of Fed bond purchases is illustrated in Panel (a) of Figure 25.12 “An Increase in the Money Supply”. The Fed’s purchase of bonds shifts the demand curve for bonds to the right, raising bond prices to Pb2. As we learned, when the Fed buys bonds, the supply of money increases. Panel (b) of Figure 25.12 “An Increase in the Money Supply” shows an economy with a money supply of M, which is in equilibrium at an interest rate of r1. Now suppose the bond purchases by the Fed as shown in Panel (a) result in an increase in the money supply to M′; that policy change shifts the supply curve for money to the right to S2. At the original interest rate r1, people do not wish to hold the newly supplied money; they would prefer to hold nonmoney assets. To reestablish equilibrium in the money market, the interest rate must fall to increase the quantity of money demanded. In the economy shown, the interest rate must fall to r2 to increase the quantity of money demanded to M′.
Figure 25.12 An Increase in the Money Supply

The Fed increases the money supply by buying bonds, increasing the demand for bonds in Panel (a) from D1 to D2 and the price of bonds to Pb2. This corresponds to an increase in the money supply to M′ in Panel (b). The interest rate must fall to r2to achieve equilibrium. The lower interest rate leads to an increase in investment and net exports, which shifts the aggregate demand curve from AD1 to AD2 in Panel (c). Real GDP and the price level rise.
The reduction in interest rates required to restore equilibrium to the market for money after an increase in the money supply is achieved in the bond market. The increase in bond prices lowers interest rates, which will increase the quantity of money people demand. Lower interest rates will stimulate investment and net exports, via changes in the foreign exchange market, and cause the aggregate demand curve to shift to the right, as shown in Panel (c), from AD1 to AD2. Given the short-run aggregate supply curve SRAS, the economy moves to a higher real GDP and a higher price level.
Open-market operations in which the Fed sells bonds—that is, a contractionary monetary policy—will have the opposite effect. When the Fed sells bonds, the supply curve of bonds shifts to the right and the price of bonds falls. The bond sales lead to a reduction in the money supply, causing the money supply curve to shift to the left and raising the equilibrium interest rate. Higher interest rates lead to a shift in the aggregate demand curve to the left.
As we have seen in looking at both changes in demand for and in supply of money, the process of achieving equilibrium in the money market works in tandem with the achievement of equilibrium in the bond market. The interest rate determined by money market equilibrium is consistent with the interest rate achieved in the bond market.
Key Takeaways
- People hold money in order to buy goods and services (transactions demand), to have it available for contingencies (precautionary demand), and in order to avoid possible drops in the value of other assets such as bonds (speculative demand).
- The higher the interest rate, the lower the quantities of money demanded for transactions, for precautionary, and for speculative purposes. The lower the interest rate, the higher the quantities of money demanded for these purposes.
- The demand for money will change as a result of a change in real GDP, the price level, transfer costs, expectations, or preferences.
- We assume that the supply of money is determined by the Fed. The supply curve for money is thus a vertical line. Money market equilibrium occurs at the interest rate at which the quantity of money demanded equals the quantity of money supplied.
- All other things unchanged, a shift in money demand or supply will lead to a change in the equilibrium interest rate and therefore to changes in the level of real GDP and the price level.
Try It!
In 2005 the Fed was concerned about the possibility that the United States was moving into an inflationary gap, and it adopted a contractionary monetary policy as a result. Draw a four-panel graph showing this policy and its expected results. In Panel (a), use the model of aggregate demand and aggregate supply to illustrate an economy with an inflationary gap. In Panel (b), show how the Fed’s policy will affect the market for bonds. In Panel (c), show how it will affect the demand for and supply of money. In Panel (d), show how it will affect the exchange rate. Finally, return to Panel (a) and incorporate these developments into your analysis of aggregate demand and aggregate supply, and show how the Fed’s policy will affect real GDP and the price level in the short run.
Case in Point: Money in Today’s World
Figure 25.13

Can Pac Swire – Hong Kong/ Travel Wallet – CC BY-NC 2.0.
The models of the money and bond markets presented in this chapter suggest that the Fed can control the interest rate by deciding on a money supply that would lead to the desired equilibrium interest rate in the money market. Yet, Fed policy announcements typically focus on what it wants the federal funds rate to be with scant attention to the money supply. Whereas throughout the 1990s, the Fed would announce a target federal funds rate and also indicate an expected change in the money supply, in 2000, when legislation requiring it to do so expired, it abandoned the practice of setting money supply targets.
Why the shift? The factors that have made focusing on the money supply as a policy target difficult for the past 25 years are first banking deregulation in the 1980s followed by financial innovations associated with technological changes—in particular the maturation of electronic payment and transfer mechanisms—thereafter.
Before the 1980s, M1 was a fairly reliable measure of the money people held, primarily for transactions. To buy things, one used cash, checks written on demand deposits, or traveler’s checks. The Fed could thus use reliable estimates of the money demand curve to predict what the money supply would need to be in order to bring about a certain interest rate in the money market.
Legislation in the early 1980s allowed for money market deposit accounts (MMDAs), which are essentially interest-bearing savings accounts on which checks can be written. MMDAs are part of M2. Shortly after, other forms of payments for transactions developed or became more common. For example, credit and debit card use has mushroomed (from $10.8 billion in 1990 to $30 billion in 2000), and people can pay their credit card bills, electronically or with paper checks, from accounts that are part of either M1 or M2. Another innovation of the last 20 years is the automatic transfer service (ATS) that allows consumers to move money between checking and savings accounts at an ATM machine, or online, or through prearranged agreements with their financial institutions. While we take these methods of payment for granted today, they did not exist before 1980 because of restrictive banking legislation and the lack of technological know-how. Indeed, before 1980, being able to pay bills from accounts that earned interest was unheard of.
Further blurring the lines between M1 and M2 has been the development and growing popularity of what are called retail sweep programs. Since 1994, banks have been using retail-sweeping software to dynamically reclassify balances as either checking account balances (part of M1) or MMDAs (part of M2). They do this to avoid reserve requirements on checking accounts. The software not only moves the funds but also ensures that the bank does not exceed the legal limit of six reclassifications in any month. In the last 10 years these retail sweeps rose from zero to nearly the size of M1 itself!
Such changes in the ways people pay for transactions and banks do their business have led economists to think about new definitions of money that would better track what is actually used for the purposes behind the money demand curve. One notion is called MZM, which stands for “money zero maturity.” The idea behind MZM is that people can easily use any deposits that do not have specified maturity terms to pay for transactions, as these accounts are quite liquid, regardless of what classification of money they fall into. Some research shows that using MZM allows for a stable picture of the money market. Until more agreement has been reached, though, we should expect the Fed to continue to downplay the role of the money supply in its policy deliberations and to continue to announce its intentions in terms of the federal funds rate.
Source: Pedre Teles and Ruilin Zhou, “A Stable Money Demand: Looking for the Right Monetary Aggregate,” Federal Reserve Bank of Chicago Economic Perspectives 29 (First Quarter, 2005): 50–59.
Answer to Try It! Problem
In Panel (a), with the aggregate demand curve AD1, short-run aggregate supply curve SRAS, and long-run aggregate supply curve LRAS, the economy has an inflationary gap of Y1 − YP. The contractionary monetary policy means that the Fed sells bonds—a rightward shift of the bond supply curve in Panel (b), which decreases the money supply—as shown by a leftward shift in the money supply curve in Panel (c). In Panel (b), we see that the price of bonds falls, and in Panel (c) that the interest rate rises. A higher interest rate will reduce the quantity of investment demanded. The higher interest rate also leads to a higher exchange rate, as shown in Panel (d), as the demand for dollars increases and the supply decreases. The higher exchange rate will lead to a decrease in net exports. As a result of these changes in financial markets, the aggregate demand curve shifts to the left to AD2 in Panel (a). If all goes according to plan (and we will learn in the next chapter that it may not!), the new aggregate demand curve will intersect SRAS and LRAS at YP.
Figure 25.14

1In this chapter we are looking only at changes that originate in financial markets to see their impact on aggregate demand and aggregate supply. Changes in the price level and in real GDP also shift the money demand curve, but these changes are the result of changes in aggregate demand or aggregate supply and are considered in more advanced courses in macroeconomics.
Loanable Funds
The Market for Loanable Funds
When a firm decides to expand its capital stock, it can finance its purchase of capital in several ways. It might already have the funds on hand. It can also raise funds by selling shares of stock, as we discussed in a previous module. When a firm sells stock, it is selling shares of ownership of the firm. It can borrow the funds for the capital from a bank. Another option is to issue and sell its own bonds. A bond is a promise to pay back a certain amount at a certain time. When a firm borrows from a bank or sells bonds, of course, it accepts a liability—it must make interest payments to the bank or the owners of its bonds as they come due.
Regardless of the method of financing chosen, a critical factor in the firm’s decision on whether to acquire and hold capital and on how to finance the capital is the interest rate. The role of the interest rate is obvious when the firm issues its own bonds or borrows from a bank. But even when the firm uses its own funds to purchase the capital, it is forgoing the option of lending those funds directly to other firms by buying their bonds or indirectly by putting the funds in bank accounts, thereby allowing the banks to lend the funds. The interest rate gives the opportunity cost of using funds to acquire capital rather than putting the funds to the best alternative use available to the firm.
The interest rate is determined in a market in the same way that the price of potatoes is determined in a market: by the forces of demand and supply. The market in which borrowers (demanders of funds) and lenders (suppliers of funds) meet is the loanable funds market.
We will simplify our model of the role that the interest rate plays in the demand for capital by ignoring differences in actual interest rates that specific consumers and firms face in the economy. For example, the interest rate on credit cards is higher than the mortgage rate of interest, and large, established companies can borrow funds or issue bonds at lower interest rates than new, start-up companies can. Interest rates that firms face depend on a variety of factors, such as riskiness of the loan, the duration of the loan, and the costs of administering the loan. However, since we will focus on general tendencies that cause interest rates to rise or fall and since the various interest rates in the economy tend to move up and down together, the conclusions we reach about the market for loanable funds and how firms and consumers respond to interest rate changes will still be valid.
The Demand for Loanable Funds
In the previous section we learned that a firm’s decision to acquire and keep capital depends on the net present value of the capital in question, which in turn depends on the interest rate. The lower the interest rate, the greater the amount of capital that firms will want to acquire and hold, since lower interest rates translate into more capital with positive net present values. The desire for more capital means, in turn, a desire for more loanable funds. Similarly, at higher interest rates, less capital will be demanded, because more of the capital in question will have negative net present values. Higher interest rates therefore mean less funding demanded.

Figure 13.2. The Demand and Supply of Loanable Funds. At lower interest rates, firms demand more capital and therefore more loanable funds. The demand for loanable funds is downward-sloping. The supply of loanable funds is generally upward-sloping. The equilibrium interest rate, rE, will be found where the two curves intersect.
Thus the demand for loanable funds is downward-sloping, like the demand for virtually everything else, as shown in Figure 13.2. The lower the interest rate, the more capital firms will demand. The more capital that firms demand, the greater the funding that is required to finance it.
The Supply of Loanable Funds
Lenders are consumers or firms that decide that they are willing to forgo some current use of their funds in order to have more available in the future. Lenders supply funds to the loanable funds market. In general, higher interest rates make the lending option more attractive.
For consumers, however, the decision is a bit more complicated than it is for firms. In examining consumption choices across time, economists think of consumers as having an expected stream of income over their lifetimes. It is that expected income that defines their consumption possibilities. The problem for consumers is to determine when to consume this income. They can spend less of their projected income now and thus have more available in the future. Alternatively, they can boost their current spending by borrowing against their future income.
Saving is income not spent on consumption. (We shall ignore taxes in this analysis.) Dissaving occurs when consumption exceeds income during a period. Dissaving means that the individual’s saving is negative. Dissaving can be financed either by borrowing or by using past savings. Many people, for example, save in preparation for retirement and then dissave during their retirement years.
Saving adds to a household’s wealth. Dissaving reduces it. Indeed, a household’s wealth is the sum of the value of all past saving less all past dissaving.
We can think of saving as a choice to postpone consumption. Because interest rates are a payment paid to people who postpone their use of wealth, interest rates are a kind of reward paid to savers. Will higher interest rates encourage the behavior they reward? The answer is a resounding “maybe.” Just as higher wages might not increase the quantity of labor supplied, higher interest rates might not increase the quantity of saving. The problem, once again, lies in the fact that the income and substitution effects of a change in interest rates will pull in opposite directions.
Consider a hypothetical consumer, choices concerning the timing of consumption by assuming that there are only two periods: the present period is period 0, and the next is period 1. Suppose the interest rate is 8% and his income in both periods is expected to be $30,000.
You could, of course, spend $30,000 in period 0 and $30,000 in period 1. In that case, his saving equals zero in both periods. But he has alternatives. He could, for example, spend more than $30,000 in period 0 by borrowing against his income for period 1. Alternatively, he could spend less than $30,000 in period 0 and use his saving—and the interest he earns on that saving—to boost his consumption in period 1. If, for example, he spends $20,000 in period 0, his saving in period 0 equals $10,000. He will earn $800 interest on that saving, so he will have $40,800 to spend in the next period.
Suppose the interest rate rises to 10%. The increase in the interest rate has boosted the price of current consumption. Now for every $1 he spends in period 0 he gives up $1.10 in consumption in period 1, instead of $1.08, which was the amount that would have been given up in consumption in period 1 when the interest rate was 8%. A higher price produces a substitution effect that reduces an activity—You will spend less in the current period due to the substitution effect. The substitution effect of a higher interest rate thus boosts saving. But the higher interest rate also means that he earns more income on his saving. Consumption in the current period is a normal good, so an increase in income can be expected to increase current consumption. But an increase in current consumption implies a reduction in saving. The income effect of a higher interest rate thus tends to reduce saving. Whether You savings will rise or fall in response to a higher interest rate depends on the relative strengths of the substitution and income effects.
To see how an increase in interest rates might reduce saving, You has decided that his goal is to have $40,800 to spend in period 1. At an interest rate of 10%, he can reduce his saving below $10,000 and still achieve his goal of having $40,800 to spend in the next period. The income effect of the increase in the interest rate has reduced his saving, and consequently his desire to supply funds to the loanable funds market.
Because changes in interest rates produce substitution and income effects that pull saving in opposite directions, we cannot be sure what will happen to saving if interest rates change. The combined effect of all consumers’ and firms’ decisions, however, generally leads to an upward-sloping supply curve for loanable funds, as shown in Figure 13.2. That is, the substitution effect usually dominates the income effect.
The equilibrium interest rate is determined by the intersection of the demand and supply curves in the market for loanable funds.
Capital and the Loanable Funds Market
If the quantity of capital demanded varies inversely with the interest rate, and if the interest rate is determined in the loanable funds market, then it follows that the demand for capital and the loanable funds market are interrelated. Because the acquisition of new capital is generally financed in the loanable funds market, a change in the demand for capital leads to a change in the demand for loanable funds—and that affects the interest rate. A change in the interest rate, in turn, affects the quantity of capital demanded on any demand curve.
The relationship between the demand for capital and the loanable funds market thus goes both ways. Changes in the demand for capital affect the loanable funds market, and changes in the loanable funds market can affect the quantity of capital demanded.
Changes in the Demand for Capital and the Loanable Funds Market
Figure 13.3 suggests how an increased demand for capital by firms will affect the loanable funds market, and thus the quantity of capital firms will demand. In Panel (a) the initial interest rate is r1. At r1 in Panel (b) K1units of capital are demanded (on curve D1). Now suppose an improvement in technology increases the marginal product of capital, shifting the demand curve for capital in Panel (b) to the right to D2. Firms can be expected to finance the increased acquisition of capital by demanding more loanable funds, shifting the demand curve for loanable funds to D2 in Panel (a). The interest rate thus rises to r2. Consequently, in the market for capital the demand for capital is greater and the interest rate is higher. The new quantity of capital demanded is K2on demand curve D2.

Figure 13.3. Loanable Funds and the Demand for Capital. The interest rate is determined in the loanable funds market, and the quantity of capital demanded varies with the interest rate. Thus, events in the loanable funds market and the demand for capital are interrelated. If the demand for capital increases to D2 in Panel (b), the demand for loanable funds is likely to increase as well. Panel (a) shows the result in the loanable funds market—a shift in the demand curve for loanable funds from D1 to D2 and an increase in the interest rate from r1 to r2. At r2, the quantity of capital demanded will be K2, as shown in Panel (b).
Changes in the Loan able Funds Market and the Demand for Capital
Events in the loan able funds market can also affect the quantity of capital firms will hold. Suppose, for example, that consumers decide to increase current consumption and thus to supply fewer funds to the loan able funds market at any interest rate. This change in consumer preferences shifts the supply curve for loan able funds in Panel (a) of Figure 13.4 from S1 to S2 and raises the interest rate to r2. If there is no change in the demand for capital D1, the quantity of capital firms demand falls to K2 in Panel (b).

Figure 13.4. A Change in the Loanable Funds Market and the Quantity of Capital Demanded. A change that begins in the loanable funds market can affect the quantity of capital firms demand. Here, a decrease in consumer saving causes a shift in the supply of loanable funds from S1 to S2 in Panel (a). Assuming there is no change in the demand for capital, the quantity of capital demanded falls from K1 to K2 in Panel (b).
Our model of the relationship between the demand for capital and the loanable funds market thus assumes that the interest rate is determined in the market for loanable funds. Given the demand curve for capital, that interest rate then determines the quantity of capital firms demand.
Table 13.2 shows that a change in the quantity of capital that firms demand can begin with a change in the demand for capital or with a change in the demand for or supply of loan able funds. A change in the demand for capital affects the demand for loan able funds and hence the interest rate in the loan able funds market. The change in the interest rate leads to a change in the quantity of capital demanded. Alternatively, a change in the loan able funds market, which leads to a change in the interest rate, causes a change in quantity of capital demanded.
| Table 13.2 Two Routes to Changes in the Quantity of Capital Demanded | |
| A change originating in the capital market | A change originating in the loanable funds market |
| 1. A change in the demand for capital leads to… | 1. A change in the demand for or supply of loanable funds leads to … |
| 2.…a change in the demand for loanable funds, which leads to… | 2.…a change in the interest rate, which leads to… |
| 3.…a change in the interest rate, which leads to… | 3.…a change in the quantity of capital demanded. |
| 4.…a change in the quantity of capital demanded. |
A change in the quantity of capital that firms demand can begin with a change in the demand for capital or with a change in the demand or supply of loan able funds.
KEY TAKEAWAYS
- The net present value (NPV) of an investment project is equal to the present value of its expected revenues minus the present value of its expected costs. Firms will want to undertake those investments for which the NPV is greater than or equal to zero.
- The demand curve for capital shows that firms demand a greater quantity of capital at lower interest rates. Among the forces that can shift the demand curve for capital are changes in expectations, changes in technology, changes in the demands for goods and services, changes in relative factor prices, and changes in tax policy.
- The interest rate is determined in the market for loanable funds. The demand curve for loanable funds has a negative slope; the supply curve has a positive slope.
- Changes in the demand for capital affect the loanable funds market, and changes in the loanable funds market affect the quantity of capital demanded.
Case in Point: The Net Present Value of an MBA
An investment in human capital differs little from an investment in capital—one acquires an asset that will produce additional income over the life of the asset. One’s education produces—or it can be expected to produce—additional income over one’s working career. The estimated marginal revenue product for each year is the difference between the salaries students earned with a degree versus what they would have earned without it. The NPV is then computed using

The estimates given here show the NPV of an MBA over the first seven years of work after receiving the degree.
New Electronic Trading Systems in the Foreign Exchange Markets
The foreign exchange market can be divided in two segments: the interbank market and the customer market. Two advances in trading technology, electronic brokers in the interbank market and internet trading for customers, have significantly changed the structure of the foreign exchange market. we explain the functioning of electronic brokers and internet trading and discuss the economic consequences.
Bid–ask spread Difference between the best buy price (ask) and best sell
price (bid). The initiator of a trade buys at the ask and sells at the lower
bid price. The spread is a measure of transaction costs. The buy price is
also called the “offer.”
Broker Brokers match dealers in the interbank market without being
a party to the transactions themselves and without taking positions
(cf. dealer).
Call market A market where all traders trade at the same time when
called upon.
Counterparty credit risk The risk that the market participant on the other
side of a transaction will default. Due to the large trade sizes in foreign
exchange markets, credit risk is an important issue.
Dealer A person employed by a bank whose primary business is entering
into transactions on both sides of wholesale financial markets and
seeking profits by taking risks in these markets (cf. broker).
Dealer market Market where orders for execution pass to an inter-
mediary (dealer) for execution.
Interbank market The market where dealers trade exclusively with each
other, either bilaterally or through brokers.
Limit order Order to buy a specified quantity up to a maximum price or
sell subject to a minimum price (cf. market order).
Liquidity Characteristic of a market where transactions do not exces-
sively move prices. It is also easy to have a trade effected quickly
without a long search for counterparties (“immediacy”). Liquid markets
usually have low bid–ask spreads, high volume, and (relatively) low
volatility.
Market maker Dealer ready to quote buy and sell prices upon request.
The market maker provides immediacy (liquidity services) to the market
and receives compensation through the spread.There is no formal oblig-
ation to quote tight spreads; rather, market making is governed by
reciprocity.
Market order Order to buy (or sell) a specified quantity at the best pre-
vailing price (cf. limit order).
Order-driven market Market where prices are determined by an order
execution algorithm from participants sending firm buy and sell orders,
which are incorporated into the limit order book (cf. quote-driven or
dealer market).
Order flow Signed flow of transactions. The transaction is given a
positive (negative) sign if the initiator of the transactions is buying
(selling).
Price discovery Determination of prices in a market. Incorporation of
information into prices
Quote-driven market Refers to a market where market makers post bid
and ask quotes upon bilateral request. In the interbank market, these
prices are on a take-it-or-leave-it basis (cf. order-driven market).
Transparency Ability of market participants to observe trade information
in a timely fashion.
I. INTRODUCTION
The 1990s gave us what might prove to be the two biggest changes in
foreign exchange market structure since World War II: electronic brokers
were introduced into the interbank market in 1992, and in the late 1990s
the Internet became available as a trading channel for customers.What are
the consequences for the market of these innovations? Is there any reason
to believe that these technological developments have influenced the
market in any significant way? Do not dealers in the foreign exchange
market still fulfill their function as liquidity providers and aggregate infor-
mation in their price setting? And, do not basic macroeconomic variables
still drive exchange rates, irrespective of trading technology?
In an ideal world with perfect information, these changes to the institu-
tions of trading probably would not matter that much at the macro-
economic level. In such a world, exchange rates would be determined by
expectations regarding macroeconomic fundamentals like inflation, pro-
ductivity growth, and interest rates. Exchange rates will be efficient asset
prices when all market participants observe these fundamentals and agree
on how they influence exchange rates. Furthermore, provision of liquidity
would be much less risky than in a situation with imperfect information.
However, as empirical evidence has shown all too clearly,models of an ideal
world with perfect information do not hold, at least not for horizons shorter
than a year or so.
The micro structure approach to foreign exchange has made some
promising steps toward solving some of these puzzles .This approach differs from the traditional macroeconomic approach by allowing for imperfect information and heterogeneous agents and, thereby,leaving a role for trading institutions as such. In such a world, technologi-cal changes such as the introduction of electronic brokers and Internet trading may be significant because they change the structure of the market.A different market structure changes the game played between the market participants. This may influence information aggregation capabili- ties and incentives for liquidity provision and, thereby, different aspects of market quality like efficiency (price discovery), liquidity, and transaction costs .
We are interested in understanding market structure because
a well-functioning foreign exchange market is important for the macro-
economy. This chapter considers the impact of technological advances on
the foreign exchange market by focusing on these properties of market
quality.
The new economy and foreign exchange markets is a vast subject. We
limit ourselves to the two major innovations in trading technology because
trading institutions are an important part of a financial market’s structure.
Furthermore, several studies show that trading is important for the
determination of exchange rates. There is particular focus on a property
of market structure called transparency, i.e., how much of the trading
process market participants can observe. Because trading is an important
determinant of exchange rates, observation of the trading process is
important to enable dealers to set the “correct” exchange rates. On a more
general level, transparency relates to how efficiently dealers can aggregate
information.
There are of course many other uses of information and communication
technology (ICT) that have obviously influenced the markets that we do
not address here. These include information providers such as Reuters
and Bloomberg, computers’ calculation capabilities and the importance
for option trading, and of course network technologies and computers in
general. Two other technological innovations deserving special atten-
tion that we do not consider are the newly started settlement service
CLS Bank (Continuous Linked Settlement), which went live on September
9, 2002, and the netting technology FXNet. The former links all participat
ing countries’ payment systems for real-time settlement. With such a
system in place in 1974, the famous Bankhaus Herstatt default would
never had happened. FXNet is a technology for netting out gross lia-
bilities. Both are very important for the handling of counterparty credit
risk .
THE STRUCTURE OF FOREIGN EXCHANGE
MARKETS
Before we discuss electronic brokers and Internet trading, we need an
overview of the general structure of the foreign exchange market so as to
be able to understand the impact of these new trading institutions.Although
electronic brokers were undoubtedly the most significant structural change
in the 1990s, the general description given here is valid for the structure
both before and after the introduction of electronic brokers.The reason is
that brokers were present in the market before electronic brokers were
introduced. The introduction of Internet trading, on the other hand, is still
very recent, but it may prove to be the most significant structural shift of
the first decade of the twenty-first century. This shift has the potential to
overthrow the general structure of the market completely, a point that we
come back to in Section V.
A. INFORMATION AND AGENTS
The foreign exchange market is the oldest and largest financial market
in the world, with $1200 billion changing hands every day (April 2001).1
These trades can be divided into interbank trades and customer trades, rep-
resenting the two segments of the market. In the interbank market, trading
is either direct (bilateral or taking place between dealers) or brokered
(interdealer trades). Prior to the advent of the Internet, customers traded
only with banks. We could have added customer-to-customer Internet-
based trading sites, but we feel it is too early to pay them the same atten-
tion as the three methods already mentioned (interbank, both direct and
brokered, and customer–bank). In the 1990s, the market was often divided
into three groups: customers, dealers, and brokers. However, as brokering
becomes more and more electronic and also is open to customers through
the Internet, we feel that it is more natural to focus on two main groups of
traders: customers and dealers. The customers are the ultimate end-users of
currency, and they typically make the largest single trades. Customers may
be central banks,governments, importers and exporters of goods, and finan-
cial institutions like hedge funds.
Important characteristics of the foreign exchange market are that cus-
tomers do not have access to the interbank market and that they do not
trade with each other (except on the customer-to-customer sites mentioned earlier, which we return to later). The trading that takes place with cus-
tomers is private information for the banks, and dealers stress the impor-
tance of seeing customer flows. An interesting question is what kind of
information this trading may reveal. For understanding the concept of infor-
mation in the foreign exchange market, we need to add some details to what
we mean by information, and Lyons (2002) suggests the description given
in Table 1. The starting point is the expression of an asset price as the dis-
counted expected value. Information may concern the expected value, the
payoff-relevant part, or the discount rate (including the risk premium).
In the upper left corner of Table 1, concentrated payoff-relevant infor-
mation, or information on risk-neutral valuations, is the kind of private
information that is typical in equity markets. In the case of foreign
exchange, it probably does not constitute the main motivation for
information-based trading. Changes in central banks’ interest rates are too
infrequent and too shrouded in secrecy for private information about these
rates to be a major driver of trading. However, private information about
interventions is a possible candidate because central banks sometimes
perform their interventions through particular banks. Bettina Peiers found
that the exchange rate changes made by Deutsche Bank were leading the
rates of other banks through rumors of interventions.
Rather, Lyons (2002) suggests that it is the lower row in Table 1 that is
most relevant in foreign exchange markets. The information that needs to
be aggregated by the market is not concentrated on a few people,but rather
dispersed among many. In their 2002 paper, Martin D. D. Evans and Lyons
present a model where customer trading represents portfolio shifts and
signals changes in risk premiums . A risk premium arises as the compensation necessary to
induce others to take the other side of the portfolio shift.This risk premium
must be a permanent change in exchange rates because the new holders of
currency must want to continue holding the currency.Their empirical results
confirm this .
INSTITUTIONS
The market structure has not always been like the present structure.
Prior to telecommunications, trading in foreign exchange markets could be
described as a centralized call market. Trading in foreign exchange can be
traced back to ancient times, when foreign exchange trading was a way to
circumvent the ban on usury. In the sixteenth century, trading in foreign
exchange occurred every third month at fairs in the Genoa area, each of
which lasted for 8 days.2However,telecommunications changed the general
structure of the foreign exchange market, and it has been more or less unal-
tered from the early 1930s up to the present.3Drawing on the theory of the
microstructure of financial markets, we can describe the current interbank
foreign exchange market as follows:
1. Trading is decentralized across several locations, as opposed to
centralized on an exchange as is the case in many equity markets.
2. There is continuous trading around the clock, as opposed to only
when called upon as in a call market.
3. There are several dealers that provide liquidity, as opposed to the
specialist on the NYSE floor in earlier days, for example.
4. Liquidity is both quote-driven, i.e., created by quoting bid and ask
prices in response to trading initiatives (market making or dealer
market), and order-driven, i.e., by entering limit orders with brokers
(auction market).
5. The market is relatively opaque, i.e., has low transparency compared
with many equity markets.
The introduction of telecommunications allowed decentralized trade of
the asset foreign exchange, as is most natural. Banks want to be present
where the customers are, and because an exchange rate is the relative price
of two assets from two different countries, it is natural to have a decen-
tralized market. Given that customers are in different time zones and may
have an interest in the same asset, say $, trading must also be continuous
around the clock. Finally, given the geographical pattern of customers and
the fact that several banks serve them, it is natural to have a number of
dealers acting as liquidity providers in each currency pair. The decentral-
ized structure also makes it very difficult to regulate foreign exchange
trading, and the market structure has therefore evolved endogenously.
These factors, together with the lack of regulatory disclosure requirements,
mean that the foreign exchange markets are characterized by low
transparency.
All of this has economic consequences.Low transparency means that few
of the dispersed signals that order flow may reveal will be observed by a
single dealer. In a centralized call market,which is more transparent, infor-
mation aggregation will typically be faster and more accurate. The lack of
regulation is also important. Disclosure requirements are imposed on
equity markets so that more trading, and hence more information, is
observed by the market participants.As will be discussed later, the trading
institutions also have implications for risk sharing.
INTERBANK TRADING OPTIONS
Foreign exchange trading typically follows a sequence. Customers’
trading is the primary source of currency demand, and the sequence starts
with a customer contacting her bank with a wish to trade (dealers never
take the initiative). The bank acts as market maker and gives quotes to the
customer. Customers do not have access to the interbank market, so an
exporter cannot contact his counterparty or the counterparty’s bank
directly. For a customer, trading with the counterparty directly involves
credit risk, which could be handled more efficiently by a bank.A dealer in
the bank then turns to the interbank market to cover the customer trade.
Interbank trading actually accounts for between 60% and 80% of the total
volume of foreign exchange trading, and we will come back to this issue in
the next section because it is closely related to trading institutions.
In the interbank market, the dealer has several options, as illustrated by
the 2 ¥2 matrix in Table 2. In a multiple-dealer market, the dealer may
choose to provide liquidity as a market maker and give quotes when con-
tacted by other dealers (incoming trade), or he may trade on other market
makers’ quotes (outgoing trade). Because this is bilateral, it is often called
direct trading. Furthermore, the interbank market is a hybrid market in the
sense that liquidity can be provided both through making markets and by
entering limit orders with brokers.The brokers announce the best bid and
ask prices,and trading on these is a market order. Brokered trades are often
called indirect trading.
The information signal in trading is connected to the action of the most
active part in the trade, often called the initiator or aggressor (outgoing
trade). If the aggressor buys (sells), we say that it is a positive (negative)
order flow, so order flow is just a transaction with a sign. How is this infor-
mative? Think of the portfolio shift model of Evans and Lyons mentioned
in the discussion of Table 1. If the aggressor buys,that could be because she
is covering a position after a customer purchase (portfolio shift into that
currency). Alternatively, think of the proposition that order flow reveals
information about other dealers’ expectations. Then a purchase on behalf
of the aggressor could be a signal, with noise, that the aggressor believes
the currency is undervalued. In both cases, the positive order flow signals
that the exchange rate should appreciate.
TRANSPARENCY
As mentioned earlier, transparency is low in foreign exchange markets
compared to most equity markets. There are many forms of transparency:
pretrade and posttrade transparency, transparency of prices or trades, and
transparency with respect to whether the customers or only the dealers can
observe the trading process. To start with the last of these, in the foreign
exchange markets only the dealers can observe anything other than their
own trading. The trades with customers that initiate the trading sequence
are only observed by the bank that receives the order and, hence, are
private information for the banks. In the interbank market, trades that are
made directly between two dealers are only observed by the two dealers.
The lack of disclosure requirements also ensures that these trades will not
be observed by other dealers after the trade is made. Indirect trading is
more transparent because the price and sign (buying or selling by the
aggressor) of the last trades are observable. In this sense, trading through
brokers is what determines the level of trade transparency. This level has
evolved endogenously as a result of dealers’ indirect trading.
Price transparency is higher than trade transparency, but until recently
customers’ ability to see prices was less than that of dealers.However, com-
pared to many equity markets with indirect trading, transparency is still low.
In many equity markets a trader may be able to see the identity of the best
bid and ask and often also a part of or the entire order book (all the other
limit orders). In the case of a trade, both the size and the identity of the
counterparties are revealed in many equity markets.
DIRECT TRADING AND VOICE BROKERS
In this section, we provide a further elaboration on the working of the
interbank market prior to the electronic brokers by discussing how indirect
and direct trading actually functions and affects dealers’ behavior.As men-
tioned earlier, the trading institutions have been more or less unaltered for
a long time, perhaps since the early 1930s when the first telephone brokers
started. The composition of direct versus indirect trading has changed over
time, however. For telephone brokers, the main innovation came in the
1960s when brokers started operating through private telephone networks.
These are installed free of charge in banks by brokers. The broker
announces the best (limit order) bid and ask prices over intercoms at the
dealers’ desk. If the dealer wants to trade at a limit order, i.e., submit a
market order, he picks up the phone with the direct line and just says
“mine” if he is buying (at the ask price) and “yours” if he is selling (at the
bid price).The voice broker then knows which of the two announced prices
at which he is trading. After a trade the broker announces the price and
whether it was traded on the bid or the ask price. The size of the trade is
not announced, but standard sizes are 1 and 5 million.This announcement
was the only signal on marketwide order flow that the dealer received.Tele-
phone brokers are often called voice brokers due to the announcements
over intercom systems. Voice brokers were very popular up to the mid1980s at least. The main advantage for the dealers is that the dealer stays
anonymous until the trade is made.
Direct trading was made by telephone or telex in the 1970s. In February
1981, Reuters introduced the Reuters Market Data Service (RMDS),which
was like a bilateral bulletin board for conveying trading interest, for sub-
sequent trading over the telephone. This system was replaced in 1987 by
Reuters Dealing 2000-1, a closed network for bilateral electronic commu-
nication. Although a system for electronic trading, it did not revolutionize
the market.The D2000-1 is more like an advanced telephone and made the
direct trading that used to take place over the telephone more efficient.
D2000-1 quickly became the dominant tool for trading bilaterally. The
dealers “chat” in much the same manner as with “instant messengers” on
the Internet. Furthermore, trade tickets,needed to check trades and for set-
tlement with counterparties,were sent automatically to the back office, and
the dealer could trade faster and more efficiently with up to four conver-
sations going simultaneously. With this system in place, direct trading
started to take market share from voice brokers, and in the late 1980s to
early 1990s, interbank volume was split 50/50 between direct trading and
voice brokers.
Table 3 reports some volume numbers from the United Kingdom, United
States, and Japan,the three largest single markets, to help us get an idea of
the size of the market. First we notice that in London alone there is trading
for over $500 billion each day, down from over $630 in 1998. The foreign
exchange market had grown rapidly from the collapse of Bretton Woods in
the early 1970s, until the downturn in volume that we see from 1998. Total
volume has decreased similarly, down to $1200 billion in 2001 from $1490
billion in 1998. We will come back to the downturn in the next section. The
increase in volume through the 1980s and 1990s was primarily driven by
increased globalization, a dramatic increase in trading with customers in the
late 1980s,and more banks entering the foreign exchange market.The intro-
duction of D2000-1 might, however, have been a useful trading tool in this
process. Not only could the system handle more trades simultaneously (the
dealer could contact four market makers simultaneously) but D2000-1 also
made cross-border trading easier. Voice brokers are quite regional. There
are New York-based, London-based, Frankfurt-based, and Tokyo-based
brokers, brokers serving Scandinavia, etc. Chatting electronically seems to
be less hampered by borders.
Notice also the high interbank share of foreign exchange volume in Table
3. During the 1990s, the interbank share was between 60% and 80%,
possibly at the high end for financial centers. This has been interpreted as
speculative trading on the part of the banks, because it cannot be related
to goods trading, etc. However, within this trading structure with a high
share of direct trading, a high interbank share may be the result of risk
sharing between the banks after receiving large customer orders. Imagine
that a large customer order, for example €100 million, ends up at the desk
of an interbank dealer. Let us assume that the dealer wants to get rid of it.
The dealer has relationships with 10 other dealers (market makers) and
sells €10 million to each through (outgoing) direct trading. For the sake of
the argument, assume that none of these dealers are particularly interested
in the position. They accept the trade because they get compensation
through the bid–ask spread (incoming trade on their behalf). Each of them
turns to two of their contacts and sells €5 million to each. The interbank
volume is now €200 million, and it continues to grow. The €5 million that
20 dealers have received are sold to other dealers again, and the volume reaches €300 million! The customer trade is passed on like a “hot potato.”
When the process comes to an end, all dealers, including our initial dealer,
hold a share of the initial customer order. Large interbank trading flows
could, in other words, be a consequence of a market structure with a high
share of direct trading.
DEALER BEHAVIOR
How do the dealers behave in such a hybrid market? We can use the
dealer studied by Lyons in 1992 (see Lyons, 2001a) as an example of how
a market maker works. The dealer operated as a market maker in a New
York investment bank in 1992 and traded almost entirely by giving quotes
on the D2000-1 system (market making e.g., direct incoming trading).
A market maker sets bid and ask prices, the difference being the spread
and the midpoint typically being her expectation. The spread is a function
of three components: (i) adverse selection protection;(ii) risk management;
and (iii) order processing costs and rents. To discourage informed traders
and make money from the uninformed (she always loses to the better
informed), the market maker increases the spread with trade size, hence,
making it more expensive to trade. Similarly, the spread increases with
size as compensation for taking on the risk in the trade. The part of the
spread due to order processing costs and rents is usually modeled as a
constant.
The spread is measured in “pips,” with one pip being the fourth decimal
in most exchange rates (the fifth in £ exchange rates). The median spread
for the dmark/$ dealer studied by Lyons (2001a) was three pips, and the
median trade size was $3 million. Geir Bjønnes and Dagfinn Rime find, in
similar data for direct trading from 1998, a median spread of two pips, with
a median trade size of $1 million. The spread was relatively constant up to
$5 million. This may seem like a tiny transaction cost. If the dmark/$ was
trading at 1.8, then a two-pip spread is only slightly more than one basis
point (1%/100), and buying $1 million would cost approximately $55.When
one realizes that, in April 1998, dmark/$ was traded for almost $100 billion
daily in the interbank market alone (corrected for double counting), the
risk sharing process mentioned earlier becomes quite expensive ($5.5
million daily in interbank dmark/$ trading alone).
The dealer that makes the contact (aggressor) asks for bid and ask prices
for a given size without revealing his trading intentions. In “direct” trading,
market makers are expected to give tight quotes promptly on request, and
the aggressor is similarly expected to reply quickly. The quotes are on a
take-it-or-leave-it basis. If there is a trade, the server analyzes the conver
sation to make precise transaction tickets.
The “Lyons dealer” increased his spread with the size of the trade
to protect himself against better informed dealers. After observing the
direction of the trade, he also adjusted the midpoint to take into account
the information contained in the trade. Furthermore, he reduced/increased
(“shaded”) both his prices when his inventory of currency was higher/lower
482 Rime
Figure 1 D2000-1 conversation. An example of a transaction ticket with a D2000-1 conver-
sation made March 16, 1998. The first word means that the call came “from” another dealer.
There is information regarding the institution code and the name of the counterpart, the time
(Greenwich Mean) of the printing of the ticket, the date,and the number assigned to the com-
munication. DEM 1 means that this is a request for a spot DEM/USD quote for up to USD
1 million, because it is implicitly understood that it is DEM against USD. On line 4 we find
the quoted bid and ask prices. Only the last two digits of the four decimals are quoted. In this
case, the bid quote is 1.8145 and the ask quote is 1.8147.When confirming the transaction, the
communication record provides the first three digits. In this case, the calling dealer buys USD
1 million at the price 1.8147.The record confirms the exact price,quantity, and valuation (deliv-
ery) date (two days later for spot). The transaction price always equals the bid or the ask.
There is also information regarding the settlement bank.“My DEM to settlement bank” iden-
tifies the settlement bank of “our bank,” whereas “my USD to settlement bank” identifies the
settlement bank of the other bank. It is usual to end a conversation with standard phrases,
such as “thanks and bye”or,“thanks for deals friends.”The conversation ended 1 minute prior
to printing of the transaction ticket, as seen from the last line.
than preferred so as to induce trade in his preferred direction in order to
control his inventory risk. If he was “long” (positive holdings of, for
example, $ against dmark), he wanted to make it attractive for others to
buy from him.
This strategy makes perfect sense for this kind of dealer. The dealer,
working in an investment bank, did not see any customer order flow and
was consequently uninformed about events like portfolio or sentiment shift.
Given that he did not have any superior information, there was little reason
for him to trade at others’ quotes, which would cost him half the spread.
Instead, he made money by making markets, selling on the high ask price
and buying at the lower bid price. This explains his high incoming trade
share. Furthermore, to make money on the spread, it is necessary to price
competitively in order to attract trades, so he controlled his inventory by
shading his quote instead of submitting market orders to brokers, for
example. Finally, as he attracted large dealers with his competitive pricing,
he also had to make sure to protect himself against an unfavorable infor-
mation position.
This strategy would not necessarily work for a well-informed dealer with
large customer flow. First, she would be willing to pay half the spread to
make use of the customer’s information quickly. Second, because she had
a relationship with the Lyons dealer, she was probably happy trading with
a competitive and (relatively) uninformed market maker.
Other dealers could, of course, have chosen to trade with the voice
brokers. With the broker the dealer had more options. She could have
placed a market order with the broker, but if she was well-informed there
was always a risk of information leakage. Besides, direct trading was often
the preferred channel when trading either very large or odd sizes.An alter-
native could be to post a limit order with the broker. First, she could choose
whether she wanted to give two-way quotes (bid and ask) or only one-way
quotes (bid or ask). If she knew whether she wanted to buy or sell, for
example,because she was well-informed or for inventory control, she would
give a one-way quote. Furthermore, timing is another important distinction
between direct and indirect trades. In an incoming direct trade, the dealer
does not decide when to trade. In an incoming indirect trade, there is a
timing decision because the dealer decides when to place the limit order
with the broker.
On the other hand, voice brokers are quite expensive to trade with.With
many voice brokers,both the liquidity provider (the limit order dealer) and
the aggressor have to pay commission, whereas with direct trading on the
D2000-1 the only cost incurred is the fixed rental cost to Reuters for the
keystation What were the consequences of the introduction of electronic direct
trading through D2000-1? Probably not very extensive. As mentioned
earlier, D2000-1 merely replaced the telephone as the tool for direct
trading. The fact that it was more efficient, both for the dealer and for the
back office, might have led to a decrease in the order processing cost of the
spread and, hence, lower spreads. More efficient trading could also have
allowed more trading, which again could have resulted in a more liquid
market. In a more liquid market, meaning one in which it is easier to trade
without a price impact, the risk of taking on a trade is lower because it is
easier to get rid of as well, and the inventory part of the spread may also
have decreased.There is insufficient foreign exchange spread data available
to allow anything precise to be said about this. We do know from market
participants that spreads decreased during the late 1980s, but the main
reason might have been increased competition between the banks and a
more liquid market due to more active customers
ELECTRONIC BROKERS
Electronic brokers collect orders from screens connected together in a
network and match the orders, hence letting the screens represent a more
centralized marketplace. As such they are perfectly suited to a decentral-
ized market in need of efficient matching. The foreign exchange market,
with its decentralized structure and quickly growing volumes, was also
among the early adopters of electronic brokers.4Subsequently, many equity
markets also adopted electronic brokers.
Today there are two electronic brokers in the interbank market.The first,
Dealing 2000-2, was introduced by Reuters in April 1992. The D2000-2
system comes bundled together with the previously mentioned direct
system, D2000-1. A year later, in April 1993, Minex was launched by
Japanese banks, with EBS (Electronic Broking Services) following in
September 1993. The EBS Partnership was established by several major
market making banks to counter the dominant role of Reuters, and EBS
acquired Minex in December 1995 and thereby gained a significant
market share in Asia. Figure 2a shows the Dealing 2000 screen, which con-
sists of both D2000-1 and D2000-2,5whereas Figure 2b shows the EBS
screen.
The electronic brokers work in a manner similar to voice brokers;
they actually offer speakers as well. When a limit order is entered, there is
first a price priority to ensure that it is always the best prices that are traded
on and then a time priority (price–time priority). Market orders are given
priority according to time of entry, and the system matches the counter-
parties automatically.6As with voice brokers, the entry of orders is anony-
mous,but both parties see the counterparty’s identity immediately after the
trade.
Electronic brokers differ from voice brokers in three respects, and we
will come back to each later on. First, electronic brokers offer a higher level
of transparency. Second, the fee structure makes electronic brokers
cheaper. Finally, electronic brokers match orders much more efficiently, at
least for liquid standardized instruments. Table 4 compares spot volumes
and shares of interbank spot volumes for direct trading, electronic brokers,
and voice brokers.Initially, electronic brokers took market shares only from
the voice brokers, but later direct trading also lost market share to elec-
tronic brokers.Today electronic brokers constitute the main trading channel
in the interbank market. In Japan, electronic brokers had almost three times
more $/€spot trading than D2000-1 in April 2001 and twice as much ¥/$
spot trading.
TRANSPARENCY
The introduction of electronic brokers has definitely led to higher trans-
parency in the market. First, dealers can see the price and sign of all trades,
not just the ones that the voice broker manages to announce. Hence, post-
trade transparency is higher. Second, it is easier to follow the evolution of
several exchange rates, so price transparency is higher. The dealer decides
which exchange rates to display on the screen. Furthermore, even if the
dealers cannot see the whole order book, they do have more pretrade infor-
mation with electronic brokers than with voice brokers. In the top right-
hand part of the D2000 screen, and at the side of the bid and offer (ask) on
the EBS screen, the dealers can see the best bid and ask prices for trades
larger than 10 million. Although this means higher transparency, the infor-
mation is not particularly useful. As can be seen from the EBS screen, all
figures here are equal to the best bid and ask prices. In periods with high
liquidity, spreads can be more or less constant up to 10 million, as can be
seen from the 16:00 o’clock .
The market is much deeper at the bid (lower curve) than at
the ask (upper curve).7If a dealer wants to buy 10 million with a market
order he, will “walk up the book” (“lift the ask”) so that the first part of his
10 million will be filled at the lowest ask and then subsequently at higher
prices.8The dealer cannot see these curves, but on the electronic broker
screens he would see that the ask prices for sizes larger than 10 million are
(much) higher than the best ask. So when entering his market order for 10
million, he knows approximately what his average price will be. This infor-
mation would not be available with voice brokers.
The economic impact of higher transparency may be a more informa-
tionally efficient market, i.e., exchange rates that reflect available informa-
tion better. Richard Payne (2003) and William Killeen et al. (2001) have
studied the information content of order flow through D2000-2 and EBS,
respectively. Both studies find a permanent effect on exchange rates due to
order flow. This implies that order flow aggregates relevant information
because, if the effect was temporary, it would mean that the information
lost value, which can hardly be a property of truly relevant information.
Because electronic brokers do not see geographical borders like voice
brokers,they might be more effective in aggregating dispersed information.
All participating banks are on an equal footing, and from Table 5 we see
that the cross-border share of interbank spot trading has increased. This
positive aggregation effect could be counteracted by fragmentation of the
trading process because there are two electronic brokers. Fragmentation is
unfortunate because there is a positive externality if all flow is concentrated
in one system; both liquidity and information aggregation improve.
However, before the introduction of electronic brokers, the market for
indirect trading was probably more fragmented, as the voice brokers were
both more regional in their coverage and more numerous.Furthermore, the
market has settled the fragmentation problem already: EBS is dominant in
$, €, and ¥ trading,whereas D2000-2 dominates in £ and smaller currencies.
Reuters and EBS report having installed 7000 and 2500 keystations,
respectively. In terms of volume, EBS is probably the larger given its
dominant position in the largest markets. Reuters probably has more key-
stations installed because almost all banks want the D2000-1 part that
comes with the Dealing 2000 system
The increased transparency probably represents the greatest progress for
the foreign exchange market. At first glance, it might seem optimal to have
a perfectly transparent market. But then informed dealers do not have
incentives to participate, and hence less information will be aggregated.
Furthermore, higher transparency makes it more risky to take on large
trades from customers because it is more difficult to offset the trade before
the rest of the market is aware of it. As suggested in Section III, inventory
control after the customer trades is very important in the foreign exchange
market. However, the transparency of the interbank foreign exchange
market prior to electronic brokers was so low that in this case the improve-
ment in transparency is probably welfare improving.And there are no signs
that dealers do not want to trade using the electronic brokers, despite the
higher transparency.
LIQUIDITY
There seems to be some disagreement as to whether the electronic
brokers have improved the liquidity of the market. In a quote-driven
market, liquidity is provided on demand, i.e., when the market maker is
contacted (direct trading, like D2000-1). The market maker might be
reluctant to trade, perhaps because of high volatility, and therefore
demands a wide spread, but if he follows the norms of the market,
immediacy will be supplied. In an order-driven market, immediacy will
not be supplied unless the liquidity provider, the limit order submitter, finds
it beneficial. Voice brokers used to call market makers to get them to enter
limit orders in such situations, but electronic brokers can hardly make such
calls.
In a survey by the Federal Reserve Bank of New York in 1998, market
participants expressed concerns that the electronic brokers were replacing
not only voice brokers but also market makers (direct trading). They also
believed that electronic brokers would lead to less two-way (both bid and
ask) quoting in periods of distress and, hence, lower liquidity. Entering of
a limit order on an electronic broker is an free option given to the market,
and this option increases in value with volatility. Judging from Table 4
electronic brokers have also taken market share from direct trading, so
the concern of less market making may be justified.
It would be wrong, however, to conclude that liquidity is lower due to
the adoption of electronic brokers. Alain Chaboud and Steven Weinberg
(2002) have found that there are no changes in volatility in the period from
1987 to 2001. And the fear of a shortage of limit orders on both the buy
and sell sides of the market applies more to markets with lower liquidity
initially. The currencies traded through electronic brokers were those that
were most liquid before the introduction of electronic brokers.
Electronic brokers may actually prove more liquid than direct
market making trading in periods of distress. This is because with the
electronic brokers more dealers are exposed to informed traders.Thus, the
dealers share the disadvantage of trading with better informed dealers,
whereas in direct trading the market maker must carry the disadvantage
alone.
Furthermore, the comparison is not completely fair. Both the voice
brokers and direct trading have a stronger regional focus, whereas
electronic brokers are not aware of borders or established relationships.
Electronic matching is much more efficient, and without the regional
focus electronic brokers can attract liquidity more easily than voice brokers
and direct trading. Consequently, the potential for liquidity is much greater
with electronic brokers
With the increased
price transparency offered by electronic brokers, there is less need for
dealers to trade to know where the market price is trading at the moment.
Of course, the regional voice brokers could have filled that role (they do
announce prices), but the global electronic brokers do it so much better.
And more efficient matching means that there is less need for the hot potato
trading mentioned earlier as a means of sharing risk. Electronic brokers are
particularly apt for the kind of risk sharing we see in the interbank market.
The fall in volume has come without any increase in volatility, implying that electronic brokers
maintain a level of liquidity at a lower level of volume than the previous
market structure
TRANSACTION COSTS
Dealers choose to trade through the electronic brokers instead of voice
brokers despite the increased transparency, because of more efficient
matching, higher execution speed,and lower transaction costs. Commissions
are lower for electronic brokers than for voice brokers. On the electronic
brokers only the aggressor (market order) pays commission, and in the case
of Reuters D2000-2 the commission is $25 independent of order size. The
presence of a competitor probably keeps commissions low as well. After
all, EBS was started as a challenge to Reuters’ dominant position. Com-
missions for voice brokers are often paid by both parties and increase with
size. However, voice brokers often charge individual commissions, so some
dealers may find that for small orders voice brokers are cheaper. Lower
commissions together with more efficient order processing reduce the order
processing cost element of the spread.
Because dealers share the disadvantage of trading with better informed
counterparties with other dealers when trading on brokers,the information
component may also have decreased. The more liquid the broker, the
stronger this sharing. More efficient matching makes inventory control
easier, which decreases the inventory element of spreads. Furthermore, the
flexibility and liquidity of electronic brokers make inventory control
cheaper in a subtle way. Back in 1992, the Lyons dealer mentioned earlier
could control inventory by placing a market order (direct or indirect) and
paying half the spread, by shading quotes, or by placing a limit order with
a (less liquid) voice broker. The dealers studied by Bjønnes and Rime in
1998 used a different strategy: they placed limit orders at the best bid when
they wanted to increase inventory (buy) and thereby avoided the cost of
“shading” to induce trade in their preferred direction. In calm periods,
brokers’ liquidity was so good that they did not have to improve upon the
best prices in order to control inventory.
Finally, because the dealer can decide on the time of submission of limit
orders, there is more scope for active timing that is not available with
incoming direct trades.A dealer who wants to buy immediately,e.g.,in order
to utilize information, can either submit a market order at the best ask or
enter a limit order that improves the best bid. Of course this kind of
“shading” is a signal to the rest of the market, but so is a market order.
The advantages are that the dealer does not pay commissions on the limit
order and that she may trade at a better price than with a market order.
This strategy makes the spread tighter, especially because it is seldom the
same dealer that submits both best bid and best ask.
The decrease in spreads should not be exaggerated. Spreads were also
small in 1992 according to the study by Lyons (three pips), whereas
evidence from electronic brokers shows spreads around two pips. Charles
Goodhart et al. find that the average spread in both dmark/$ and $/€was
between 2.5 and 3 pips using data from 1997 and 1999, respectively. In the
meantime volume also increased, so that the direct impact of electronic
brokers as such is difficult to evaluate. For customers and small banks the
gains are significant, however. Small banks did not have access to tight
spreads earlier, and higher price transparency has enabled customers to
have a more precise view of spreads in the interbank market, which has
led to smaller spreads for customers.
To this should be added the suggestion that the effective spread in $/€
may be higher than that for dmark/$ because the electronic brokers are
rigidly set at four decimals. Because a typical dmark/$ exchange rate was
1.8 and the typical $/€rate is somewhat below parity, each pip is more
valuable. The electronic brokers so far have set the quote at 4 decimals,
but perhaps 5 decimals should have been used.
THE FUTURE OF DIRECT TRADING AND VOICE BROKERS
So far electronic brokers have taken market share from both voice
brokers and direct trading.This does not mean that voice brokers and direct
trading will disappear from the market. Electronic brokers are most suit-
able for very liquid markets,and the foreign exchange market is much more
than $/€. Many smaller currencies are not traded on electronic brokers
because their markets are not liquid enough. And in periods of distress,
some direct trading may be wanted because then there are always trading
possibilities, whereas the liquidity of electronic brokers may diminish
during such periods.The release by EBS of a direct trading product called
EBSTrader constitutes further evidence. Furthermore, it is no means sure
that a purely electronic broker market would be optimal. The results are
mixed (see Larry Harris, 2002).
Voice brokers too have a role in the market. In less liquid currencies they
can use their knowledge of positions to track down counterparties. Voice
brokers are also moving into less liquid derivatives. Instead, what we can
expect to see is more derivative trading through electronic brokers.
Forwards were introduced on the D2000-2 in 1997, and attempts are
being made to set up electronic brokers,independently of Reuters and EBS,
for options trading.
POLICY IMPLICATIONS
What are the consequences for the authorities? Increased transparency
is also beneficial for the authorities. Several central banks have electronic
brokers installed and use them for market monitoring, among other things.10
Electronic brokers may prove useful for secret interventions,given pretrade
anonymity and matching without human interventions and possible infor-
mation leakages as with voice brokers.
If we come to a situation where the majority of interbank trading is
directed through the two electronic brokers, the systems may also prove
useful in attempts to regulate the foreign exchange market. By regulating
brokers and requiring banks to use only regulated electronic brokers, the
way could be opened for implementing trading halts, for example. Another
possibility is to collect a transaction tax (“Tobin tax”) through the electronic
brokers. Many equity markets have intro-duced this.Some equity markets have done it to counter competing trading venues and thereby attract liquidity.
INTERNET TRADING
Internet trading represents a possible structural change in the bank–
customer relationship. Through the 1999s, customers’ trading was an im-
portant source of both income and information for banks. Internet trading
has made the customer segment much more competitive and may increase
the transparency of customers’ trading, thereby changing the information
role of customers. In this section we discuss the evolution of customer
trading, the consequences of Internet trading, and what may lie ahead.
In the early 1990s,customers’ access to information on interbank market
activity was low, and they were relatively loyal to their banks. Customers
requested quotes from banks over the telephone. A Reuters service called
FXFX provided customers with information on interbank prices, but
spreads on FXFX were much wider than in the interbank market.The mid-
point was quite accurate, though. Banks used this screen as an advertising
channel to customers. In this period, customer trading was very profitable
for banks.
During the 1990s, price transparency for customers increased, partly as
a result of electronic brokers that made interbank transaction prices easier
to collect and publish on-line. This, together with a increasing concern on
the part of customers about noncompetitive terms and being locked in with
their banks, led customers to start shopping around at several banks for
quotes.The customer segment became more competitive
INTERNET TRADING WITH BANKS
Banks’ initial response to the nonbank Internet trading sites for cus-
tomers was to establish their own customer sites. In these sites, pricing
is still given on request, but the administration of orders is easier for both
customers and banks. The first network-based trading opportunity offered
to customers by a bank was a closed network called FX Connect, intro-
duced by State Street in August 1996. The introduction of the bank-
independent Currenex, which started trading in April 2000, was a turning
point. This was the first multibank site, meaning that several banks were
invited to provide prices. Immediately afterward, FX Connect opened up
its system to other dealers as liquidity providers. FXall followed with their
first trading in May 2001, established initially with seven major banks as
owners in June 2000.The last addition was Atriax,started in December 2000
and backed by Reuters and three of the biggest banks. The big four sites
quickly became FXConnect, Currenex, FXall, and Atriax, but Atriax was
later closed down in early April 2002. More details on the four multibank
sites are provided in Table 6.
According to a survey made by TowerGroup in March 2002, volumes
traded through banks’ Internet portals are still limited. FX Connect by State
Street is the largest with $6 billion as a daily average for March 2002. FXall
was second with $1.5 billion and Currenex was third with $1.1 billion,
whereas Atriax had $0.3 billion (just before they closed down).The volume
of banks’ proprietary customer sites was estimated to be $5.5 billion aggre-
gated. This should be compared with the total volumes of other financial
institutions ($329 billion) and nonfinancial customers ($156 billion) from
the most recent survey by BIS. The total Internet bank volume of $14.4
billion is small, so far, compared to the traditional volume. The aggregate
volume of the nonbank independent portals is probably lower. Euromoney
reports strong growth for these sites since and reports $10 billion and $4
billion on normal days in November 2002 for FX Connect and FXall,
respectively.
The lack of convincing success (several portals have closed down
already) is probably related to the facts that (i) many customers are worried
about security with Internet-based trading (FX Connect started as a closed
network) and (ii) the portals are struggling with high costs, as true straight
through processing (STP) is expensive to install. STP means that the trades
enter directly into the customers’ systems without any manual work. In a
survey by Euromoney after the demise of Atriax, a majority believed that
there would be only two multibank portals within a short time. Which of
the three remaining big ones will disappear is difficult to say from banks’
practices. Today most banks participate in two or three of the multibank
portals in addition to running their own (single-bank) portal.
So far the main consequence of Internet trading is limited to transaction
costs for customers. With pricing on request, customer order flow will still be
private information held by banks.With an electronic broker for customers,
as with interbank brokers, customer trading would, to a lesser extent, be
private information. More recently, at least two of the portals have started
working with structures more similar to those of crossing networks, with
prices feeding into the system automatically.
POSSIBLE SCENARIOS
Lyons (2002) suggests three possible scenarios with regard to the
bank–customer relationship. In the first, Internet trading proves so succ-
sessful that banks lose their entire customer trading. Hence, interbank
trading will also vanish because customer trading is the primary reason for
interbank trade in the first place.Because there is a positive externality with
centralized trading, a network benefit, a centralized electronic broker that
reaps all network benefits will probably emerge. Customers trade with
each other, while the banks act as legal middlemen for the counterparties
in the settlement of the trade. Lyons believes that a centralized electronic
broker would be more efficient in providing liquidity than the current deal-
ership structure, where dealers, acting as market makers, fill orders from
their own inventory. The reason for this is that the risks associated with such
trading are high, and the efficient matching performed by electronic brokers
makes them very efficient for risk sharing. Furthermore, the banks have
an advantage in settling the trades because they are better at credit
management. This centralized electronic broker will offer much higher
transparency than there is at present, but customer order flow will still be
informative.
The second scenario is a continuation of the current state of affairs, with
banks having all customer trading. In this scenario, banks give customers
favorable terms so as to keep away the competition from nonbank sites
Banks are willing to do this because they are able to profit from the infor-
mation in their customer order flows.
In the final scenario, one of the interbank electronic brokers allows cus-
tomers to trade alongside dealers. If a nonbank site acquired considerable
liquidity, the owners of EBS,one of the interbank electronic brokers, could
open their system to customers and offer much higher liquidity than their
nonbank competitor. In this scenario, the banks again would be middlemen
between customers. This third scenario implies higher transparency than
there is in today’s structure, but unless the electronic broker in which cus-
tomers participate is an open one, customer order flow will remain private
information because one cannot tell identities from the electronic brokers.
Information about marketwide order flow will be much better, however.
Of these scenarios, the second, the continuation of the current bank–
customer structure, is most likely. If the first were about to emerge, the
third scenario would certainly put a stop to it. However, of the three
scenarios, it is the second that the banks prefer. They would rather keep
information about their customer flows private than share it. So banks
quote tight spreads to customers,keep the nonbank sites at a low level, and
gain by their informational advantage. We see that this is how FXall and
FX Connect are set up: price competitively, so as to gain customer flow and
keep the nonbank sites away, but within a dealership structure so as to keep
the customer order flow private information.
Let us end this section by drawing attention to the CLS Bank mentioned
in the Introduction. Currently, banks are better at handling counterparty
risk than nonbank sites. Because only banks can participate in the CLS
Bank, this system will give banks an even larger advantage in handling
counterparty risk, making it even more difficult for nonbank sites to attract
large flows.
the possible consequences of elec-
tronic trading in foreign exchange markets. The first electronic trading
system in the foreign exchange market was the Reuters D2000-1 system
for direct trading. Its contribution was merely to replace trading over the
telephone or telex and to make direct trading more efficient. The impact
on the market structure as such was small.
In 1992 electronic brokers were introduced. They quickly took market
shares from the traditional voice brokers, because of their lower costs. At
the end of the 1990s,they also took market shares from direct trading.Their
main advantage is the very efficient matching they offer, which is so impor-
tant for controlling risk in foreign exchange markets.Their introduction has
made the market more transparent and, thus, hopefully also more efficient,
but this is hard to test. When it comes to liquidity provision, the interbank
market is still a hybrid market. However, it is more transparent, more
centralized, more effective in matching, and with a shift of focus from
market making to order books.When it comes to consequences for volatil-
ity and transaction costs, the effect of electronic brokers seems to be
modest. Transaction costs have not changed much since 1992, and volatility
has stayed more or less the same. In the coming years, we expect to see
more derivative trading on electronic brokers.
Internet trading is relatively recent in the area of foreign exchange.
Independent Internet sites have challenged the banks’ relationship with
customers and made competition for customers stiffer, with lower transac-
tion costs for customers as a result. Will these nonbank Internet sites be
able to take over banks’ dominant position as liquidity providers to cus-
tomers? Most likely not. The banks believe that customer order flow is
important private information and, hence, are willing to fight for it. Fur-
thermore, they have the necessary means to win the war. At the moment
the bank-based Internet sites have more liquidity and are pricing compet-
itively so as to keep the nonbank sites out of the main market. If this does
not succeed, they can let customers into the interbank market.We will most
likely see a consolidation of Internet sites in the future as the site with
highest liquidity reaps the network effects and becomes dominant.This site
will have liquidity provided by several banks.This might lead to an increase
in customer flow transparency, but should not alter the private information
nature of customer trading.
It is important to note that the structure of the foreign exchange market
has evolved endogenously with the banks in the driver seat. The structure
and previous changes in structure have probably been beneficial for the
banks. Do the private interests of banks go hand in hand with public
interest? One could of course argue that the market should be regulated,
that trading should be more transparent, etc., but it is not certain that this
would lead to a welfare improving outcome. Transaction costs are low for
customers too, and the market has implemented new systems that make
trading more efficient in handling the peculiarities of foreign exchange.
However, volumes are also extremely large in the foreign exchange market,
making the amounts used on transaction costs considerable, and the
efficiency of foreign exchange rates, or the lack thereof, is an open
question. The introduction of electronic trading has made the market
more centralized and, hence, more accessible to regulation. Regulation
of foreign exchange markets is no longer a utopia and should be
considered .
WEB SITES ON TRADING AND NETWORKS
1. Academic sites
a. Nicholas Economides’ site for network economics
(www.stern.nyu.edu/networks/site.html).
b. Ian Domiwitz’ page for trade automation
(www.smeal.psu.edu/faculty/ihd1/automation.html).
2. Interbank trading systems
a. EBS (www.ebs.com).
b. Reuters D3000
(about.reuters.com/products/dealing3000/index.asp).
c. Reuters D3000 and D2000
(about.reuters.com/transactions/tran00m.htm).
3. Multibank Internet trading
a. FXall (www.fxall.com). Supported by 55 banks. Voted best in
Euromoney’s 2002 FX poll, second in market share. Started
trading in May 2001; tradable prices are fed automatically into
the system from other systems.
b. Currenex (www.currenex.com). Owned by nonbank investors.
Trading started in April 2000.
c. FX Connect (can be reached through www.globallink.com).
Initially a closed system owned by State Street, now an Internet
platform where 33 banks participate. Rated first in market share
in Euromoney’s 2002 FX poll. Opened up to other banks in
March 2000.
d. Centradia (www.centradia.com).
4. Single-bank Internet trading11
a. Citigroup’s CitiFX (www.citifx.citibank.com). Trading occurs at
daily fixings on prices from EBS and Reuters.
b. Goldman Sachs (fx.gs.com).
c. Dresdner Kleinwort Wasserstein’s Piranha FX
(www.drkw.com/online/fx).
d. Deutsche Bank’s db markets (www.deutsche-bank.de/
tradingproducts_e.htm with further links to db markets).
e. Credit Suisse First Boston’s PrimeFX (www.csfb.com/primetrade/
index.shtml and www.csfb.com/fixed_incom
What is 'Foreign Exchange'
Foreign exchange is the exchange of one currency for another or the conversion of one currency into another currency. Foreign exchange also refers to the global market where currencies are traded virtually around the clock.
BREAKING DOWN 'Foreign Exchange'
Foreign exchange transactions encompass everything from the conversion of currencies by a traveler at an airport kiosk to billion-dollar payments made by corporations, financial institutions and governments. Transactions range from imports and exports to speculative positions with no underlying goods or services. Increasing globalization has led to a massive increase in the number of foreign exchange transactions in recent decades.
The Basics of Foreign Exchange
The global foreign exchange market is the largest and the most liquid financial market in the world, with average daily volumes in the trillions of dollars. Foreign exchange transactions can be done for spot or forward delivery. There is no centralized market for forex transactions, which are executed over the counter and around the clock.
The largest foreign exchange markets are located in major financial centers like London, New York, Singapore, Tokyo, Frankfurt, Hong Kong and Sydney.
The term foreign exchange is usually abbreviated as "forex" and occasionally as "FX."
Size of the Foreign Exchange Market
The foreign exchange market is unique for several reasons, mainly because of its size. Trading volume in the forex market is generally very huge. As an example, trading in foreign exchange markets averaged $5.1 trillion per day in April 2016, according to the Bank for International Settlements, which is owned by 60 central banks, and is used to work in monetary and financial responsibility.
The largest trading centers are London, New York, Singapore and Tokyo.
Trading in the Foreign Exchange Market
The market is open 24 hours a day, five days a week across major financial centers across the globe. This means that you can buy or sell currencies at any time during the day.
The foreign exchange market isn't exactly a one-stop shop. There are a whole variety of different avenues that an investor can go through in order to execute forex trades. You can go through different dealers or through different financial centers which use a host of electronic networks.
From a historic standpoint, foreign exchange was once a concept for governments, large companies and hedge funds. But in today's world, trading currencies is as easy as a click of a mouse — accessibility is not an issue, which means anyone can do it. In fact, many investment firms offer the chance for individuals to open accounts and to trade currencies however and whenever they choose.
When you're making trades in the forex market, you're basically buying or selling the current of a particular country. But there's no physical exchange of money from one hand to another. That's contrary to what happens at a foreign exchange kiosk — think of a tourist visiting Times Square in New York City from Japan. He may be converting his (physical) yen to actual U.S. dollar cash (and may be charged a commission fee to do so) so he can spend his money while he's traveling. But in the world of electronic markets, traders are usually taking a position in a specific currency, with the hope that there will be some upward movement and strength in the currency that they're buying (or weakness if they're selling) so they can make a profit.
How Forex Markets Differ From Others
There are some fundamental differences between the foreign exchange and other markets. First of all, there are fewer rules, which means investors aren't held to as strict standards or regulations as those in the stock, futures or options markets. That means there are no clearing houses and no central bodies that oversee the forex market. Second, since trades don't take place on a traditional exchange, you won't find the same fees or commissions that you would on another market. Next, there's no cut-off as to when you can and cannot trade. Because the market is open 24 hours a day, you can trade at any time of day. Finally, because it's such a liquid market, you can get in and out whenever you want and you can buy as much currency as you can afford.
Spot Market
Spot for most currencies is two business days; the major exception is the U.S. dollar versus the Canadian dollar, which settles on the next business day. Other pairs settle in two business days. During periods that have multiple holidays, such as Easter or Christmas, spot transactions can take as long as six days to settle. The price is established on the trade date, but money is exchanged on the value date.
The U.S. dollar is the most actively traded currency. The most common pairs are the USD versus the euro, Japanese yen, British pound and Swiss franc. Trading pairs that do not include the dollar are referred to as crosses. The most common crosses are the euro versus the pound and yen.
The spot market can be very volatile. Movement in the short term is dominated by technical trading, which focuses on direction and speed of movement. People who focus on technicals are often referred to as chartists. Long-term currency moves are driven by fundamental factors such as relative interest rates and economic growth.
Forward Market
A forward trade is any trade that settles further in the future than spot. The forward price is a combination of the spot rate plus or minus forward points that represent the interest rate differential between the two currencies. Most have a maturity less than a year in the future but longer is possible. Like with a spot, the price is set on the transaction date, but money is exchanged on the maturity date.
A forward contract is tailor-made to the requirements of the counterparties. They can be for any amount and settle on any date that is not a weekend or holiday in one of the countries.
Futures Market
A futures transaction is similar to a forward in that it settles later than a spot deal, but is for a standard size and settlement date and is traded on a commodities market. The exchange acts as the counterparty.

Forex - Foreign Currency Transactions
Individual investors who are considering participating in the foreign currency exchange (or “forex”) market need to understand fully the market and its unique characteristics. Forex trading can be very risky and is not appropriate for all investors.
It is common in most forex trading strategies to employ leverage. Leverage entails using a relatively small amount of capital to buy currency worth many times the value of that capital. Leverage magnifies minor fluctuations in currency markets in order to increase potential gains and losses. By using leverage to trade forex, you risk losing all of your initial capital and may lose even more money than the amount of your initial capital. You should carefully consider your own financial situation, consult a financial adviser knowledgeable in forex trading, and investigate any firms offering to trade forex for you before making any investment decisions.
Background: Foreign Currency Exchange Rates, Quotes, and Pricing
A foreign currency exchange rate is a price that represents how much it costs to buy the currency of one country using the currency of another country. Currency traders buy and sell currencies through forex transactions based on how they expect currency exchange rates will fluctuate. When the value of one currency rises relative to another, traders will earn profits if they purchased the appreciating currency, or suffer losses if they sold the appreciating currency. As discussed below, there are also other factors that can reduce a trader’s profits even if that trader “picked” the right currency.
Currencies are identified by three-letter abbreviations. For example, USD is the designation for the U.S. dollar, EUR is the designation for the Euro, GBP is the designation for the British pound, and JPY is the designation for the Japanese yen.
Forex transactions are quoted in pairs of currencies (e.g., GBP/USD) because you are purchasing one currency with another currency. Sometimes purchases and sales are done relative to the U.S. dollar, similar to the way that many stocks and bonds are priced in U.S. dollars. For example, you might buy Euros using U.S. dollars. In other types of forex transactions, one foreign currency might be purchased using another foreign currency. An example of this would be to buy Euros using British pounds - that is, trading both the Euro and the pound in a single transaction. For investors whose local currency is the U.S. dollar (i.e., investors who mostly hold assets denominated in U.S. dollars), the first example generally represents a single, positive bet on the Euro (an expectation that the Euro will rise in value), whereas the second example represents a positive bet on the Euro and a negative bet on the British pound (an expectation that the Euro will rise in value relative to the British pound).
There are different quoting conventions for exchange rates depending on the currency, the market, and sometimes even the system that is displaying the quote. For some investors, these differences can be a source of confusion and might even lead to placing unintended trades.
For example, it is often the case that the Euro exchange rates are quoted in terms of U.S. dollars. A quote for EUR of 1.4123 then means that 1,000 Euros can be bought for approximately 1,412 U.S. dollars. In contrast, Japanese yen are often quoted in terms of the number of yen that can be purchased with a single U.S. dollar. A quote for JPY of 79.1515 then means that 1,000 U.S. dollars can be bought for approximately 79,152 yen. In these examples, if you bought the Euro and the EUR quote increases from 1.4123 to 1.5123, you would be making money. But if you bought the yen and the JPY quote increases from 79.1515 to 89.1515, you would actually be losing money because, in this example, the yen would be depreciating relative to the U.S. dollar (i.e., it would take more yen to buy a single U.S. dollar).
Before you attempt to trade currencies, you should have a firm understanding of currency quoting conventions, how forex transactions are priced, and the mathematical formulae required to convert one currency into another.
Currency exchange rates are usually quoted using a pair of prices representing a “bid” and an “ask.” Similar to the manner in which stocks might be quoted, the “ask” is a price that represents how much you will need to spend in order to purchase a currency, and the “bid” is a price that represents the (lower) amount that you will receive if you sell the currency. The difference between the bid and ask prices is known as the “bid-ask spread,” and it represents an inherent cost of trading - the wider the bid-ask spread, the more it costs to buy and sell a given currency, apart from any other commissions or transaction charges.
Generally speaking, there are three ways to trade foreign currency exchange rates:
- On an exchange that is regulated by the Commodity Futures Trading Commission (CFTC). An example of such an exchange is the Chicago Mercantile Exchange, which offers currency futures and options on currency futures products. Exchange-traded currency futures and options provide traders with contracts of a set unit size, a fixed expiration date, and centralized clearing. In centralized clearing, a clearing corporation acts as single counterparty to every transaction and guarantees the completion and credit worthiness of all transactions.
- On an exchange that is regulated by the Securities and Exchange Commission (SEC). An example of such an exchange is the NASDAQ OMX PHLX (formerly the Philadelphia Stock Exchange), which offers options on currencies (i.e., the right but not the obligation to buy or sell a currency at a specific rate within a specified time). Exchange-traded options on currencies also provide investors with contracts of a set unit size, a fixed expiration date, and centralized clearing.
- In the off-exchange market. In the off-exchange market (sometimes called the over-the-counter, or OTC, market), an individual investor trades directly with a counterparty, such as a forex broker or dealer; there is no exchange or central clearinghouse. Instead, the trading generally is conducted by telephone or through electronic communications networks (ECNs). In this case, the investor relies entirely on the counterparty to receive funds or to be able to trade out of a position.
Risks of Forex Trading
The forex market is a large, global, and generally liquid financial market. Banks, insurance companies, and other financial institutions, as well as large corporations use the forex markets to manage the risks associated with fluctuations in currency rates.
The risk of loss for individual investors who trade forex contracts can be substantial. The only funds that you should put at risk when speculating in foreign currency are those funds that you can afford to lose entirely, and you should always be aware that certain strategies may result in your losing even more money than the amount of your initial investment. Some of the key risks involved include:
- Quoting Conventions Are Not Uniform. While many currencies are typically quoted against the U.S. dollar (that is, one dollar purchases a specified amount of a foreign currency), there are no required uniform quoting conventions in the forex market. Both the Euro and the British pound, for example, may be quoted in the reverse, meaning that one British pound purchases a specified amount of U.S. dollars (GBP/USD) and one Euro purchases a specified amount of U.S. dollars (EUR/USD). Therefore, you need to pay special attention to a currency’s quoting convention and what an increase or decrease in a quote may mean for your trades.
- Transaction Costs May Not Be Clear. Before deciding to invest in the forex market, check with several different firms and compare their charges as well as their services. There are very limited rules addressing how a dealer charges an investor for the forex services the dealer provides or how much the dealer can charge. Some dealers charge a per-trade commission, while others charge a mark-up by widening the spread between the bid and ask prices that they quote to investors. When a dealer advertises a transaction as “commission-free,” you should not assume that the transaction will be executed without cost to you. Instead, the dealer’s commission may be built into a wider bid-ask spread, and it may not be clear how much of the spread is the dealer’s mark-up. In addition, some dealers may charge both a commission and a mark-up. They may also charge a different mark-up for buying a currency than selling it. Read your agreement with the dealer carefully and make sure you understand how the dealer will charge you for your trades.
- Transaction Costs Can Turn Profitable Trades into Losing Transactions. For certain currencies and currency pairs, transaction costs can be relatively large. If you are frequently trading in and out of a currency, these costs can in some circumstances turn what might have been profitable trades into losing transactions.
- You Could Lose Your Entire Investment or More. You will be required to deposit an amount of money (usually called a “security deposit” or “margin”) with a forex dealer in order to purchase or sell an off-exchange forex contract. A small sum may allow you to hold a forex contract worth many times the value of the initial deposit. This use of margin is the basis of “leverage” because an investor can use the deposit as a “lever” to support a much larger forex contract. Because currency price movements can be small, many forex traders employ leverage as a means of amplifying their returns. The smaller the deposit is in relation to the underlying value of the contract, the greater the leverage will be. If the price moves in an unfavorable direction, then high leverage can produce large losses in relation to your initial deposit. With leverage, even a small move against your position could wipe out your entire investment. You may also be liable for additional losses beyond your initial deposit, depending on your agreement with the dealer.
- Trading Systems May Not Operate as Intended. Though it is possible to buy and hold a currency if you believe in its long-term appreciation, many trading strategies capitalize on small, rapid moves in the currency markets. For these strategies, it is common to use automated trading systems that provide buy and sell signals, or even automatic execution, across a wide range of currencies. The use of any such system requires specialized knowledge and comes with its own risks, including a misunderstanding of the system parameters, incorrect data that can lead to unintended trades, and the ability to trade at speeds greater than what can be monitored manually and checked.
- Fraud. Beware of get-rich-quick investment schemes that promise significant returns with minimal risk through forex trading. The SEC and CFTC have brought actions alleging fraud in cases involving forex investment programs. Contact the appropriate federal regulator to check the membership status of particular firms and individuals.
Special Risks of Off-Exchange Forex Trading
As described above, forex trading in general presents significant risks to individual investors that require careful consideration. Off-exchange forex trading poses additional risks, including:
- There Is No Central Marketplace. Unlike the regulated futures and options exchanges, there is no central marketplace in the retail off-exchange forex market. Instead, individual investors commonly access the forex market through individual financial institutions - or dealers - known as “market makers.” Market makers take the opposite side of any transaction; for example, they may be buying and selling the same foreign currency at the same time. In these cases, market makers are acting as principals for their own account and, as a result, may not provide the best price available in the market. Because individual investors often do not have access to pricing information, it can be difficult for them to determine whether an offered price is fair.
- There Is No Central Clearing. When trading futures and options on regulated exchanges, a clearing organization can act as a central counter-party to all transactions in a way that may afford you some protection in the event of a default by your counterparty. This protection is not available in the off-exchange forex market, where there is no central clearing.
Regulation of Off-Exchange Forex Trading
The Commodity Exchange Act permits persons regulated by a federal regulatory agency to engage in off-exchange forex transactions with individual investors only pursuant to rules of that federal regulatory agency. Keep in mind that there may be different requirements or treatment for forex transactions depending on which rules and regulations might apply in different circumstances (for example, with respect to bankruptcy protection or leverage limitations).
You should also be aware that, for brokers and dealers, many of the rules and regulations that apply to securities transactions may not apply to forex transactions. The SEC is actively interested in business practices in this area and is currently studying whether additional rules and regulations would be appropriate.


Electronic Money, or E-Money, and Digital Cash
| "The money screamed across the wires, its provenance fading in a maze of electronic transfers, which shifted it, hid it, broke it up into manageable wads which would be withdrawn and redeposited elsewhere, obliterating the trail." |
Money was originally a physical substance like gold and silver. It could even be alive - cattle were one of the oldest forms of money. Today, although much of the money used by individuals in their everyday transactions is still in the form of notes and coins, its quantity is small in comparison with the intangible money that exists only as entries in bank records. Perhaps coins and banknotes will become as obsolete as cowrie shells.
A major change in the nature of money would have significant unintended consequences. The advantages for criminals and tax evaders could be considerable, as illustrated by the quotation on the right .
Currently Trending
- 1
- 2
the cure to the disease of excessive reserve accumulation? The debate in this respect is currently very much embedded in the more general discussion on how to improve the resilience of the international monetary system. In essence, this discussion focuses on greater multilateral cooperation, including a further strengthening of the role of the IMF. This implies reinforcing the Fund's lending role, also through enhanced collaboration with regional pools, in order to reduce the need for precautionary reserve accumulation, examining and monitoring capital flows and global liquidity conditions, as well as considering a more prominent role for Special Drawing Rights (SDRs).
While I will not elaborate on each of these initiatives in all detail, I would like to argue that in pursuing our goals we have to make sure that we do not indiscriminately buy insurance against future crises. We also have to carefully consider the cost of insurance. In particular, we have to weigh this cost against that of making an effort to invest in pre-empting the failure of the system in the very first place.
The SDR, for instance, is not a cure-all for the international monetary system. The crux of the system is not the international use of national currencies, but the myopic use of domestic policies for achieving short-term gain at the cost of long-run pain. Assigning a more prominent role to the SDR by increasing allocations would hence by no means prevent the build-up of excessive reserves in countries which accumulate them for reasons beyond precautionary motives.
It is not clear either to what extent enhanced access to IMF lending reduces the incentives for the accumulation of large excess reserves. In fact, the IMF has already modified its lending toolkit and multiplied its resources. A Flexible Credit Line was introduced, as well as a Precautionary Credit Line for countries which do not meet the high qualification requirements for the former. In the absence of a counterfactual it is impossible to give a reliable estimate of the impact of these measures on global reserve accumulation. Looking at the data, however, I dare speculate that if anything the impact has been very limited.
And also where the insurance motive of reserve accumulation prevails, it is not clear that enhanced access to IMF lending and regional pools, SDR allocations, or other forms of global liquidity provision could reduce the stigma attached to such external financing and thus avoid the further build-up of precautionary reserves.
The cost of these insurance policies, on the other hand, can be substantial. Large-scale “issuance” of SDRs could interfere with the implementation of monetary policy. Together with badly designed multilateral coordination on global liquidity conditions these could undermine central banks´ authority as the ultimate provider of liquidity and thus dangerously impinge on central bank independence across the globe.
At the same time, any schemes of cross-border liquidity provision at the global or regional level need to involve central banks, because only these can provide the needed amounts of liquidity. But central banks cannot commit to providing funds indiscriminately without setting incentives for moral hazard. Resorting to the IMF and regional pools does not solve this problem, and the parallelism of global and regional pools further increases the complexity of the issue.
Initiatives to improve the global financial safety net should therefore concentrate on helping countries with sound fundamentals that are hit by financial market disruptions from exogenous shocks. Home-made crises resulting from domestic imbalances should be tackled differently and always involving strong conditionality.
The guiding principle should therefore be to limit incentives for moral hazard. At the same time, it must be clear that only sustainable domestic policies can guarantee stability on the external side. Hence, as reserve accumulation beyond insurance cannot be compensated for by creating more insurance devices, the key to limiting the accumulation to what makes economic sense lies in removing the distortions in the domestic economy that cause excess accumulation.
While the ultimate aim is of course achieving greater flexibility of the exchange rate, an abrupt move to fully floating exchange rates would be disruptive as it would most likely trigger large speculative inflows with the risk of over-borrowing, asset price bubbles, and an overheating of the economy.
The key is that the exchange rate reform and capital account liberalisation have to be accompanied by domestic reforms that aim at improving and ensuring the proper functioning of domestic financial markets, reducing the excessive reliance on external demand, and strengthening domestic demand. Hence, any exchange rate reform needs to be carefully phased in. First countries should develop and liberalise the domestic financial system, while at the same time strengthening its prudential framework. In a second step, the currency needs to be made convertible. Finally, the current and financial accounts need to be gradually opened and the exchange rate needs to be gradually made flexible. A new, credible, equilibrium level of the exchange rate would emerge and would discourage speculative capital inflows. Even if foreign exchange markets were liberalised, capital controls could for some time prevent an abrupt adjustment of the exchange rate and discourage inflows of hot money. Thus, the cure to the disease of excessive reserve accumulation lies in reforming the domestic financial system and allowing for a strengthening of domestic demand.
***
One of the most significant innovations in the international monetary system, in this respect, has been the G20 Framework for Strong, Sustainable and Balanced Growth, launched at the Pittsburgh Summit in September 2009. Its aim is precisely to ensure the mutual compatibility of domestic policies and to monitor the progress of needed domestic structural reforms. G20 members review each others’ policy actions and frameworks in order to grasp the combined effect of policies on the global economy. The G20 then explores the scope for improving the global outcome by defining the necessary policy measures to make adjustments where possible.
In order to monitor the progress made with regards to external balance G20 Ministers and Governors had already in February in Paris agreed on a set of indicators that aim to identify G20 members with persistently large imbalances within the context of the Mutual Assessment Process of the G20 Framework. These indicators include: public and private savings and debt, as well as the external balance composed of the trade balance, the income balance and the balance on current transfers. In April, Finance Ministers and Governors in Washington agreed on quantitative guidelines against which these indicators would be assessed so as to identify members with large and persistent imbalances that would be analysed in a second step in-depth assessment.
The process is still insufficiently advanced to judge its contribution to more effective surveillance. In my view, for the process to be successful certain conditions will have to be met:
First, only a limited number of economies should move into the second step in-depth assessment. This would ensure that resources are efficiently allocated and efforts are concentrated on the most relevant and pressing cases.
Second, exchange rate factors and in particular the issue of the exchange rate regime will be critical in the second step in-depth assessment. This, naturally, would also include an assessment of reserve accumulation. Only if the root causes behind excessive external imbalances are frankly and openly identified and discussed, it will be possible to remove the underlying distortions in the domestic economy.
Finally, cyclical factors should be given due consideration in the assessment process to ensure that the imbalances identified are those that can be expected to either persist or re-emerge in the coming years if current policy frameworks are not adjusted accordingly.
***
Let me in concluding reiterate that in the absence of determined action imbalances are almost certain to persist. These, as I have just argued, are the outcome of currently still not sufficiently sustainably framed policies. This, in turn, reflects a lack of progress at the domestic level, rather than a failure of the system itself.
As I have said, the international monetary system after Bretton Woods was characterised by flexible exchange rates between the most important currency blocs. The system only moved into disequilibrium as a result of the growing economic weight of emerging economies that have kept their exchange rates at artificially low levels via massive accumulation of reserves. At the same time, expansionary economic policies in some advanced economies, on account of the massive capital inflows from emerging economies, were the flip-side to the build-up of imbalances.
The window of opportunity to change the relevant policy frameworks is closing quickly as global growth is resuming and the cyclical determinants that led to the temporary unwinding of imbalances disappear. In addition, with the two-speed recovery and different cyclical positions, political interests have started to diverge again between the major currency blocs. The corrective mechanism hence needs to be restored. Greater flexibility in the exchange rates of major emerging economies is in this respect a fundamental precondition for a stable international monetary system. At the same time, macroeconomic policies should avoid the externalisation of domestic imbalances to the global economy. Hence, the restoration of a stable international monetary system based on flexible exchange rates requires a fundamental change in economic mind-set across the global economy, rather sooner than later.
$$$$$$ US GLOBAL CURRENCY
Of these, the U.S. dollar is the most popular. It makes up 64 percent of all known central bank foreign exchange reserves. That makes it the de facto global currency, even though it doesn't hold an official global title.
In fact, the world has 185 currencies according to the International Standards Organization List. Most of these currencies are only used inside their own countries. Any one of them could theoretically replace the dollar as the world's currency. But they probably won't for a wide variety of reasons.
The next closest reserve currency is the euro. Only 19.9 percent of known central bank foreign currency reserves were in euros as of the second quarter 2017. The chance of the euro becoming a world currency increases as the eurozone crisis fades. But the crisis highlights the difficulties of creating a world currency.
The U.S. Dollar Is the Strongest World Currency
The relative strength of the U.S. economy supports the value of its currency. It's the reason the dollar is the most powerful currency. Around $580 billion in U.S. bills are used outside the country. That's 65 percent of all dollars. That includes 75 percent of $100 bills, 55 percent of $50 bills and 60 percent of $20 bills. Most of these bills are in the former Soviet Union countries and in Latin America.
Cash is just one indication of the role of the dollar as a world currency. More than one-third of the world's gross domestic product comes from countries that peg their currencies to the dollar. That includes seven countries that have adopted the dollar. Another 89 keep their currency in a tight trading range relative to the dollar.
In the foreign exchange market, the dollar rules. More than 85 percent of forex trading involves the U.S. dollar. Furthermore, 39 percent of the world's debt is issued in dollars. As a result, foreign banks require a lot of dollars to conduct business. For example, during the 2008 financial crisis, non-U.S. banks had $27 trillion in international liabilities denominated in foreign currencies. Of that, $18 trillion was in U.S. dollars. The U.S. Federal Reserve increased its dollar swap line to keep the world's banks from running out of dollars.
The financial crisis made the dollar even more widely used. In 2017, the banks of Japan, Germany, France and the United Kingdom held more liabilities denominated in dollars than in their own currencies. Bank regulations enacted to prevent another crisis are making dollars scarce. To make matters worse, the Federal Reserve is increasing the fed funds rate. That's decreases the money supply by making dollars more expensive to borrow.
Another indication of the dollar's strength is how willing governments are to hold the dollar in their foreign exchange reserves. Governments acquire currencies from their international transactions. They also receive them from domestic businesses and travelers who redeem them for local currencies.
In addition, some governments invest their reserves in foreign currencies. Others, such as China and Japan, deliberately buy the currencies of their main export partners. They try to keep their currencies cheaper in comparison so their exports are competitively priced.
Why the Dollar Is the Global Currency
The 1944 Bretton Woods agreement kickstarted the dollar into its current position. Before then, most countries were on the gold standard. Their governments promised to redeem their currencies for their value in gold upon demand. The world's developed countries met at Bretton Woods, New Hampshire, to peg the exchange rate for all currencies to the U.S. dollar. At that time, the United States held the largest gold reserves. This agreement allowed other countries to back their currencies with dollars, rather than gold.
By the early 1970s, countries began demanding gold for the dollars they held. They needed to combat inflation. Rather than allow Fort Knox to be depleted of all its reserves, President Nixon separated the dollar from gold. By that time, the dollar had already become the world's dominant reserve currency.
+++++++++++++++++++++++++++++++++++++++++++++++++
The dollar as a tool of world currency accumulator
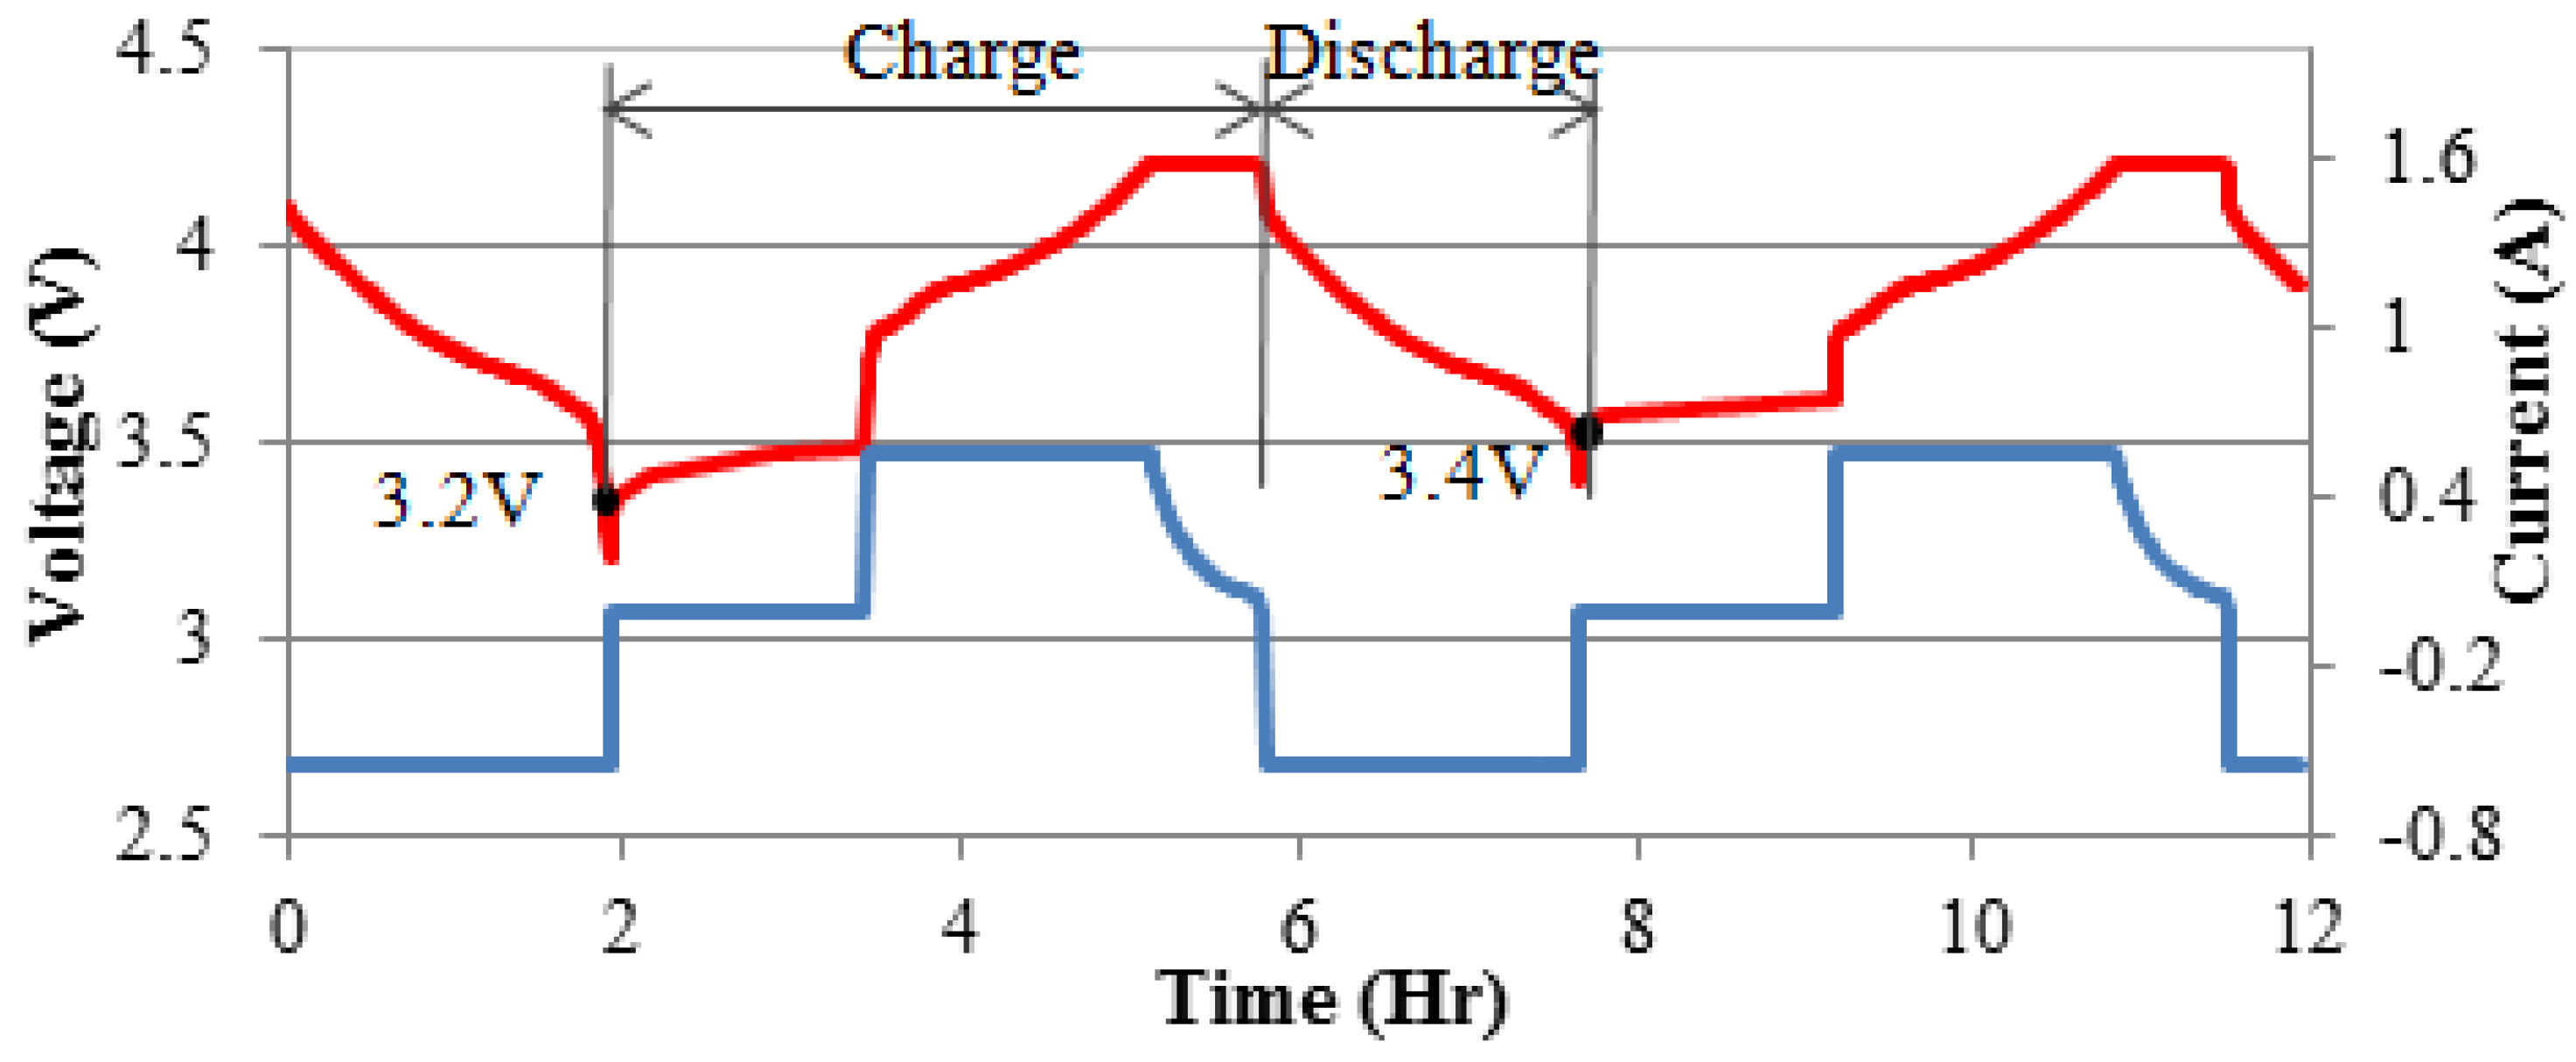

++++++++++++++++++++++++++++++++++++++++++++++++++++++++++++++++++++++++