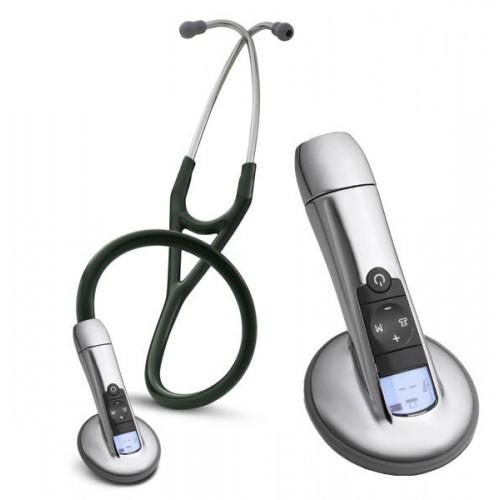
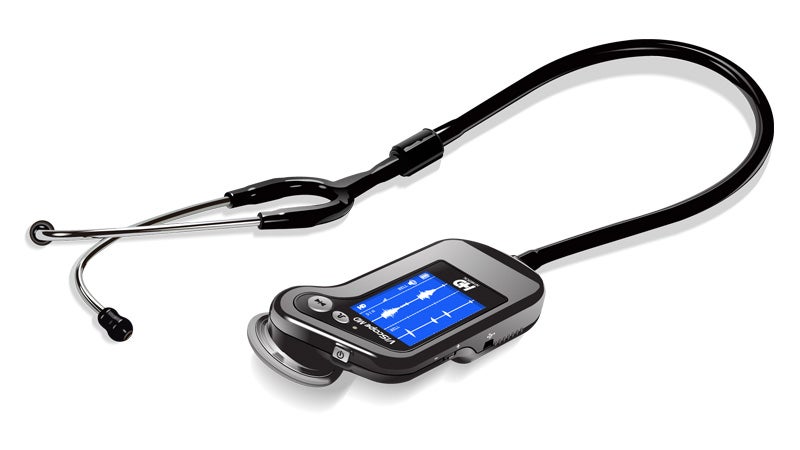
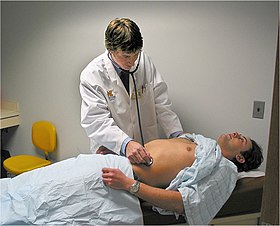
stethoscope

How to Take Your Pulse

One of most common arteries for counting your pulse are the radial artery, located on the inside of the wrist near the side of your thumb.
The heart is a muscle. It pushes blood through the arteries, causing them to expand and contract in response to the flow of blood. You can feel the expansions and contractions, your pulse or heartbeat, in many places throughout the body where an artery passes close to the skin. Taking your pulse — measuring how many times the heart beats in a minute — helps make you aware of your heart rhythm and the strength of your heartbeat.
For most people, heart rate and pulse rate are the same. However, the two are technically different: Heart rate measures the rate of contractions of the heart, while pulse rate measures the rate at which blood pressure increases throughout the body. In individuals with specific heart conditions that prevent the heart from pumping blood efficiently with each contraction, the pulse rate can be lower than the heart rate. But that is an exception.
Types of pulses
The best places to take your pulse are at your wrist, inside the elbow, at the side of your neck or on the top of your foot, according to The American Heart Association. You can also take your pulse at your groin, on your temple or behind your knees.
The pulse felt on the neck is called the carotid pulse. When felt on the groin, it is called the femoral pulse. The pulse at your wrist is called the radial pulse. The pedal pulse is on the foot, and the brachial pulse is under the elbow.
The apical pulse is the pulse over the top of the heart, as typically heard through a stethoscope with the patient lying on his or her left side. The heartbeat consists of two distinct sounds — often referred to as "lub-dub" — and each lub-dub counts as a beat. The normal apical pulse rate of an adult is 60 to 100 beats.


Another common place to take your pulse is the carotid artery, found on the neck between the wind pipe and neck muscle.
Short of performing an electrocardiogram, doctors find that taking the apical pulse is the most accurate, noninvasive way of assessing cardiac health. The apical pulse provides information on count, rhythm, strength and quality of the heart.
Taking your pulse
Taking your pulse is easy, especially if you do it at your wrist or neck. Simply lay your index and third fingers on the inside of your wrist below the base of your thumb, between the bone and the tendon. This spot is over the radial artery. When you feel the thump of your pulse, count the beats for 15 seconds. Multiply the count by four to calculate the number of beats per minute.
To take your pulse at your neck, do the same thing but lay your index and third fingers on the neck in the hollow beside your Adam's apple or windpipe.
What is an average pulse rate?
A normal resting heart rate for adults ranges from 60 to 100 beats per minute (bpm), according to The Mayo Clinic. Women tend to have a slightly higher heart rate than men; the average resting heart rate in women is in the mid-70s, while it is only about 70 in men. This is primarily due to the fact that the male heart muscle is stronger.
Other factors can affect resting heart rate, too, including age, body size, fitness level, heart conditions, whether you're sitting or standing, medication, emotions, and even air temperature.
Generally, people with good cardiovascular fitness, such as athletes, experience a lower resting heart rate, sometimes 40 or below.
The following are healthy pulse rate guidelines recommended by The National Institutes of Health:
- Newborns up to 1 month old: 70 to 190 bpm
- Infants 1 to 11 months old: 80 to 160 bpm
- Children 1 to 2 years old: 80 to 130 bpm
- Children 3 to 4 years old: 80 to 120 bpm
- Children 5 to 6 years old: 75 to 115 bpm
- Children 7 to 9 years old: 70 to 110 bpm
- Children 10 years and older, and adults (including seniors): 60 to 100 bpm
- Well-trained athletes: 40 to 60 bpm
What Should My Pulse Be - How to Check Your Pulse Rate - BPM Chart
Instructions on how to check your pulse rate (bpm) includes a normal beats per minute pulse rate charts for children and adults.
By checking your pulse, and comparing the resulting beats per minute (BPM) using the pulse rate chart below, you can find out how well your heart is working, as well as your general health and fitness levels.
Pulse:
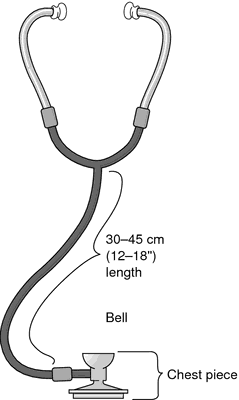
Your pulse is defined as the rate at which your heart beats. Your pulse is usually called your heart rate, which is the number of times your heart beats each minute (bpm). The pulse may be palpated in any place that allows an artery to be compressed against a bone, such as at the neck (carotid artery), at the wrist (radial artery), behind the knee (popliteal artery), on the inside of the elbow (brachial artery), and near the ankle joint (posterior tibial artery). The pulse can also be measured by listening to the heart beat directly (auscultation), traditionally using a stethoscope. You check your pulse rate by counting the beats in a set period of time (at least 15 to 20 seconds) and multiplying that number to get the number of beats per minute.
Pulse rates vary from person to person. The normal pulse rate for humans is usually 60 to 100 beats per minute, however, there are certain medical conditions such as cardiac arrhythmia which may alter the normal pulse rate of an individual. Other influencing factors include your age, gender and fitness level.
How To Check Your Pulse Rate
 Checking pulse rate on the wristYou can measure your pulse rate anywhere an artery comes close to the skin, such as in your wrist, neck, temple area, groin, behind the knee, or top of your foot.
- WristYou can check your pulse rate by placing tips of your index, second and third fingers on the palm side of your other wrist, below the base of the thumb or on your lower neck, on either side of your windpipe. Do not use your thumb because it has its own pulse that you may feel.
- Carotid ArteryThis is located in your neck, on either side of your windpipe. Be careful when checking your pulse in this location, especially if you are older than 65. If you press too hard, you may become lightheaded and dizzy.
- Heart BeatYour pulse can also be measured by listening to the heart beat directly (auscultation), traditionally using a stethoscope.
- Pulse MeterElectronic pulse meters automatically check your pulse in your finger, wrist, or chest. These devices are helpful if you have trouble measuring your pulse or if you wish to check your pulse while you exercise. Some exercise machines such as treadmills have a pulse meter built into the device.
- Beats Per MinuteCount the beats for 15 seconds and multiply this number by 4 to get your pulse per minute. Checking your pulse rates when resting, during exercises or after it, provides general information about your overall fitness level.
| Baby and Child Pulse Rate (BPM) |
|---|
| 1st month of life - 70-190 bpm |
| Between 1 and 11 mths - 80-160 bpm |
| 1 and 2 yrs - 80-130 bpm |
| 3 and 4 yrs - 80-120 bpm |
| 5 and 6 yrs - 75-115 bpm |
| Between 7 and 9 yrs - 70-110 bpm |
| 10 years of age plus - 60-100 bpm |
The chart below shows target heart rates for different ages. An adults maximum heart rate is around 220 bpm minus your age.
| Average Pulse Rate for Adults | ||
|---|---|---|
| Age | Target Heart Rate 50 - 85% | Average Maximum Heart Rate 100% |
| 20 years | 100-170 beats per minute | 200 beats per minute |
| 30 yrs | 95-162 bpm | 190 bpm |
| 35 yrs | 93-157 bpm | 185 bpm |
| 40 yrs | 90-153 bpm | 180 bpm |
| 45 yrs | 88-149 bpm | 175 bpm |
| 50 yrs | 85-145 bpm | 170 bpm |
| 55 yrs | 83-140 bpm | 165 bpm |
| 60 yrs | 80-136 bpm | 160 bpm |
| 65 yrs | 78-132 bpm | 155 bpm |
| 70 yrs | 75-128 bpm | 150 bpm |
Explanations
- TachycardiaMeans the heart is beating too fast at rest (usually over 100 beats a minute (BPM))
- BradycardiaA heart rate that is too slow (usually below 60 beats a minute(BPM))
- Target Heart RateYou gain the most benefits and lessen the risks when you exercise in your target heart rate zone. Usually this is when your exercise heart rate (pulse) is 60 percent to 80 percent of your maximum heart rate .
- Maximum Heart RateThe maximum heart rate is the highest your pulse rate can get. To calculate your predicted maximum heart rate, use the formula: 220 - Your Age = Predicted Maximum Heart Rate
Apical Pulse
Your pulse is the vibration of blood as your heart pumps it through your arteries. You can feel your pulse by placing your fingers over a large artery that lies close to your skin.
The apical pulse is one of eight common arterial pulse sites. It can be found in the left center of your chest, just below the nipple. This position roughly corresponds to the lower (pointed) end of your heart.
Listening to the apical pulse is basically listening directly to the heart. It’s a very reliable and noninvasive way to evaluate cardiac function. It’s also the preferred method for measuring heart rate in children.
A stethoscope is used to measure the apical pulse. A clock or wristwatch with seconds is also needed.
The apical pulse is best assessed when you are either sitting or lying down.
Your doctor will use a series of “landmarks” on your body to identify what’s called the point of maximal impulse (PMI). These landmarks include:
- the bony point of your sternum (breastbone)
- the intercostal spaces (the spaces between your rib bones)
- the midclavicular line (an imaginary line moving down your body starting from the middle of your collarbone)
Starting from the bony point of your breastbone, your doctor will locate the second space between your ribs. They’ll then move their fingers down to the fifth space between your ribs and slide them over to the midclavicular line. The PMI should be found here.
Once the PMI has been located, your doctor will use the stethoscope to listen to your pulse for a full minute in order to obtain your apical pulse rate. Each “lub-dub” sound your heart makes counts as one beat.
An apical pulse rate is typically considered abnormal in an adult if it’s above 100 beats per minute (bpm) or below 60 bpm. Your ideal heart rate at rest and during physical activity are very different.
Children have a higher resting pulse rate than adults. The normal resting pulse ranges for children are as follows:
- newborn: 100–170 bpm
- 6 months to 1 year: 90–130 bpm
- 2 to 3 years: 80–120 bpm
- 4 to 5 years: 70–110 bpm
- 10 years and older: 60–100 bpm
When the apical pulse is higher than expected, your doctor will evaluate you for the following things:
- fear or anxiety
- fever
- recent physical activity
- pain
- hypotension (low blood pressure)
- blood loss
- insufficient oxygen intake
Additionally, a heart rate that is consistently higher than normal could be a sign of heart disease, heart failure, or an overactive thyroid gland.
When the apical pulse is lower than expected, your doctor will check for medication that may be affecting your heart rate. Such medications include beta-blockers given for high blood pressure or anti-dysrhythmic medications given for irregular heartbeat.
Pulse deficit
If your doctor finds that your apical pulse is irregular, they’ll likely check for the presence of a pulse deficit. You doctor may also request that you have an electrocardiogram.
Two people are needed to assess pulse deficit. One person measures the apical pulse while the other person measures a peripheral pulse, such as the one in your wrist. These pulses will be counted at the same time for one full minute, with one person giving the signal to the other to start counting.
Once the pulse rates have been obtained, the peripheral pulse rate is subtracted from the apical pulse rate. The apical pulse rate will never be lower than the peripheral pulse rate. The resulting number is the pulse deficit. Normally, the two numbers would be the same, resulting in a difference of zero. However, when there’s a difference, it’s called a pulse deficit.
The presence of a pulse deficit indicates that there may be an issue with cardiac function or efficiency. When a pulse deficit is detected, it means that the volume of blood pumped from the heart may not be sufficient to meet the needs of your body’s tissues.
Listening to the apical pulse is listening directly to your heart. It’s the most efficient way to evaluate heart function.
If your pulse is outside of the normal range or you have an irregular heartbeat, your doctor will evaluate you further.
Auscultation (based on the Latin verb auscultare "to listen") is listening to the internal sounds of the body, usually using a stethoscope. Auscultation is performed for the purposes of examining the circulatory and respiratory systems (heart and breath sounds), as well as the gastrointestinal system (bowel sounds).
The term was introduced by René Laennec. The act of listening to body sounds for diagnostic purposes has its origin further back in history, possibly as early as Ancient Egypt. (Auscultation and palpation go together in physical examination and are alike in that both have ancient roots, both require skill, and both are still important today.) Laënnec's contributions were refining the procedure, linking sounds with specific pathological changes in the chest, and inventing a suitable instrument (the stethoscope) to mediate between the patient's body and the clinician's ear.
Auscultation is a skill that requires substantial clinical experience, a fine stethoscope and good listening skills. Health professionals (doctors, nurses, etc.) listen to three main organs and organ systems during auscultation: the heart, the lungs, and the gastrointestinal system. When auscultating the heart, doctors listen for abnormal sounds, including heart murmurs, gallops, and other extra sounds coinciding with heartbeats. Heart rate is also noted. When listening to lungs, breath sounds such as wheezes, crepitations and crackles are identified. The gastrointestinal system is auscultated to note the presence of bowel sounds.
Electronic stethoscopes can be recording devices, and can provide noise reduction and signal enhancement. This is helpful for purposes of telemedicine (remote diagnosis) and teaching. This opened the field to computer-aided auscultation. Ultrasonography (US) inherently provides capability for computer-aided auscultation, and portable US, especially portable echocardiography, replaces some stethoscope auscultation (especially in cardiology), although not nearly all of it (stethoscopes are still essential in basic checkups, listening to bowel sounds, and other primary care contexts).
Respiratory sounds, breath sounds, or lung sounds refer to the specific sounds generated by the movement of air through the respiratory system. These may be easily audible or identified through auscultation of the respiratory system through the lung fields[1] with a stethoscope as well as from the spectral chacteristics of lung sounds.[2] These include normal breath sounds and adventitious or "added" sounds such as rales, wheezes, pleural friction rubs, stertor and stridor.
Description and classification of the sounds usually involve auscultation of the inspiratory and expiratory phases of the breath cycle, noting both the pitch (typically described as low, medium or high) and intensity (soft, medium, loud or very loud) of the sounds heard.

1) area for normal tracheal sound, 2) area for ascultation of upper lung fields, 3) area for normal bronchial sound. Blue marks ascultation area and red line marks heart.
Continued
- Rales: Small clicking, bubbling, or rattling sounds in the lungs. They are heard when a person breathes in (inhales). They are believed to occur when air opens closed air spaces. Rales can be further described as moist, dry, fine, and coarse.
- Rhonchi: Sounds that resemble snoring. They occur when air is blocked or air flow becomes rough through the medium-sized airways, most often with secretions. Citation needed
- Stridor: Wheeze-like sound heard when a person breathes. Usually it is due to a blockage of airflow in the windpipe (trachea) or in the back of the throat.
- Wheezing: High-pitched sounds produced by narrowed airways. They are most often heard when a person breathes out (exhales). Wheezing and other abnormal sounds can sometimes be heard without a stethoscope.[4]
Other tests of auscultation
Pectoriloquy, egophony and bronchophony are tests of auscultation. For example, in whispered pectoriloquy the person being examined whispers - typically a two syllable number as the clinician listens over the lung fields. The whisper is not normally heard over the lungs, but if heard may be indicative of pulmonary consolidation in that area. This is because sound travels differently through denser (fluid or solid) media than the air that should normally be predominant in lung tissue. In egophony, the person being examined continually speaks the English long-sound "E". The lungs are usually air filled, but if there is an abnormal solid component due to infection, fluid, or tumor, the higher frequencies of the "E" sound will be diminished. This changes the sound produced, from a long "E" sound to a long "A" sound.
Abnormal breath sounds
Common types of abnormal breath sounds include the following:
| Name | Continuous/discontinuous | Frequency/Pitch | Inspiratory/expiratory | Quality | Associated conditions | Example | ||||
|---|---|---|---|---|---|---|---|---|---|---|
| Wheeze or rhonchi | continuous | high (wheeze) or lower (rhonchi) | expiratory or inspiratory | whistling/sibilant, musical | Caused by narrowing of airways, such as in asthma, chronic obstructive pulmonary disease, foreign body. |
| ||||
| Stridor | continuous | high | either, mostly inspiratory | whistling/sibilant, musical | epiglottitis, foreign body, laryngeal oedema, croup |
| ||||
| Inspiratory gasp | continuous | high | inspiratory | whoop | pertussis (whooping cough) | see New England Journal of Medicine, Classic Whooping Cough sound file, Supplement to the N Engl J Med 2004; 350:2023-2026 | ||||
| Crackles (aka crepitations or rales) | discontinuous | high (fine) or low (coarse), nonmusical | inspiratory | cracking/clicking/rattling | pneumonia, pulmonar edema, tuberculosis, bronchitis |
| ||||
| Pleural friction rub | continuous | low | inspiratory and expiratory | nonmusical, many repeated rhythmic sounds | inflammation of lung linings, lung tumors | not available | ||||
| Hamman's sign (or Mediastinal crunch) | discontinuous | neither (heartbeat) | crunching, rasping | pneumomediastinum, pneumopericardium | not available | |||||

Heart sounds are the noises generated by the beating heart and the resultant flow of blood through it. Specifically, the sounds reflect the turbulence created when the heart valves snap shut. In cardiac auscultation, an examiner may use a stethoscope to listen for these unique and distinct sounds that provide important auditory data regarding the condition of the heart.
In healthy adults, there are two normal heart sounds, often described as a lub and a dub (or dup), that occur in sequence with each heartbeat. These are the first heart sound (S1) and second heart sound (S2), produced by the closing of the atrioventricular valves and semilunar valves, respectively. In addition to these normal sounds, a variety of other sounds may be present including heart murmurs, adventitious sounds, and gallop rhythms S3 and S4.
Heart murmurs are generated by turbulent flow of blood and a murmur to be heard as turbulent flow must require pressure difference of at least 30 mm of hg between the chambers and the pressure dominant chamber will out flow the blood to non dominant chamber in diseased condition which leads to Left-to-right shunt or Right-to-left shunt based on the pressure dominance. Turbulent may occur inside or outside the heart if its outside heart its called Bruit. Murmurs may be physiological (benign) or pathological (abnormal). Abnormal murmurs can be caused by stenosis restricting the opening of a heart valve, resulting in turbulence as blood flows through it. Abnormal murmurs may also occur with valvular insufficiency (regurgitation), which allows backflow of blood when the incompetent valve closes with only partial effectiveness. Different murmurs are audible in different parts of the cardiac cycle, depending on the cause of the murmur.
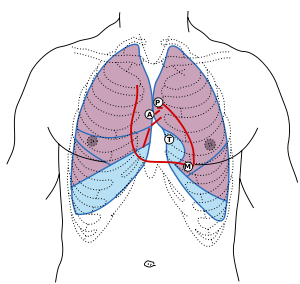
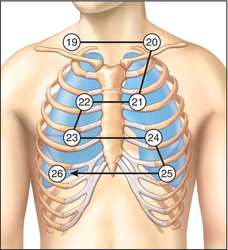
Front of thorax, showing surface relations of bones, lungs (purple), pleura (blue), and heart (red outline). The locations of best auscultation for each heart valve are labeled with "M", "T", "A", and "P".
First heart sound: caused by atrioventricular valves – Mitral (M) and Tricuspid (T).
Second heart sound caused by semilunar valves – Aortic (A) and Pulmonary/Pulmonic (P).
Primary heart sounds
Normal heart sounds are associated with heart valves closing:
S1
The first heart sound, or S1, forms the "lub" of "lub-dub" and is composed of components M1 (mitral valve closure) and T1 (tricuspid valve closure). Normally M1 precedes T1 slightly. It is caused by the closure of the atrioventricular valves, i.e. tricuspid and mitral (bicuspid), at the beginning of ventricular contraction, or systole. When the ventricles begin to contract, so do the papillary muscles in each ventricle. The papillary muscles are attached to the cusps or leaflets of the tricuspid and mitral valves via chordae tendineae (heart strings). When the papillary muscles contract, the chordae tendineae become tense and thereby prevent the backflow of blood into the lower pressure environment of the atria. The chordae tendineae act a bit like the strings on a parachute, and allow the leaflets of the valve to balloon up into the atria slightly, but not so much as to evert the cusp edges and allow back flow of blood. It is the pressure created from ventricular contraction that closes the valve, not the papillary muscles themselves. The contraction of the ventricle begins just prior to AV valves closing and prior to the semilunar valves opening. The sudden tensing of the chordae tendineae and the squeezing of the ventricles against closed semilunar valves, sends blood rushing back toward the atria, and the parachute-like valves catch the rush of blood in their leaflets causing the valve to snap shut. The S1 sound results from reverberation within the blood associated with the sudden block of flow reversal by the valves. The delay of T1 even more than normally causes the split S1 which is heard in a right bundle branch blockage.
S2
The second heart sound, or S2, forms the "dub" of "lub-dub" and is composed of components A2 (aortic valve closure) and P2 (pulmonary valve closure). Normally A2 precedes P2 especially during inspiration where a split of S2 can be heard. It is caused by the closure of the semilunar valves (the aortic valve and pulmonary valve) at the end of ventricular systole and the beginning of ventricular diastole. As the left ventricle empties, its pressure falls below the pressure in the aorta. Aortic blood flow quickly reverses back toward the left ventricle, catching the pocket-like cusps of the aortic valve, and is stopped by aortic valve closure. Similarly, as the pressure in the right ventricle falls below the pressure in the pulmonary artery, the pulmonary valve closes. The S2 sound results from reverberation within the blood associated with the sudden block of flow reversal.
Splitting of S2, also known as physiological split, normally occurs during inhalation because the decrease in intrathoracic pressure increases the time needed for pulmonary pressure to exceed that of the right ventricular pressure. A widely split S2 can be associated with several different cardiovascular conditions, including left bundle branch block, pulmonary stenosis, and atrial septal defect.
Extra heart sounds
The rarer extra heart sounds form gallop rhythms and are heard in both normal and abnormal situations.
S3
Rarely, there may be a third heart sound also called a protodiastolic gallop, ventricular gallop, or informally the "Kentucky" gallop as an onomatopoeic reference to the rhythm and stress of S1 followed by S2 and S3 together (S1=Ken; S2=tuck; S3=y).[1]
"lub-dub-ta" or "slosh-ing-in" If new, indicates heart failure or volume overload.
It occurs at the beginning of diastole after S2 and is lower in pitch than S1 or S2 as it is not of valvular origin. The third heart sound is benign in youth, some trained athletes, and sometimes in pregnancy but if it re-emerges later in life it may signal cardiac problems, such as a failing left ventricle as in dilated congestive heart failure (CHF). S3 is thought to be caused by the oscillation of blood back and forth between the walls of the ventricles initiated by blood rushing in from the atria. The reason the third heart sound does not occur until the middle third of diastole is probably that during the early part of diastole, the ventricles are not filled sufficiently to create enough tension for reverberation.
It may also be a result of tensing of the chordae tendineae during rapid filling and expansion of the ventricle. In other words, an S3 heart sound indicates increased volume of blood within the ventricle. An S3 heart sound is best heard with the bell-side of the stethoscope (used for lower frequency sounds). A left-sided S3 is best heard in the left lateral decubitus position and at the apex of the heart, which is normally located in the 5th left intercostal space at the midclavicular line. A right-sided S3 is best heard at the lower-left sternal border. The way to distinguish between a left and right-sided S3 is to observe whether it increases in intensity with inhalation or exhalation. A right-sided S3 will increase on inhalation, while a left-sided S3 will increase on exhalation.
S3 can be a normal finding in young patients but is generally pathologic over the age of 40. The most common cause of pathologic S3 is congestive heart failure.
S4
S4 when audible in an adult is called a presystolic gallop or atrial gallop. This gallop is produced by the sound of blood being forced into a stiff or hypertrophic ventricle.
"ta-lub-dub" or "a-stiff-wall"
It is a sign of a pathologic state, usually a failing or hypertrophic left ventricle, as in systemic hypertension, severe valvular aortic stenosis, and hypertrophic cardiomyopathy. The sound occurs just after atrial contraction at the end of diastole and immediately before S1, producing a rhythm sometimes referred to as the "Tennessee" gallop where S4 represents the "Ten-" syllable.[1] It is best heard at the cardiac apex with the patient in the left lateral decubitus position and holding his breath. The combined presence of S3 and S4 is a quadruple gallop, also known as the "Hello-Goodbye" gallop. At rapid heart rates, S3 and S4 may merge to produce a summation gallop, sometimes referred to as S7.
Atrial contraction must be present for production of an S4. It is absent in atrial fibrillation and in other rhythms in which atrial contraction does not precede ventricular contraction.
Murmurs

Heart murmurs are produced as a result of turbulent flow of blood strong enough to produce audible noise. They are usually heard as a whooshing sound. The term murmur only refers to a sound believed to originate within blood flow through or near the heart; rapid blood velocity is necessary to produce a murmur. Most heart problems do not produce any murmur and most valve problems also do not produce an audible murmur.
Murmurs can be heard in many situations in adults without major congenital heart abnormalities:
- Regurgitation through the mitral valve is by far the most commonly heard murmur, producing a pansystolic/holosystolic murmur which is sometimes fairly loud to a practiced ear, even though the volume of regurgitant blood flow may be quite small. Yet, though obvious using echocardiography visualization, probably about 20% of cases of mitral regurgitation do not produce an audible murmur.
- Stenosis of the aortic valve is typically the next most common heart murmur, a systolic ejection murmur. This is more common in older adults or in those individuals having a two-leaflet, not a three-leaflet, aortic valve.
- Regurgitation through the aortic valve, if marked, is sometimes audible to a practiced ear with a high quality, especially electronically amplified, stethoscope. Generally, this is a very rarely heard murmur, even though aortic valve regurgitation is not so rare. Aortic regurgitation, though obvious using echocardiography visualization, usually does not produce an audible murmur.
- Stenosis of the mitral valve, if severe, also rarely produces an audible, low frequency soft rumbling murmur, best recognized by a practiced ear using a high quality, especially electronically amplified, stethoscope.
- Other audible murmurs are associated with abnormal openings between the left ventricle and right heart or from the aortic or pulmonary arteries back into a lower pressure heart chamber.
| Gradations of Murmurs[1] | (Defined based on use of an acoustic, not a high-fidelity amplified electronic stethoscope) |
|---|---|
| Grade | Description |
| Grade 1 | Very faint, heard only after listener has "tuned in"; may not be heard in all positions. Only heard if the patient "bears down" or performs the Valsalva maneuver. |
| Grade 2 | Quiet, but heard immediately after placing the stethoscope on the chest. |
| Grade 3 | Moderately loud. |
| Grade 4 | Loud, with palpable thrill (a tremor or vibration felt on palpation)[2] |
| Grade 5 | Very loud, with thrill. May be heard when stethoscope is partly off the chest. |
| Grade 6 | Very loud, with thrill. May be heard with stethoscope entirely off the chest. |
Though several different cardiac conditions can cause heart murmurs, the murmurs can change markedly with the severity of the cardiac disease. An astute physician can sometimes diagnose cardiac conditions with some accuracy based largely on the murmur, related physical examination, and experience with the relative frequency of different heart conditions. However, with the advent of better quality and wider availability of echocardiography and other techniques, heart status can be recognized and quantified much more accurately than formerly possible with only a stethoscope, examination, and experience. Another advantage to the use of the echocardiogram is that the devices can be hand held.
Effects of breathing
Inhalation decreases intrathoracic pressure which allows more venous blood to return to the right heart (pulling blood into the right side of the heart via a vacuum-like effect). Therefore, right-sided heart murmurs generally increase in intensity with inhalation. The decreased (more negative) intrathoracic pressure has an opposite effect on the left side of the heart, making it harder for the blood to exit into circulation. Therefore, left-sided murmurs generally decrease in intensity during inhalation. Increasing venous blood return to the right side of the heart by raising a patient's legs to a 45-degree while lying supine produces similar effect which occurs during inhalation. Inhalation can also produce a non-pathological split S2 which will be heard upon auscultation.
With exhalation, the opposite haemodynamic changes occur: left-sided murmurs generally increase in intensity with exhalation.
Interventions that change murmurs
There are a number of interventions that can be performed that alter the intensity and characteristics of abnormal heart sounds. These interventions can differentiate the different heart sounds to more effectively obtain a diagnosis of the cardiac anomaly that causes the heart sound.
Other abnormal sounds
Clicks – Heart clicks are short, high-pitched sounds that can be appreciated with modern non-invasive imaging techniques.
Rubs – The pericardial friction rub can be heard in pericarditis, an inflammation of the pericardium, the sac surrounding the heart. This is a characteristic scratching, creaking, high-pitched sound emanating from the rubbing of both layers of inflamed pericardium. It is the loudest in systole, but can often be heard at the beginning and at the end of diastole. It is very dependent on body position and breathing, and changes from hour to hour.
Surface anatomy
The aortic area, pulmonic area, tricuspid area and mitral area are areas on the surface of the chest where the heart is auscultated. Heart sounds result from reverberation within the blood associated with the sudden block of flow reversal by the valves closing. Because of this, auscultation to determine function of a valve is usually not performed at the position of the valve, but at the position to where the sound waves reverberate.
| Aortic valve (to aorta) | right second intercostal space | upper right sternal border |
| Pulmonary valve (to pulmonary trunk) | left second intercostal space | upper left sternal border |
| Erb's point | Left third intercostal space | left sternal border |
| Tricuspid valve (to right ventricle) | left fourth, fifth intercostal spaces | lower left sternal border |
| Mitral valve (to left ventricle) | left fifth intercostal space | left midclavicular line |
Recording heart sounds
Using electronic stethoscopes, it is possible to record heart sounds via direct output to an external recording device, such as a laptop or MP3 recorder. The same connection can be used to listen to the previously recorded auscultation through the stethoscope headphones, allowing for more detailed study of murmurs and other heart sounds, for general research as well as evaluation of a particular patient's condition.
Introduction to Digital Stethoscopes and Electrical Component Selection Criteria
This application note provides an overview of the basic operation and design considerations for a digital stethoscope. The similarities between a digital stethoscope and an acoustic stethoscope, which is the older generation of the instrument, are explained. The article then outlines the more sophisticated features of the newer digital designs, including audio recording and playback. When discussing design considerations for a digital stethoscope, it details the importance of the audio signal path, presents considerations for audio codec electronics, and outlines the audio frequency requirements for cardiac and pulmonary sound. The article also addresses the system's subfunctions which include data storage and transfer, display and backlighting, power management, and battery management.
The goal of a basic digital stethoscope is to have it retain the look and feel of an acoustic stethoscope but to improve listening performance. In addition, high-end digital stethoscopes offer sophisticated capabilities such as audio recording and playback. They also provide data to visually chart results by connecting to an off-instrument display such as a computer monitor. This advanced functionality increases the physician's diagnostic capability. Maintaining the existing acoustic stethoscope form (i.e., that "look and feel") while improving the performance digitally requires the use of small, low-power solutions.
The analog voltage needs to be conditioned and then converted into a digital signal using an audio analog-to-digital converter (ADC) or audio codec. Some digital stethoscopes have noise cancellation that requires a secondary sound transducer or microphone to record the ambient noise so that it can be removed digitally. In this approach, two audio ADCs are required.

Functional block diagram of a digital stethoscope.
Once in the digital domain, a microcontroller unit (MCU) or digital signal processor (DSP) performs signal processing, including ambient noise reduction and filtering, to limit the bandwidth to the range for cardiac or pulmonary listening. The processed digital signal is then converted back to analog by an audio digital-to-analog converter (DAC) or audio codec.
A headphone or speaker amplifier conditions the audio signal before outputting to a speaker. A single speaker can be used below where the stethoscope tube bifurcates, with the amplified sound traveling through the binaural tubes to the ears. Alternatively, two speakers can be used, with one speaker at the end of each earpiece. The frequency response of the speaker is similar to that of a bass speaker because of the low-frequency sound production needed. Depending on the implementation, one or two speaker amplifiers are used.
A stethoscope must be most sensitive to cardiac sound in the 20Hz to 400Hz range and to pulmonary sound in the 100Hz to 1200Hz range. Note that the frequency ranges vary by manufacturer, and the DSP algorithms filter out sound beyond these optimal ranges.
If a single 1.5V battery is installed, the switching regulator will probably be on all the time, making low quiescent current a critical factor for long battery life. The longer the battery life, the more convenient the digital stethoscope is to use and the closer the experience will be to an acoustic stethoscope.
When using two 1.5V batteries in series, the switching regulator can be left on all the time or shut down when not in use. If the circuit operates from 3.6V down to 1.8V, then a switching regulator may not be needed. Cost will be reduced and space saved. A low-battery warning is required so that a patient's examination need not be interrupted to replace the battery.
Overview
A stethoscope, whether acoustic or digital, is used mainly to listen to heart and lung sounds in the body as an aid to diagnosis. Listening, or auscultation, has been done with acoustic stethoscopes for almost two hundred years; recently, electronic digital stethoscopes have been developed.The goal of a basic digital stethoscope is to have it retain the look and feel of an acoustic stethoscope but to improve listening performance. In addition, high-end digital stethoscopes offer sophisticated capabilities such as audio recording and playback. They also provide data to visually chart results by connecting to an off-instrument display such as a computer monitor. This advanced functionality increases the physician's diagnostic capability. Maintaining the existing acoustic stethoscope form (i.e., that "look and feel") while improving the performance digitally requires the use of small, low-power solutions.
Audio Signal Path
The essential elements of a digital stethoscope are the sound transducer, the audio codec electronics, and the speakers. The sound transducer, which converts sound into an analog voltage, is the most critical piece in the chain. It determines the diagnostic quality of the digital stethoscope and ensures a familiar user experience to those accustomed to acoustic stethoscopes.The analog voltage needs to be conditioned and then converted into a digital signal using an audio analog-to-digital converter (ADC) or audio codec. Some digital stethoscopes have noise cancellation that requires a secondary sound transducer or microphone to record the ambient noise so that it can be removed digitally. In this approach, two audio ADCs are required.
Functional block diagram of a digital stethoscope.
Once in the digital domain, a microcontroller unit (MCU) or digital signal processor (DSP) performs signal processing, including ambient noise reduction and filtering, to limit the bandwidth to the range for cardiac or pulmonary listening. The processed digital signal is then converted back to analog by an audio digital-to-analog converter (DAC) or audio codec.
A headphone or speaker amplifier conditions the audio signal before outputting to a speaker. A single speaker can be used below where the stethoscope tube bifurcates, with the amplified sound traveling through the binaural tubes to the ears. Alternatively, two speakers can be used, with one speaker at the end of each earpiece. The frequency response of the speaker is similar to that of a bass speaker because of the low-frequency sound production needed. Depending on the implementation, one or two speaker amplifiers are used.
A stethoscope must be most sensitive to cardiac sound in the 20Hz to 400Hz range and to pulmonary sound in the 100Hz to 1200Hz range. Note that the frequency ranges vary by manufacturer, and the DSP algorithms filter out sound beyond these optimal ranges.
Data Storage and Transfer
Once the captured sound is converted to an analog voltage, it can be sent out through an audio jack and played back on either a computer or through the digital stethoscope. The captured sound can also be manipulated digitally. It can be stored in the stethoscope using internal or removable nonvolatile (NV) memory like EEPROM or flash, and then played back through the stethoscope's speakers; or it can be transferred to a computer for further analysis. Adding a real-time clock (RTC) facilitates tagging the recording with time and date. The sound is commonly transferred with a wired interface, such as USB, or with a wireless interface like Bluetooth® or another proprietary wireless interface.Display and Backlighting
Some digital stethoscopes have a small, simple display due to the limited space available; others have only buttons and LED indicators. Backlighting for the display is required because the ambient lighting during the procedure is often at a low level. The small display requires just one or two white light-emitting diodes (WLEDs) controlled by an LED driver or an electroluminescent (EL) panel controlled by an EL driver. Most of the user-interface buttons can be eliminated by adding a touch-screen display and controller.Power Management
Most digital stethoscopes use either one or two AAA 1.5V primary batteries. This design requires a step-up, or boost, switching regulator to increase the voltage to 3.0V or 5.0V, depending on the circuitry utilized.If a single 1.5V battery is installed, the switching regulator will probably be on all the time, making low quiescent current a critical factor for long battery life. The longer the battery life, the more convenient the digital stethoscope is to use and the closer the experience will be to an acoustic stethoscope.
When using two 1.5V batteries in series, the switching regulator can be left on all the time or shut down when not in use. If the circuit operates from 3.6V down to 1.8V, then a switching regulator may not be needed. Cost will be reduced and space saved. A low-battery warning is required so that a patient's examination need not be interrupted to replace the battery.
Battery Management
Rechargeable batteries can be used; the best choice is a single-cell Li+ battery. If a rechargeable battery is used, a battery charger is required either in the digital stethoscope or in a charging cradle. A fuel gauge is the best solution to accurately determine the remaining battery life. If the battery is removable, then authentication is also required for safety and aftermarket management .Pulse
In medicine, a pulse represents the tactile arterial palpation of the heartbeat by trained fingertips. The pulse may be palpated in any place that allows an artery to be compressed near the surface of the body, such as at the neck (carotid artery), wrist (radial artery), at the groin (femoral artery), behind the knee (popliteal artery), near the ankle joint (posterior tibial artery), and on foot (dorsalis pedis artery). Pulse (or the count of arterial pulse per minute) is equivalent to measuring the heart rate. The heart rate can also be measured by listening to the heart beat by auscultation, traditionally using a stethoscope and counting it for a minute. The radial pulse is commonly measured using three fingers. This has a reason: the finger closest to the heart is used to occlude the pulse pressure, the middle finger is used get a crude estimate of the blood pressure, and the finger most distal to the heart (usually the ring finger) is used to nullify the effect of the ulnar pulse as the two arteries are connected via the palmar arches (superficial and deep). The study of the pulse is known as sphygmology .
_(14742233966).jpg)
Diagram of the rise and lower of blood pressure from a pulse.
Physiology
Claudius Galen was perhaps the first physiologist to describe the pulse. The pulse is an expedient tactile method of determination of systolic blood pressure to a trained observer. Diastolic blood pressure is non-palpable and unobservable by tactile methods, occurring between heartbeats.
Pressure waves generated by the heart in systole move the arterial walls. Forward movement of blood occurs when the boundaries are pliable and compliant. These properties form enough to create a palpable pressure wave.
The heart rate may be greater or lesser than the pulse rate depending upon physiologic demand. In this case, the heart rate is determined by auscultation or audible sounds at the heart apex, in which case it is not the pulse. The pulse deficit (difference between heart beats and pulsations at the periphery) is determined by simultaneous palpation at the radial artery and auscultation at the PMI, near the heart apex. It may be present in case of premature beats or atrial fibrillation.
Pulse velocity, pulse deficits and much more physiologic data are readily and simplistically visualized by the use of one or more arterial catheters connected to a transducer and oscilloscope. This invasive technique has been commonly used in intensive care since the 1970s.
The rate of the pulse is observed and measured by tactile or visual means on the outside of an artery and is recorded as beats per minute or BPM.
The pulse may be further indirectly observed under light absorbances of varying wavelengths with assigned and inexpensively reproduced mathematical ratios. Applied capture of variances of light signal from the blood component hemoglobin under oxygenated vs. deoxygenated conditions allows the technology of pulse oximetry.

Recommended points to evaluate pulse
Characteristics of pulse
Rate
Normal pulse rates at rest, in beats per minute (BPM):
 | |
Problems playing this file? See media help. | |
| newborn (0–3 months old) | infants (3 – 6 months) | infants (6 – 12 months) | children (1 – 10 years) | children over 10 years & adults, including seniors | well-trained adult athletes |
|---|---|---|---|---|---|
| 99-149 | 89–119 | 79-119 | 69–129 | 59–99 | 39–59 |
The pulse rate can be used to check overall heart health and fitness level. Generally lower is better, but bradycardias can be dangerous. Symptoms of a dangerously slow heartbeat include weakness, loss of energy and fainting.
Rhythm
A normal pulse is regular in rhythm and force. An irregular pulse may be due to sinus arrhythmia, ectopic beats, atrial fibrillation, paroxysmal atrial tachycardia, atrial flutter, partial heart block etc. Intermittent dropping out of beats at pulse is called "intermittent pulse". Examples of regular intermittent (regularly irregular) pulse include pulsus bigeminus, second-degree atrioventricular block. An example of irregular intermittent (irregularly irregular) pulse is atrial fibrillation.
Volume
The degree of expansion displayed by artery during diastolic and systolic state is called volume. It is also known as amplitude, expansion or size of pulse.
Hypokinetic pulse
A weak pulse signifies narrow pulse pressure. It may be due to low cardiac output (as seen in shock, congestive cardiac failure), hypovolemia, valvular heart disease (such as aortic outflow tract obstruction, mitral stenosis, aortic arch syndrome) etc.
Hyperkinetic pulse
A bounding pulse signifies high pulse pressure. It may be due to low peripheral resistance (as seen in fever, anemia, thyrotoxicosis, hyperkinetic heart syndrome, A-V fistula, Paget's disease, beriberi, liver cirrhosis), increased cardiac output, increased stroke volume (as seen in anxiety, exercise, complete heart block, aortic regurgitation), decreased distensibility of arterial system (as seen in atherosclerosis, hypertension and coarctation of aorta).
- 0 = Absent
- 1 = Barely palpable
- 2 = Easily palpable
- 3 = Full
- 4 = Aneurysmal or bounding pulse
Force
Also known as compressibility of pulse. It is a rough measure of systolic blood pressure.
Tension
It corresponds to diastolic blood pressure. A low tension pulse (pulsus mollis), the vessel is soft or impalpable between beats. In high tension pulse (pulsus durus), vessels feel rigid even between pulse beats.
Form
A form or contour of a pulse is palpatiory estimation of arteriogram. A quickly rising and quickly falling pulse (pulsus celer) is seen in aortic regurgitation. A slow rising and slowly falling pulse (pulsus tardus) is seen in aortic stenosis.
Equality
Comparing pulses and different places gives valuable clinical information.
A discrepant or unequal pulse between left and right radial artery is observed in anomalous or aberrant course of artery, coarctation of aorta, aortitis, dissecting aneurysm, peripheral embolism etc. An unequal pulse between upper and lower extremities is seen in coarctation to aorta, aortitis, block at bifurcation of aorta, dissection of aorta, iatrogenic trauma and arteriosclerotic obstruction.
Condition of arterial wall
A normal artery is not palpable after flattening by digital pressure. A thick radial artery which is palpable 7.5–10 cm up the forearm is suggestive of arteriosclerosis.
Radio-femoral delay
In coarctation of aorta, femoral pulse may be significantly delayed as compared to radial pulse (unless there is coexisting aortic regurgitation). The delay can also be observed in supravalvar aortic stenosis.
Patterns
Several pulse patterns can be of clinically significance. These include:
- A dicrotic pulse is characterized by a percussion wave in systole and a prominent dicrotic wave in diastole. Physiologically, the dicrotic wave is the result of reflected waves from the lower extremities and aorta. Conditions associated with low cardiac output and high systemic vascular resistance can produce a dicrotic pulse.
- Pulsus alternans: an ominous medical sign that indicates progressive systolic heart failure. To trained fingertips, the examiner notes a pattern of a strong pulse followed by a weak pulse over and over again. This pulse signals a flagging effort of the heart to sustain itself in systole.
- Pulsus bigeminus: indicates a pair of hoofbeats within each heartbeat. Concurrent auscultation of the heart may reveal a gallop rhythm of the native heartbeat.
- Pulsus bisferiens: an unusual physical finding typically seen in patients with aortic valve diseases. If the aortic valve does not normally open and close, trained fingertips will observe two pulses to each heartbeat instead of one.
- Pulsus tardus et parvus, also pulsus parvus et tardus, slow-rising pulse and anacrotic pulse, is weak (parvus), and late (tardus) relative to its expected characteristics. It is caused by a stiffened aortic valve that makes it progressively harder to open, thus requiring increased generation of blood pressure in the left ventricle. It is seen in aortic valve stenosis.
- Pulsus paradoxus: a condition in which some heartbeats cannot be detected at the radial artery during the inspiration phase of respiration. It is caused by an exaggerated decrease in blood pressure during this phase, and is diagnostic of a variety of cardiac and respiratory conditions of varying urgency.
- Tachycardia: an elevated resting heart rate. In general an electrocardiogram (ECG) is required to identify the type of tachycardia.
- Pulsatile This description of the pulse implies the intrinsic physiology of systole and diastole. Scientifically, systole and diastole are forces that expand and contract the pulmonary and systemic circulations.
- A collapsing pulse is a sign of hyperdynamic circulation.
Common palpable sites
Upper limb

- Axillary pulse: located inferiorly of the lateral wall of the axilla
- Brachial pulse: located on the inside of the upper arm near the elbow, frequently used in place of carotid pulse in infants (brachial artery)
- Radial pulse: located on the lateral of the wrist (radial artery). It can also be found in the anatomical snuff box.
- Ulnar pulse: located on the medial of the wrist (ulnar artery).
Chinese medicine has focused on the pulse in the upper limbs for several centuries. The concept of pulse diagnosis is essentially based on palpation and observations of the radial and ulnar volar pulses at the readily accessible wrist.
Lower limb
- Femoral pulse: located in the inner thigh, at the mid-inguinal point, halfway between the pubic symphysis and anterior superior iliac spine (femoral artery).
- Popliteal pulse: Above the knee in the popliteal fossa, found by holding the bent knee. The patient bends the knee at approximately 124°, and the physician holds it in both hands to find the popliteal artery in the pit behind the knee (Popliteal artery).
- Dorsalis pedis pulse: located on top of the foot, immediately lateral to the extensor of hallucis longus (dorsalis pedis artery).
- Tibialis posterior pulse: located on the medial side of the ankle, 2 cm inferior and 2 cm posterior to the medial malleolus (posterior tibial artery). It is easily palpable over Pimenta's Point.
Head and neck

- Carotid pulse: located in the neck (carotid artery). The carotid artery should be palpated gently and while the patient is sitting or lying down. Stimulating its baroreceptors with low palpitation can provoke severe bradycardia or even stop the heart in some sensitive persons. Also, a person's two carotid arteries should not be palpated at the same time. Doing so may limit the flow of blood to the head, possibly leading to fainting or brain ischemia. It can be felt between the anterior border of the sternocleidomastoid muscle, above the hyoid bone and lateral to the thyroid cartilage.
- Facial pulse: located on the mandible (lower jawbone) on a line with the corners of the mouth (facial artery).
- Temporal pulse: located on the temple directly in front of the ear (superficial temporal artery).
Although the pulse can be felt in multiple places in the head, people should not normally hear their heartbeats within the head. This is called pulsatile tinnitus, and it can indicate several medical disorders.
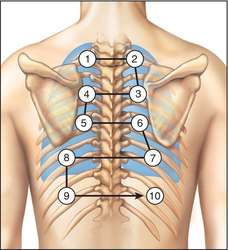
Torso
- Apical pulse: located in the 5th left intercostal space, 1.25 cm lateral to the mid-clavicular line. In contrast with other pulse sites, the apical pulse site is unilateral, and measured not under an artery, but below the heart itself (more specifically, the apex of the heart).
Flash Back
The first person to accurately measure the pulse rate was Santorio Santorii who invented the pulsilogium, a form of pendulum, based on the work by Galileo Galilei. A century later another physician, de Lacroix, used the pulsilogium to test cardiac function.
Heart rate is the speed of the heartbeat measured by the number of contractions (beats) of the heart per minute (bpm). The heart rate can vary according to the body's physical needs, including the need to absorb oxygen and excrete carbon dioxide. It is usually equal or close to the pulse measured at any peripheral point. Activities that can provoke change include physical exercise, sleep, anxiety, stress, illness, and ingestion of drugs.
The American Heart Association states the normal resting adult human heart rate is 60–100 bpm.[1] Tachycardia is a fast heart rate, defined as above 100 bpm at rest.[2] Bradycardia is a slow heart rate, defined as below 60 bpm at rest. During sleep a slow heartbeat with rates around 40–50 bpm is common and is considered normal. When the heart is not beating in a regular pattern, this is referred to as an arrhythmia. Abnormalities of heart rate sometimes indicate disease
Physiology

| |
Problems playing this file? See media help. | |
While heart rhythm is regulated entirely by the sinoatrial node under normal conditions, heart rate is regulated by sympathetic and parasympathetic input to the sinoatrial node. The accelerans nerve provides sympathetic input to the heart by releasing norepinephrine onto the cells of the sinoatrial node (SA node), and the vagus nerve provides parasympathetic input to the heart by releasing acetylcholine onto sinoatrial node cells. Therefore, stimulation of the accelerans nerve increases heart rate, while stimulation of the vagus nerve decreases it.
Due to individuals having a constant blood volume, one of the physiological ways to deliver more oxygen to an organ is to increase heart rate to permit blood to pass by the organ more often.[3] Normal resting heart rates range from 60-100 bpm. Bradycardia is defined as a resting heart rate below 60 bpm. However, heart rates from 50 to 60 bpm are common among healthy people and do not necessarily require special attention.[1] Tachycardia is defined as a resting heart rate above 100 bpm, though persistent rest rates between 80–100 bpm, mainly if they are present during sleep, may be signs of hyperthyroidism or anemia (see below).
- Central nervous system stimulants such as substituted amphetamines increase heart rate.
- Central nervous system depressants or sedatives decrease the heart rate (apart from some particularly strange ones with equally strange effects, such as ketamine which can cause – amongst many other things – stimulant-like effects such as tachycardia).
There are many ways in which the heart rate speeds up or slows down. Most involve stimulant-like endorphins and hormones being released in the brain, many of which are those that are 'forced'/'enticed' out by the ingestion and processing of drugs.
This section discusses target heart rates for healthy persons and are inappropriately high for most persons with coronary artery disease.
Influences from the central nervous system
Cardiovascular centres
The heart rate is rhythmically generated by the sinoatrial node. It is also influenced by central factors through sympathetic and parasympathetic nerves.[10] Nervous influence over the heartrate is centralized within the two paired cardiovascular centres of the medulla oblongata. The cardioaccelerator regions stimulate activity via sympathetic stimulation of the cardioaccelerator nerves, and the cardioinhibitory centers decrease heart activity via parasympathetic stimulation as one component of the vagus nerve. During rest, both centers provide slight stimulation to the heart, contributing to autonomic tone. This is a similar concept to tone in skeletal muscles. Normally, vagal stimulation predominates as, left unregulated, the SA node would initiate a sinus rhythm of approximately 100 bpm.[11]
Both sympathetic and parasympathetic stimuli flow through the paired cardiac plexus near the base of the heart. The cardioaccelerator center also sends additional fibers, forming the cardiac nerves via sympathetic ganglia (the cervical ganglia plus superior thoracic ganglia T1–T4) to both the SA and AV nodes, plus additional fibers to the atria and ventricles. The ventricles are more richly innervated by sympathetic fibers than parasympathetic fibers. Sympathetic stimulation causes the release of the neurotransmitter norepinephrine (also known as noradrenaline) at the neuromuscular junction of the cardiac nerves. This shortens the repolarization period, thus speeding the rate of depolarization and contraction, which results in an increased heartrate. It opens chemical or ligand-gated sodium and calcium ion channels, allowing an influx of positively charged ions.[11]
Norepinephrine binds to the beta–1 receptor. High blood pressure medications are used to block these receptors and so reduce the heart rate.[11]

Parasympathetic stimulation originates from the cardioinhibitory region with impulses traveling via the vagus nerve (cranial nerve X). The vagus nerve sends branches to both the SA and AV nodes, and to portions of both the atria and ventricles. Parasympathetic stimulation releases the neurotransmitter acetylcholine (ACh) at the neuromuscular junction. ACh slows HR by opening chemical- or ligand-gated potassium ion channels to slow the rate of spontaneous depolarization, which extends repolarization and increases the time before the next spontaneous depolarization occurs. Without any nervous stimulation, the SA node would establish a sinus rhythm of approximately 100 bpm. Since resting rates are considerably less than this, it becomes evident that parasympathetic stimulation normally slows HR. This is similar to an individual driving a car with one foot on the brake pedal. To speed up, one need merely remove one’s foot from the brake and let the engine increase speed. In the case of the heart, decreasing parasympathetic stimulation decreases the release of ACh, which allows HR to increase up to approximately 100 bpm. Any increases beyond this rate would require sympathetic stimulation.

Input to the cardiovascular centres
The cardiovascular centres receive input from a series of visceral receptors with impulses traveling through visceral sensory fibers within the vagus and sympathetic nerves via the cardiac plexus. Among these receptors are various proprioreceptors, baroreceptors, and chemoreceptors, plus stimuli from the limbic system which normally enable the precise regulation of heart function, via cardiac reflexes. Increased physical activity results in increased rates of firing by various proprioreceptors located in muscles, joint capsules, and tendons. The cardiovascular centres monitor these increased rates of firing, suppressing parasympathetic stimulation or increasing sympathetic stimulation as needed in order to increase blood flow.[11]
Similarly, baroreceptors are stretch receptors located in the aortic sinus, carotid bodies, the venae cavae, and other locations, including pulmonary vessels and the right side of the heart itself. Rates of firing from the baroreceptors represent blood pressure, level of physical activity, and the relative distribution of blood. The cardiac centers monitor baroreceptor firing to maintain cardiac homeostasis, a mechanism called the baroreceptor reflex. With increased pressure and stretch, the rate of baroreceptor firing increases, and the cardiac centers decrease sympathetic stimulation and increase parasympathetic stimulation. As pressure and stretch decrease, the rate of baroreceptor firing decreases, and the cardiac centers increase sympathetic stimulation and decrease parasympathetic stimulation.[11]
There is a similar reflex, called the atrial reflex or Bainbridge reflex, associated with varying rates of blood flow to the atria. Increased venous return stretches the walls of the atria where specialized baroreceptors are located. However, as the atrial baroreceptors increase their rate of firing and as they stretch due to the increased blood pressure, the cardiac center responds by increasing sympathetic stimulation and inhibiting parasympathetic stimulation to increase HR. The opposite is also true.[11]
Increased metabolic byproducts associated with increased activity, such as carbon dioxide, hydrogen ions, and lactic acid, plus falling oxygen levels, are detected by a suite of chemoreceptors innervated by the glossopharyngeal and vagus nerves. These chemoreceptors provide feedback to the cardiovascular centers about the need for increased or decreased blood flow, based on the relative levels of these substances.[11]
The limbic system can also significantly impact HR related to emotional state. During periods of stress, it is not unusual to identify higher than normal HRs, often accompanied by a surge in the stress hormone cortisol. Individuals experiencing extreme anxiety may manifest panic attacks with symptoms that resemble those of heart attacks. These events are typically transient and treatable. Meditation techniques have been developed to ease anxiety and have been shown to lower HR effectively. Doing simple deep and slow breathing exercises with one’s eyes closed can also significantly reduce this anxiety and HR.[11]
Factors influencing heart rate
| ||||||||||||||||||||||||||
|
Using a combination of autorhythmicity and innervation, the cardiovascular center is able to provide relatively precise control over the heart rate, but other factors can impact on this. These include hormones, notably epinephrine, norepinephrine, and thyroid hormones; levels of various ions including calcium, potassium, and sodium; body temperature; hypoxia; and pH balance.
Epinephrine and norepinephrine
The catecholamines, epinephrine and norepinephrine, secreted by the adrenal medulla form one component of the extended fight-or-flight mechanism. The other component is sympathetic stimulation. Epinephrine and norepinephrine have similar effects: binding to the beta-1 adrenergic receptors, and opening sodium and calcium ion chemical- or ligand-gated channels. The rate of depolarization is increased by this additional influx of positively charged ions, so the threshold is reached more quickly and the period of repolarization is shortened. However, massive releases of these hormones coupled with sympathetic stimulation may actually lead to arrhythmias. There is no parasympathetic stimulation to the adrenal medulla.
Thyroid hormones
In general, increased levels of the thyroid hormones (thyroxine(T4) and triiodothyronine (T3)), increase the heart rate; excessive levels can trigger tachycardia. The impact of thyroid hormones is typically of a much longer duration than that of the catecholamines. The physiologically active form of triiodothyronine, has been shown to directly enter cardiomyocytes and alter activity at the level of the genome. It also impacts the beta adrenergic response similar to epinephrine and norepinephrine.
Calcium
Calcium ion levels have a great impact on heart rate and contractility: increased calcium levels cause an increase in both. High levels of calcium ions result in hypercalcemia and excessive levels can induce cardiac arrest. Drugs known as calcium channel blockers slow HR by binding to these channels and blocking or slowing the inward movement of calcium ions.
Caffeine and nicotine
Caffeine and nicotine are both stimulants of the nervous system and of the cardiac centres causing an increased heart rate. Caffeine works by increasing the rates of depolarization at the SA node, whereas nicotine stimulates the activity of the sympathetic neurons that deliver impulses to the heart.[11] Both stimulants are legal and unregulated, and are known to be very addictive.[11]
Effects of stress
Both surprise and stress induce physiological response: elevate heart rate substantially.[12] In a study conducted on 8 female and male student actors ages 18 to 25, their reaction to an unforeseen occurrence (the cause of stress) during a performance was observed in terms of heart rate. In the data collected, there was a noticeable trend between the location of actors (onstage and offstage) and their elevation in heart rate in response to stress; the actors present offstage reacted to the stressor immediately, demonstrated by their immediate elevation in heart the minute the unexpected event occurred, but the actors present onstage at the time of the stressor reacted in the following 5 minute period (demonstrated by their increasingly elevated heart rate). This trend regarding stress and heart rate is supported by previous studies; negative emotion/stimulus has a prolonged effect on heart rate in individuals who are directly impacted.[13] In regard to the characters present onstage, a reduced startle response has been associated with a passive defense, and the diminished initial heart rate response has been predicted to have a greater tendency to dissociation.[14] Further, note that heart rate is an accurate measure of stress and the startle response which can be easily observed to determine the effects of certain stressors.
Factors decreasing heart rate
The heart rate can be slowed by altered sodium and potassium levels, hypoxia, acidosis, alkalosis, and hypothermia. The relationship between electrolytes and HR is complex, but maintaining electrolyte balance is critical to the normal wave of depolarization. Of the two ions, potassium has the greater clinical significance. Initially, both hyponatremia (low sodium levels) and hypernatremia (high sodium levels) may lead to tachycardia. Severely high hypernatremia may lead to fibrillation, which may cause CO to cease. Severe hyponatremia leads to both bradycardia and other arrhythmias. Hypokalemia (low potassium levels) also leads to arrhythmias, whereas hyperkalemia (high potassium levels) causes the heart to become weak and flaccid, and ultimately to fail.[11]
Heart muscle relies exclusively on aerobic metabolism for energy. Hypoxia (an insufficient supply of oxygen) leads to decreasing HRs, since metabolic reactions fueling heart contraction are restricted.[11]
Acidosis is a condition in which excess hydrogen ions are present, and the patient’s blood expresses a low pH value. Alkalosis is a condition in which there are too few hydrogen ions, and the patient’s blood has an elevated pH. Normal blood pH falls in the range of 7.35–7.45, so a number lower than this range represents acidosis and a higher number represents alkalosis. Enzymes, being the regulators or catalysts of virtually all biochemical reactions - are sensitive to pH and will change shape slightly with values outside their normal range. These variations in pH and accompanying slight physical changes to the active site on the enzyme decrease the rate of formation of the enzyme-substrate complex, subsequently decreasing the rate of many enzymatic reactions, which can have complex effects on HR. Severe changes in pH will lead to denaturation of the enzyme.[11]
The last variable is body temperature. Elevated body temperature is called hyperthermia, and suppressed body temperature is called hypothermia. Slight hyperthermia results in increasing HR and strength of contraction. Hypothermia slows the rate and strength of heart contractions. This distinct slowing of the heart is one component of the larger diving reflex that diverts blood to essential organs while submerged. If sufficiently chilled, the heart will stop beating, a technique that may be employed during open heart surgery. In this case, the patient’s blood is normally diverted to an artificial heart-lung machine to maintain the body’s blood supply and gas exchange until the surgery is complete, and sinus rhythm can be restored. Excessive hyperthermia and hypothermia will both result in death, as enzymes drive the body systems to cease normal function, beginning with the central nervous system.[11]
In different circumstances

Heart rate is not a stable value and it increases or decreases in response to the body's need in a way to maintain an equilibrium (basal metabolic rate) between requirement and delivery of oxygen and nutrients. The normal SA node firing rate is affected by autonomic nervous system activity: sympathetic stimulation increases and parasympathetic stimulation decreases the firing rate.[15] A number of different metrics are used to describe heart rate.
Resting heart rate
The basal or resting heart rate (HRrest) is defined as the heart rate when a person is awake, in a neutrally temperate environment, and has not been subject to any recent exertion or stimulation, such as stress or surprise. A large body of evidence indicates that the normal range is 60-100 beats per minute This resting heart rate is often correlated with mortality. For example, all-cause mortality is increased by 1.22 (hazard ratio) when heart rate exceeds 90 beats per minute.[5] The mortality rate of patients with myocardial infarction increased from 15% to 41% if their admission heart rate was greater than 90 beats per minute.[6] ECG of 46,129 individuals with low risk for cardiovascular disease revealed that 96% had resting heart rates ranging from 48-98 beats per minute.[7] Finally, expert consensus reveals that 98% of cardiologists believe that the "60 to 100" range is too high, with a vast majority of them agreeing that 50 to 90 beats per minute is more appropriate.[8] The normal resting heart rate is based on the at-rest firing rate of the heart's sinoatrial node, where the faster pacemaker cells driving the self-generated rhythmic firing and responsible for the heart's autorhythmicity are located.[16] For endurance athletes at the elite level, it is not unusual to have a resting heart rate between 33 and 50 bpm.
Maximum heart rate
The maximum heart rate (HRmax) is the highest heart rate an individual can achieve without severe problems through exercise stress, and generally decreases with age. Since HRmax varies by individual, the most accurate way of measuring any single person's HRmax is via a cardiac stress test. In this test, a person is subjected to controlled physiologic stress (generally by treadmill) while being monitored by an ECG. The intensity of exercise is periodically increased until certain changes in heart function are detected on the ECG monitor, at which point the subject is directed to stop. Typical duration of the test ranges ten to twenty minutes.
Adults who are beginning a new exercise regimen are often advised to perform this test only in the presence of medical staff due to risks associated with high heart rates. For general purposes, a formula is often employed to estimate a person's maximum heart rate. However, these predictive formulas have been criticized as inaccurate because they generalized population-averages and usually focus on a person's age. It is well-established that there is a "poor relationship between maximal heart rate and age" and large standard deviations relative to predicted heart rates.[19] (see Limitations of Estimation Formulas).

A number of formulas are used to estimate HRmax
Nes, et al.
Based on measurements of 3320 healthy men and women aged between 19 and 89, and including the potential modifying effect of gender, body composition, and physical activity, Nes et al found
- HRmax = 211 − (0.64 × age)
This relationship was found to hold substantially regardless of gender, physical activity status, maximal oxygen uptake, smoking, or body mass index. However, a standard error of the estimate of 10.8 beats/min must be accounted for when applying the formula to clinical settings, and the researchers concluded that actual measurement via a maximal test may be preferable whenever possible.[20]
Tanaka, Monahan, & Seals
From Tanaka, Monahan, & Seals (2001):
- HRmax = 208 − (0.7 × age) [21]
Their meta-analysis (of 351 prior studies involving 492 groups and 18,712 subjects) and laboratory study (of 514 healthy subjects) concluded that, using this equation, HRmax was very strongly correlated to age (r = −0.90). The regression equation that was obtained in the laboratory-based study (209 − 0.7 x age), was virtually identical to that of the meta-study. The results showed HRmax to be independent of gender and independent of wide variations in habitual physical activity levels. This study found a standard deviation of ~10 beats per minute for individuals of any age, meaning the HRmax formula given has an accuracy of ±20 beats per minute.
In 2007, researchers at the Oakland University analyzed maximum heart rates of 132 individuals recorded yearly over 25 years, and produced a linear equation very similar to the Tanaka formula, HRmax = 206.9 − (0.67 × age), and a nonlinear equation, HRmax = 191.5 − (0.007 × age2). The linear equation had a confidence interval of ±5–8 bpm and the nonlinear equation had a tighter range of ±2–5 bpm. Also a third nonlinear equation was produced: HRmax = 163 + (1.16 × age) − (0.018 × age2)
Haskell & Fox

Notwithstanding the research of Tanaka, Monahan, & Seals, the most widely cited formula for HRmax (which contains no reference to any standard deviation) is still:
- HRmax = 220 − age
Although attributed to various sources, it is widely thought to have been devised in 1970 by Dr. William Haskell and Dr. Samuel Fox.[23] Inquiry into the history of this formula reveals that it was not developed from original research, but resulted from observation based on data from approximately 11 references consisting of published research or unpublished scientific compilations.[24] It gained widespread use through being used by Polar Electro in its heart rate monitors,[23] which Dr. Haskell has "laughed about",[23] as the formula "was never supposed to be an absolute guide to rule people's training."[23]
While it is the most common (and easy to remember and calculate), this particular formula is not considered by reputable health and fitness professionals to be a good predictor of HRmax. Despite the widespread publication of this formula, research spanning two decades reveals its large inherent error, Sxy = 7–11 bpm. Consequently, the estimation calculated by HRmax = 220 − age has neither the accuracy nor the scientific merit for use in exercise physiology and related fields.[24]
Robergs & Landwehr
A 2002 study[24] of 43 different formulas for HRmax (including that of Haskell and Fox – see above) published in the Journal of Exercise Psychology concluded that:
- no "acceptable" formula currently existed (they used the term "acceptable" to mean acceptable for both prediction of VO2, and prescription of exercise training HR ranges)
- the least objectionable formula was:
-
- HRmax = 205.8 − (0.685 × age)
- This had a standard deviation that, although large (6.4 bpm), was considered acceptable for prescribing exercise training HR ranges.
Gulati (for women)
Research conducted at Northwestern University by Martha Gulati, et al., in 2010[25] suggested a maximum heart rate formula for women:
- HRmax = 206 − (0.88 × age)
Gellish[edit]
A 2008 study from Lund, Sweden gives reference values (obtained during bicycle ergometry) for men:
- HRmax = 203.7 / ( 1 + exp( 0.033 × (age − 104.3) ) ) [26]
and for women:
- HRmax = 190.2 / ( 1 + exp( 0.0453 × (age − 107.5) ) ) [27]
Other formulae[edit]
- HRmax = 206.3 − (0.711 × age)
-
- (Often attributed to "Londeree and Moeschberger from the University of Missouri")
- HRmax = 217 − (0.85 × age)
-
- (Often attributed to "Miller et al. from Indiana University")
Limitations
Maximum heart rates vary significantly between individuals.[23] Even within a single elite sports team, such as Olympic rowers in their 20s, maximum heart rates have been reported as varying from 160 to 220.[23] Such a variation would equate to a 60 or 90 year age gap in the linear equations above, and would seem to indicate the extreme variation about these average figures.
Figures are generally considered averages, and depend greatly on individual physiology and fitness. For example, an endurance runner's rates will typically be lower due to the increased size of the heart required to support the exercise, while a sprinter's rates will be higher due to the improved response time and short duration. While each may have predicted heart rates of 180 (= 220 − age), these two people could have actual HRmax 20 beats apart (e.g., 170–190).
Further, note that individuals of the same age, the same training, in the same sport, on the same team, can have actual HRmax 60 bpm apart (160–220):[23] the range is extremely broad, and some say "The heart rate is probably the least important variable in comparing athletes."[23]
Heart rate reserve
Heart rate reserve (HRreserve) is the difference between a person's measured or predicted maximum heart rate and resting heart rate. Some methods of measurement of exercise intensity measure percentage of heart rate reserve. Additionally, as a person increases their cardiovascular fitness, their HRrest will drop, and the heart rate reserve will increase. Percentage of HRreserve is equivalent to percentage of VO2 reserve.[28]
- HRreserve = HRmax − HRrest
This is often used to gauge exercise intensity (first used in 1957 by Karvonen).[29]
Karvonen's study findings have been questioned, due to the following:
- The study did not use VO2 data to develop the equation.
- Only six subjects were used, and the correlation between the percentages of HRreserve and VO2 max was not statistically significant.[30]
Target heart rate
For healthy people, the Target Heart Rate or Training Heart Rate (THR) is a desired range of heart rate reached during aerobic exercise which enables one's heart and lungs to receive the most benefit from a workout. This theoretical range varies based mostly on age; however, a person's physical condition, sex, and previous training also are used in the calculation. Below are two ways to calculate one's THR. In each of these methods, there is an element called "intensity" which is expressed as a percentage. The THR can be calculated as a range of 65–85% intensity. However, it is crucial to derive an accurate HRmax to ensure these calculations are meaningful.
Example for someone with a HRmax of 180 (age 40, estimating HRmax As 220 − age):
- 65% Intensity: (220 − (age = 40)) × 0.65 → 117 bpm
- 85% Intensity: (220 − (age = 40)) × 0.85 → 154bpm
Karvonen method
The Karvonen method factors in resting heart rate (HRrest) to calculate target heart rate (THR), using a range of 50–85% intensity:[31]
- THR = ((HRmax − HRrest) × % intensity) + HRrest
Equivalently,
- THR = (HRreserve × % intensity) + HRrest
Example for someone with a HRmax of 180 and a HRrest of 70 (and therefore a HRreserve of 110):
- 50% Intensity: ((180 − 70) × 0.50) + 70 = 125 bpm
- 85% Intensity: ((180 − 70) × 0.85) + 70 = 163 bpm
Zoladz method
An alternative to the Karvonen method is the Zoladz method, which derives exercise zones by subtracting values from HRmax:
- THR = HRmax − Adjuster ± 5 bpm
- Zone 1 Adjuster = 50 bpm
- Zone 2 Adjuster = 40 bpm
- Zone 3 Adjuster = 30 bpm
- Zone 4 Adjuster = 20 bpm
- Zone 5 Adjuster = 10 bpm
Example for someone with a HRmax of 180:
- Zone 1(easy exercise): 180 − 50 ± 5 → 125 − 135 bpm
- Zone 4(tough exercise): 180 − 20 ± 5 → 155 − 165 bpm
Heart rate recovery
Heart rate recovery (HRrecovery) is the reduction in heart rate at peak exercise and the rate as measured after a cool-down period of fixed duration.[32] A greater reduction in heart rate after exercise during the reference period is associated with a higher level of cardiac fitness.[33]
Heart rates that do not drop by more than 12 bpm one minute after stopping exercise are associated with an increased risk of death.[32] Investigators of the Lipid Research Clinics Prevalence Study, which included 5,000 subjects, found that patients with an abnormal HRrecovery (defined as a decrease of 42 beats per minutes or less at two minutes post-exercise) had a mortality rate 2.5 times greater than patients with a normal recovery.[33] Another study by Nishime et al. and featuring 9,454 patients followed for a median period of 5.2 years found a four-fold increase in mortality in subjects with an abnormal HRrecovery (≤12 bpm reduction one minute after the cessation of exercise).[33] Shetler et al. studied 2,193 patients for thirteen years and found that a HRrecovery of ≤22 bpm after two minutes "best identified high-risk patients".[33] They also found that while HRrecovery had significant prognostic value it had no diagnostic value.[33]
Development

The human heart beats more than 3.5 billion times in an average lifetime.
The heartbeat of a human embryo begins at approximately 21 days after conception, or five weeks after the last normal menstrual period (LMP), which is the date normally used to date pregnancy in the medical community. The electrical depolarizations that trigger cardiac myocytes to contract arise spontaneously within the myocyte itself. The heartbeat is initiated in the pacemaker regions and spreads to the rest of the heart through a conduction pathway. Pacemaker cells develop in the primitive atrium and the sinus venosus to form the sinoatrial node and the atrioventricular node respectively. Conductive cells develop the bundle of His and carry the depolarization into the lower heart.
The human heart begins beating at a rate near the mother’s, about 75–80 beats per minute (bpm). The embryonic heart rate then accelerates linearly for the first month of beating, peaking at 165–185 bpm during the early 7th week, (early 9th week after the LMP). This acceleration is approximately 3.3 bpm per day, or about 10 bpm every three days, an increase of 100 bpm in the first month.[34]
After peaking at about 9.2 weeks after the LMP, it decelerates to about 150 bpm (+/-25 bpm) during the 15th week after the LMP. After the 15th week the deceleration slows reaching an average rate of about 145 (+/-25 bpm) bpm at term. The regression formula which describes this acceleration before the embryo reaches 25 mm in crown-rump length or 9.2 LMP weeks is:

There is no difference in male and female heart rates before birth.
Clinical significance
Measurement

Manual measurement

Heart rate is measured by finding the pulse of the heart. This pulse rate can be found at any point on the body where the artery's pulsation is transmitted to the surface by pressuring it with the index and middle fingers; often it is compressed against an underlying structure like bone. (A good area is on the neck, under the corner of the jaw.) The thumb should not be used for measuring another person's heart rate, as its strong pulse may interfere with the correct perception of the target pulse.
The radial artery is the easiest to use to check the heart rate. However, in emergency situations the most reliable arteries to measure heart rate are carotid arteries. This is important mainly in patients with atrial fibrillation, in whom heart beats are irregular and stroke volume is largely different from one beat to another. In those beats following a shorter diastolic interval left ventricle doesn't fill properly, stroke volume is lower and pulse wave is not strong enough to be detected by palpation on a distal artery like the radial artery. It can be detected, however, by doppler.[36][37]
Possible points for measuring the heart rate are:
- The ventral aspect of the wrist on the side of the thumb (radial artery).
- The ulnar artery.
- The neck (carotid artery).
- The inside of the elbow, or under the biceps muscle (brachial artery).
- The groin (femoral artery).
- Behind the medial malleolus on the feet (posterior tibial artery).
- Middle of dorsum of the foot (dorsalis pedis).
- Behind the knee (popliteal artery).
- Over the abdomen (abdominal aorta).
- The chest (apex of the heart), which can be felt with one's hand or fingers. It is also possible to auscultate the heart using a stethoscope.
- The temple (superficial temporal artery).
- The lateral edge of the mandible (facial artery).
- The side of the head near the ear (posterior auricular artery).

Electronic measurement

A more precise method of determining heart rate involves the use of an electrocardiograph, or ECG (also abbreviated EKG). An ECG generates a pattern based on electrical activity of the heart, which closely follows heart function. Continuous ECG monitoring is routinely done in many clinical settings, especially in critical care medicine. On the ECG, instantaneous heart rate is calculated using the R wave-to-R wave (RR) interval and multiplying/dividing in order to derive heart rate in heartbeats/min. Multiple methods exist:
- HR = 1,500/(RR interval in millimeters)
- HR = 60/(RR interval in seconds)
- HR = 300/number of "large" squares between successive R waves.
- HR= 1,500 number of large blocks
Heart rate monitors allow measurements to be taken continuously and can be used during exercise when manual measurement would be difficult or impossible (such as when the hands are being used). Various commercial heart rate monitors are also available. Some monitors, used during sport, consist of a chest strap with electrodes. The signal is transmitted to a wrist receiver for display.
Alternative methods of measurement include pulse oximetry and seismocardiography.
Tachycardia
Tachycardia is a resting heart rate more than 100 beats per minute. This number can vary as smaller people and children have faster heart rates than average adults.
Physiological conditions where tachycardia occurs:
- Exercise
- Pregnancy
- Emotional conditions such as anxiety or stress.
Pathological conditions where tachycardia occurs:
- Sepsis
- Fever
- Anemia
- Hypoxia
- Hyperthyroidism
- Hypersecretion of catecholamines
- Cardiomyopathy
- Valvular heart diseases
- Acute Radiation Syndrome
Bradycardia
Bradycardia was defined as a heart rate less than 60 beats per minute when textbooks asserted that the normal range for heart rates was 60–100 bpm. The normal range has since been revised in textbooks to 50–90 bpm for a human at total rest. Setting a lower threshold for bradycardia prevents misclassification of fit individuals as having a pathologic heart rate. The normal heart rate number can vary as children and adolescents tend to have faster heart rates than average adults. Bradycardia may be associated with medical conditions such as hypothyroidism.
Trained athletes tend to have slow resting heart rates, and resting bradycardia in athletes should not be considered abnormal if the individual has no symptoms associated with it. For example, Miguel Indurain, a Spanish cyclist and five time Tour de France winner, had a resting heart rate of 28 beats per minute,[39] one of the lowest ever recorded in a healthy human. Daniel Green achieved the world record for the slowest heartbeat in a healthy human with a heart rate of just 26 bpm in 2014.[40]
Arrhythmia
Arrhythmias are abnormalities of the heart rate and rhythm (sometimes felt as palpitations). They can be divided into two broad categories: fast and slow heart rates. Some cause few or minimal symptoms. Others produce more serious symptoms of lightheadedness, dizziness and fainting.
Correlation with cardiovascular mortality risk
A number of investigations indicate that faster resting heart rate has emerged as a new risk factor for mortality in homeothermic mammals, particularly cardiovascular mortality in human beings. Faster heart rate may accompany increased production of inflammation molecules and increased production of reactive oxygen species in cardiovascular system, in addition to increased mechanical stress to the heart. There is a correlation between increased resting rate and cardiovascular risk. This is not seen to be "using an allotment of heart beats" but rather an increased risk to the system from the increased rate.[41]
An Australian-led international study of patients with cardiovascular disease has shown that heart beat rate is a key indicator for the risk of heart attack. The study, published in The Lancet (September 2008) studied 11,000 people, across 33 countries, who were being treated for heart problems. Those patients whose heart rate was above 70 beats per minute had significantly higher incidence of heart attacks, hospital admissions and the need for surgery. Higher heart rate is thought to be correlated with an increase in heart attack and about a 46 percent increase in hospitalizations for non-fatal or fatal heart attack.[42]
Other studies have shown that a high resting heart rate is associated with an increase in cardiovascular and all-cause mortality in the general population and in patients with chronic disease.[43] A faster resting heart rate is associated with shorter life expectancy[44]and is considered a strong risk factor for heart disease and heart failure,[45] independent of level of physical fitness.[46] Specifically, a resting heart rate above 65 beats per minute has been shown to have a strong independent effect on premature mortality; every 10 beats per minute increase in resting heart rate has been shown to be associated with a 10–20% increase in risk of death.[47] In one study, men with no evidence of heart disease and a resting heart rate of more than 90 beats per minute had a five times higher risk of sudden cardiac death.[45] Similarly, another study found that men with resting heart rates of over 90 beats per minute had an almost two-fold increase in risk for cardiovascular disease mortality; in women it was associated with a three-fold increase.[44]
Given these data, heart rate should be considered in the assessment of cardiovascular risk, even in apparently healthy individuals.[48] Heart rate has many advantages as a clinical parameter: It is inexpensive and quick to measure and is easily understandable.[49]Although the accepted limits of heart rate are between 60 and 100 beats per minute, this was based for convenience on the scale of the squares on electrocardiogram paper; a better definition of normal sinus heart rate may be between 50 and 90 beats per minute.[50]
Standard textbooks of physiology and medicine mention that heart rate (HR) is readily calculated from the ECG as follows:
- HR = 1,500/RR interval in millimeters, HR = 60/RR interval in seconds, or HR = 300/number of large squares between successive R waves. In each case, the authors are actually referring to instantaneous HR, which is the number of times the heart would beat if successive RR intervals were constant. However, because the above formula is almost always mentioned, students determine HR this way without looking at the ECG any further.
Lifestyle and pharmacological regimens may be beneficial to those with high resting heart rates.[47] Exercise is one possible measure to take when an individual's heart rate is higher than 80 beats per minute.[49][51] Diet has also been found to be beneficial in lowering resting heart rate: In studies of resting heart rate and risk of death and cardiac complications on patients with type 2 diabetes, legumes were found to lower resting heart rate.[52] This is thought to occur because in addition to the direct beneficial effects of legumes, they also displace animal proteins in the diet, which are higher in saturated fat and cholesterol.[52]
A very slow heart rate (bradycardia) may be associated with heart block. It may also arise from autonomous nervous system impairment.
Why are doctors still using the stethoscope?
in a hospital for a medical appointment and noticed some doctors with stethoscopes around their necks. it strange that doctors are still relying on them. Isn’t there something better?
that doctors have been using the stethoscope for two centuries to assess the hearts, lungs and bowels of patients by listening to the internal sounds of their bodies.
The first stethoscope – an improvised hollow tube – was developed in 1816 by a French physician, René Laennec, who essentially felt embarrassed about putting his ear on a woman’s chest to hear her beating heart.
Since then, the stethoscope – with its disc-shaped resonator and two tubes connect to earpieces – has become a symbol of the medical profession.
But in recent years there have been calls for doctors to ditch the stethoscope and adopt high-tech devices.
He calls the stethoscope a “relic,” noting that miniaturized ultrasound scanners – not much bigger than a deck of cards – can now provide detailed images of the heart. Other devices that connect to smartphones can amplify heartbeats, help with diagnosis, and the data can be sent wirelessly to patients’ electronic medical records.
These advances certainly seem impressive and there’s little doubt that medicine is heading down the high-tech highway.
However, there are still occasions when low tech can be good tech, says Dr. Donald Redelmeier, a staff physician at Sunnybrook Health Sciences Centre and a professor of medicine at the University of Toronto.
“The stethoscope isn’t perfect, but it isn’t completely ready for the rubbish heap,” says Dr. Redelmeier, who has a reputation for challenging conventional medical wisdom.
He can think of several examples where the old-fashioned stethoscope is more than sufficient to do the job. These include:
- Assessing pregnant women who are short of breath: These patients usually don’t like getting chest X-rays or CT scans, . A stethoscope can help determine if their breathing difficulties are caused by things like a flare-up of asthma or pneumonia because the sounds vary with the condition. “It is convenient. It’s rapid. And it’s safe – no radiation.”
- Declaring a patient dead: Death is not like in the movies – “there is not necessarily a death rattle.” In fact, sometimes it is not obvious the patient has passed away, especially when there’s been a slow steady decline. “The body is still warm and your eyes can play tricks on you as to whether there is any respiratory movement,” he says. The stethoscope can provide an answer. “You lay the stethoscope on the chest and it is absolutely silent,” he says. The patient has expired. “Conversely, if there is the occasional thump, thump, thump going on” then the patient is still alive.
- Checking heart rate: Many patients have a heart rate that’s too fast – sometimes exceeding 160 beats per minute. Doctors will often prescribe medications like beta-blockers to bring the heart rate down to a more normal range of 60 beats. But checking the heart rate by putting two fingers on the wrist can sometimes give a misleading measurement because not every pulse can be felt with this approach. However, if the stethoscope is placed on the chest at the same time, it’s obvious when a heartbeat is not getting through to the wrist.
- Measuring blood pressure: There are now many electronic devices that automatically measure blood pressure. The stethoscope, combined with a sphygmomanometer (inflatable cuff), is a handy backup when the electronic devices crash.
- Detecting heart problems: Before starting an operation, doctors usually want to know if a patient has a pre-existing heart problem that could lead to surgical complications. A definitive diagnosis can be made with an echocardiogram test. But it takes time to order the test and do it. By contrast, the stethoscope can help quickly identify cardiac conditions in patients in need of urgent surgery, such as a senior who has fallen and broken a hip. “The advantage of a stethoscope is that you can do it in five seconds whereas an echocardiogram might take five hours or longer to get the results in the middle of the night, ” he says.
- Gauging recovery from surgery: The anesthetic used in surgery tends to slow down the bowels. Many patients have no appetite and may be nauseous when they wake up after an operation. By using a stethoscope to listen to the belly, the doctor can often get an indication of the patient’s stage of recovery. “When bowel sounds have come back…it can be a sign that the patient is turning the corner.”
But sometimes the iconic stethoscope is the practical and preferable choice.
Indeed, predictions about the demise of the historic listening device could be somewhat premature
XO____XO The Stethoscope and How To Use It
The stethoscope.
It’s practically the symbol of physicians and physician assistants. Most of us know the basics: you put the things in your ears, the other end on a sick person, and listen. But stethoscopes can do much more. The following are a few facts about the tool, followed by a more complete list of its uses. If you’re new to the medical field, getting comfortable with your stethoscope will make you a better student and clinician of medicine.
Origin. Early stethoscopes were little more than “ear tubes,” that were invented in 1816 by René Laennec at the Necker-Enfants Malades Hospital in Paris, France. They were updated here and there, but current designs are credited to Dr. David Littman of Harvard University who made them lighter and gave them better acoustics.
Auscultation: the act of listening for sounds within the body. Latin auscultation-, auscultatio, act of listening, from auscultare to listen.
Parts. Even modern scopes are fairly simple (except the electronic ones that digitally amplify sound). The following diagram will provide you with the important vocabulary:

A stethoscope with bell facing, diaphragm away. “Tunable diaphragms” can be used to listen to high and low pitched sounds by gently on the patient for low sounds, and more firmly for high ones.
The most important parts to know are the diaphragm, which is larger, flatter side of the chest piece, and the bell, which has the smaller, concave piece with a hole in it. Switch between the two by twisting the chest piece 180 degrees. You’ll hear a click. Then tap each side to see which one is “on.”
How it works. The diaphragm is a sealed membrane that vibrates, much like your own eardrum. When it does, it moves the column of air inside the stethoscope tube up and down, which in turn moves air in and out of your ear canal, and voila, you hear sound. Since the surface area of the diaphragm is much greater than that of the column of air that it moves in the tube, the air in the tube must travel more than the diaphragm, causing a magnification of the pressure waves that leave the ear tip. In your ear, larger pressure waves make louder sounds. This is how stethoscopes amplify sounds.
How to wear it. Place the ear tips in the ears, and twist them until they point slightly forward (toward your nose). If you do it right, you’ll make a good seal, and sounds in the room will become very faint.

Like this – the thumb under the tube keeps it from rubbing the skin, which causes extra noise
Holding it. The important tip here is that in most cases you’ll want to hold the chest piece between the distal part of your index and middle finger on you dominant hand. This grip is better than using your fingertips around the edge of the diaphragm/bell because it allows you to press against the patient without your fingers rubbing it and creating extra noise. A gentle touch is best.
Placing it. Place the chest piece (diaphragm or bell) directly against skin for the best sound transmission. If you’re in a hurry you can hold it over one thing layer of clothing, such as a T-shirt, but this isn’t recommended, as doing so risks missing nuances that might be crucial.

Not like this – it’s harder to control and harder to hold gently.
What you can do with it: If you learn the following, you’ll be using yours more than 90% of clinicians. The links will take you to free pages on the specific technique.
- Measuring blood pressure. Probably the most common use, but often done poorly. Placement of the blood pressure cuff is critical. Also, many students are taught that the diastolic BP (e.g. 120/80) is the point in which they can no longer hear the thump of the brachial artery. More accurately, diastolic BP is the number at which the volume of the thump drops dramatically. This is often 4-10 mm Hg higher than when the sound disappears completely.
- Assessing lung sounds: allows you to identify the rate, rhythm and quality of breathing, any obstructions of the airways, as well as rubs that indicate inflammation of the pleura. Don’t forget to start above the clavicle, since lung tissue extends that high. Also, when you listen to the back, have the patient lean forward slightly to expose the triangle of auscultation. Remember that for lung sounds (according to the Bates “Bible,”) we listen in six paired areas on the chest, and seven paired areas on the back. I remember this with the mnemonic “6AM – 7PM,” (6 anterior pairs, and 7 posterior pairs). Always listen to left and right sides at the same level before moving down to the next level – this way you get a side-by-side comparison, and any differences will be more apparent.
- Assessing heart sounds. We listen for rate, type, and rhythm of heart sound, as well as any sounds that shouldn’t be there (adventitious sounds), such as gallops, murmurs or clicks. All hearts sound the same at first. But after listening to many hearts, eventually sounds will seem to jump out at you. For heart sounds, we listen to the four primary areas: left and right of the sternum at the level of the 2nd rib, left of the sternum at the 4th rib, and on the left nipple line at the level of the 5th rib. Remember these with the mnemonic “2-2-4-5.” The names of the valves that you are hearing in these locations are: (2 right) aortic, (2 left) pulmonic, (4) tricuspid, (5) mitral. Remember these with the mnemonic “All Patients Take Meds.” Some of my friends use the mnemonic Apartment M2245 (APT M2245).
- Assessing Bowel Sounds. This is easy to do, and important if there may be a bowel obstruction or paralytic ileus. The gurgling, bubbling noises are called borborygmi. Go figure.
- Detecting bruits. A bruit (pronounced “broo’-ee,”) is an abnormal whooshing sound of blood through an artery that usually indicates that the artery has been narrowed, causing a turbulent flow, as in arterioscleroisis. Bruits are abnormal – if the patient is healthy and “normal,” you should not hear any bruits. Bruits can be detected in the neck (carotid bruits), umbilicus (abdominal aortic bruits), kidneys (renal bruits), femoral, iliac, and temporal arteries. The first true bruit I ever heard was umbilical, just above a patient’s belly button, and when I heard it I knew immediately that the patient had an abdominal aortic aneurysm (AAA). It was an exciting find for me, and it might have saved my patient’s life.
- Measuring the span of the liver. Usually this is done with percussion (tapping the belly), but another neat way is to place the stethoscope below the right nipple, the other index finger just above the belt line in line with the nipple, and gently scratch the skin up toward the chest piece of the stethoscope. When you are over the liver, the sound will become more dull. Marking the location where the dullness begins and ends provides a decent measurement of the liver size in that location. About 10 cm is normal at the nipple line.
- Hearing Aid. Finally, the stethoscope makes a nice hearing aid with hearing impaired patients. Put the eartips in the patient’s ears, and talk into the chest piece. Handy in the ER!
Diaphragm vs. Bell. The diaphragm is best for higher pitched sounds, like breath sounds and normal heart sounds. The bell is best for detecting lower pitch sounds, like some heart murmurs, and some bowel sounds. It is used for the detection of bruits, and for heart sounds (for a cardiac exam, you should listen with the diaphragm, and repeat with the bell). If you use the bell, hold it to the patient’s skin gently for the lowest sounds, and more firmly for the higher ones.
Which one should I buy? Plan on spending no less than $60 for a quality stethoscope. Cheaper ones can work alright, but aren’t as durable, and have weaker sound profiles. The standard by which all others are measured is generally accepted to be the 3M Littman Cardiology III. Don’t spend gobs of money on a digital unless you know you will be working in cardiology – and maybe not even then. To see our stethoscope recommendations, visit stethoscope buyer’s guide page.
Infection control. Clean your stethoscope regularly, particularly the chest piece. Studies have found that stethoscopes are frequently the vectors for patient-to-patient disease transmission. Just wipe the chest piece with an alcohol prep pad to disinfect.
XO____XO SLOW e- IC Stethoscope
Working Principle of Electronic Stethoscope with Circuit Diagram

Electronic Stethoscope
The stethoscope is an electronic device used by the doctors in the medical field or in medical applications. This device is used to listen to the internal sound of a human body or an animal and BP in veins and arteries. Normally, stethoscope includes a round shaped resonator or chest piece and two tubes. Where, the resonator is placed on the chest and tubes are connected to the ears. These devices are also used for monitoring different small scale acoustic tasks and to check the scientific vacuum chambers.
But many researches have been made to upgrade the design of traditional stethoscope. In present days, general types of stethoscopes are available to the consumers are traditional acoustic, amplifying & digitizing. All the electronic stethoscopes fall into two types, namely amplifying & digitizing. The working principle of electronic stethoscopes is similar to acoustic stethoscopes. But, the main difference is, electronic stethoscopes works with a battery and used to amplify human body sound clearly.
Electronic Stethoscope
The sound level of the traditional stethoscope is extremely low. So, electronic stethoscopes use an advanced technology to overcome this problem by electronically amplifying body sounds.
These stethoscopes require a change of audio sound waves obtained through the chest piece into electronic waves which are then transferred through exclusively designed circuitry and managed for optimal listening. The circuit of the stethoscope comprises of various components that permit the energy to be amplified and enhanced for listening at different frequencies.
In this type of stethoscope, the easy and small effective method of sound detection is attained by placing a microphone in the chest piece. This stethoscope is a recording device, and can provide audio and visual o/p, signal enhancement and noise reduction. These stethoscopes are used by CAA (computer aided auscultation) programs to examine the innocent heart murmurs or recorded heart sounds.The electronic stethoscopes are categorized into two types such as amplifying stethoscopes and digitizing stethoscopes.
Digitizing Stethoscopes
The other kind of electronic stethoscope available in the market is digitizing stethoscope. This stethoscope converts the audio signal to the digital signal. These stethoscopes can transfer serialized audio data that can be shared synchronously and forward asynchronously. The working of these units can be done by sensing sound through the sensor in the electronic stethoscope, converts that sound to electricity and runs through the circuit. Finally that can be amplified, filtered and converted from analog to digital data. The digitized data can be sent through RS2323 i/p of the video conferencing unit across a n/w.

Digitizing Stethoscope
Amplifying Stethoscopes
The majority of these stethoscopes on the market has an audio o/p signal, uses a stereo and a mono cable connection, can let the audio o/p received by the stethoscope to be transferred real time to an associated software application. The associated software may employ numerous algorithms that are developed for interpretation and diagnosis of the audio o/p attained from the electronic stethoscopes. The process of audio o/p can be done through numerous accompanying software packages, which can be saved as a file and transmitted through email for diagnosis and asynchronous assessment. Some electronic stethoscopes have audio data o/p options, that can be used to hook up to audio i/p of a video conferencing unit, which would allow them to send the sound data real time over a n/w connection to another endpoint of videoconferencing.

Amplifying Stethoscope
The video conferencing units work as encoders and decoders of the sound data, permitting it to be transferred over a n/w. In this kind of setup, the user needs to be aware of the fact that normally the sound data can only be sent between videoconferencing units and models of brands. Some kind of electronic stethoscopes permits transmission of data via through a Bluetooth which interfaces to other devices. Most of the stethoscopes require Bluetooth receivers (dongles) to transfer data wirelessly. These communication strategies use different technologies, but transmission of this form of data may be a limiting factor mismatch with devices other than computers
Electronic Stethoscope Circuit Diagram
The circuit diagram of electronic stethoscope is shown below. The main purpose of the stethoscope is to hear the heartbeat of the human body or animals. The circuit of the electronic stethoscope is built with a piezo sounder or a melody generator. This transducer has an o/p signal on the order of 100mV and its low frequency response is directed by the i/p impedance of the amplifier.

Electronic Stethoscope Circuit Diagram
Due to this reason we have preferred to use an emitter follower transistor amplifier. This consumes high i/p impedance and confirms that the transducer will have a low frequency response. At the end of the o/p you just need to connect a set of headphones which has a low impedance to be able to hear your heartbeat. Furthermore, to increase the i/p impedance of the amplifier replaces the emitter follower with a Darlington transistor.
Thus, this is all about electronic stethoscope, circuit diagram and its types. We hope that you have got a better understanding of this concept. Furthermore, any queries regarding this topic or electronic stethoscope project, please give your valuable suggestions by commenting in the comment section below.Here is a question for you, what is the difference between an acoustic stethoscope and electronic stethoscope?
Common Emitter Amplifier and Transistor Amplifiers
We generally use various types of electronic devices to design electronics projects or circuits. In some circuits or projects the output signals will be having low strength and are required to be amplified, to detect or use the output. Thus, the output signal can be amplified using amplifier circuits such as single stage transistor amplifiers, multistage transistor amplifiers, common emitter amplifier, and so on. But, what is amplifier circuit?

Amplifier Circuit
An electronic device or circuit that can be used for amplifying the signal (increases the signal power) is called as an electronic amplifier circuit or amp. An electronic circuit that can be used for controlling and amplifying the output signal to match (shape) and make stronger than the input signal is called as amplifier circuit. Amplifier circuits can be classified into different types based on amplifier stages, physical placement, representation of input (linear or nonlinear), and so on. Primarily, electronic amplifiers can be classified as voltage, current, transconductance, and transresistance amplifiers. But, these amplifiers can be realized using different transistor topologies. Our purpose here is to discuss about common emitter amplifier and its working in detail. But, primarily we must know about transistor amplifiers.
Transistor Amplifiers
An electronic circuit that consists of a transistor (as main component) along with other circuitry and is capable to increase the strength of the weak signal is called as a transistor amplifier. These transistor amplifiers are classified into different types such as single stage transistor amplifiers and multistage transistor amplifiers. In single stage transistor amplifiers, only one transistor and other circuitry are used for amplifying, whereas by connecting single stage transistor amplifiers together we can obtain a multistage transistor amplifier.
Common Emitter Transistor Amplifier

Transistor Amplifier Configurations
The most common configuration of transistor amplifier is a common emitter transistor amplifier which is typically used as standard format of transistor circuit where voltage gain is desired. The common emitter amplifier circuit is also termed as an inverting amplifier. The configurations of transistor amplifiers are common base and common collector transistor amplifiers as shown in the figure above.
Common Emitter Amplifier Characteristics
In the common emitter amplifier configuration, the base terminal acts as the input, collector terminal acts as an output, and emitter terminal acts as a common terminal for both output and input terminals. The common emitter amplifier is also called as a grounded emitter amplifier as the emitter is connected to the ground. Hence, this configuration is termed as common emitter configuration and common emitter transistor characteristics are as shown below.
- The voltage gain of the common emitter amplifier is medium
- The current gain of the common emitter transistor amplifier is medium
- The power gain of the common emitter amplifier circuit is high
- Input/Output is having a phase relationship of 180 degrees
- Input and output resistance of common emitter amplifier are medium

Bias vs Gain Characteristics
The above figure represents the bias vs gain characteristics of common emitter amplifier.
Common Emitter Amplifier Working
The common emitter amplifier circuit is shown in the figure below which consists of voltage divider biasing and is used to supply the transistor base bias voltage as per requirement. The voltage divider biasing circuit consists of the potential divider with two resistors connected such that their mid point is used for supplying base bias voltage.

Common Emitter Amplifier Circuit
The common emitter amplifier consists of different electronic components that include resistors R1 used to determine forward bias, R2 is used to develop bias, RL is used for developing the output called as a collector load resistor, and RE is used for thermal stability. Capacitor C1 which is called as a coupling capacitor (including capacitor C2 that can be connected at the output terminal) which is used for separating AC signals from DC biasing voltage. As shown in the figure above bias vs gain common emitter amplifier transistor characteristics, if R2 increases, then forward bias will increase and R1 & bias are inversely proportional to each other.
If a weak signal (AC) is given to the transistor base of the common emitter amplifier circuit, then a small base current (AC) will start flowing. Thus, much larger current will flow through the collector through Rc (which is equal to β-beta times the base current). The voltage across resistance Rc is very this is because the resistor Rc value is very high (in the range of 4 to 10kOhm). Thus, a very high current appears in the collector circuit in the amplified form with the applied weak base signal. Hence, common emitter transistor acts as an amplifier circuit.
Common Emitter Amplifier Current and Voltage Gain
The ratio between collector current (change in collector current) and base current (change in base current) is equal to current gain and voltage gain is given by the product of current gain and ratio of output resistance of the collector circuit to the input resistance of base circuit.

Common Emitter Amplifier Current Gain and Voltage Gain
Common emitter amplifiers are used as low frequency voltage amplifiers and are typically used in RF circuits (radio frequency circuits). These common emitter amplifiers are generally used as low-noise amplifiers.
Type Stethoscope
Acoustic


Acoustic stethoscopes are familiar to most people, and operate on the transmission of sound from the chest piece, via air-filled hollow tubes, to the listener's ears. The chestpiece usually consists of two sides that can be placed against the patient for sensing sound: a diaphragm (plastic disc) or bell (hollow cup). If the diaphragm is placed on the patient, body sounds vibrate the diaphragm, creating acoustic pressure waves which travel up the tubing to the listener's ears. If the bell is placed on the patient, the vibrations of the skin directly produce acoustic pressure waves traveling up to the listener's ears. The bell transmits low frequency sounds, while the diaphragm transmits higher frequency sounds. This two-sided stethoscope was invented by Rappaport and Sprague in the early part of the 20th century.
One problem with acoustic stethoscopes was that the sound level was extremely low. This problem was surmounted in 1999 with the invention of the stratified continuous (inner) lumen, and the kinetic acoustic mechanism in 2002.
Electronic
An electronic stethoscope (or stethophone) overcomes the low sound levels by electronically amplifying body sounds. However, amplification of stethoscope contact artifacts, and component cutoffs (frequency response thresholds of electronic stethoscope microphones, pre-amps, amps, and speakers) limit electronically amplified stethoscopes' overall utility by amplifying mid-range sounds, while simultaneously attenuating high- and low- frequency range sounds. Currently, a number of companies offer electronic stethoscopes. Electronic stethoscopes require conversion of acoustic sound waves to electrical signals which can then be amplified and processed for optimal listening. Unlike acoustic stethoscopes, which are all based on the same physics, transducers in electronic stethoscopes vary widely. The simplest and least effective method of sound detection is achieved by placing a microphone in the chestpiece. This method suffers from ambient noise interference and has fallen out of favor. Another method, used in Welch-Allyn's Meditron stethoscope, comprises placement of a piezoelectric crystal at the head of a metal shaft, the bottom of the shaft making contact with a diaphragm. 3M also uses a piezo-electric crystal placed within foam behind a thick rubber-like diaphragm. The Thinklabs' Rhythm 32 uses an electromagnetic diaphragm with a conductive inner surface to form a capacitive sensor. This diaphragm responds to sound waves, with changes in an electric field replacing changes in air pressure. The Eko Core enables wireless transmission of heart sounds to a smartphone or tablet.
Because the sounds are transmitted electronically, an electronic stethoscope can be a wireless device, can be a recording device, and can provide noise reduction, signal enhancement, and both visual and audio output. Around 2001, Stethographics introduced PC-based software which enabled a phonocardiograph, graphic representation of cardiologic and pulmonologic sounds to be generated, and interpreted according to related algorithms. All of these features are helpful for purposes of telemedicine (remote diagnosis) and teaching.
Electronic stethoscopes are also used with computer-aided auscultation programs to analyze the recorded heart sounds pathological or innocent heart murmurs.
Recording
Some electronic stethoscopes feature direct audio output that can be used with an external recording device, such as a laptop or MP3 recorder. The same connection can be used to listen to the previously recorded auscultation through the stethoscope headphones, allowing for more detailed study for general research as well as evaluation and consultation regarding a particular patient's condition and telemedicine, or remote diagnosis.
There are some smartphone apps that can use the phone as a stethoscope.[18] At least one uses the phone's own microphone to amplify sound, produce a visualization, and e-mail the results. These apps may be used for training purposes or as novelties, but have not yet gained acceptance for professional medical use.[19]
The first stethoscope that could work with a smartphone application was introduced in 2015 [20]
Fetal

A fetal stethoscope or fetoscope is an acoustic stethoscope shaped like a listening trumpet. It is placed against the abdomen of a pregnant woman to listen to the heart sounds of the fetus.[21] The fetal stethoscope is also known as a Pinard horn after French obstetrician Adolphe Pinard (1844–1934).
Doppler
A Doppler stethoscope is an electronic device that measures the Doppler effect of ultrasound waves reflected from organs within the body. Motion is detected by the change in frequency, due to the Doppler effect, of the reflected waves. Hence the Doppler stethoscope is particularly suited to deal with moving objects such as a beating heart.[22] It was recently demonstrated that continuous Doppler enables the auscultation of valvular movements and blood flow sounds that are undetected during cardiac examination with a stethoscope in adults. The Doppler auscultation presented a sensitivity of 84% for the detection of aortic regurgitations while classic stethoscope auscultation presented a sensitivity of 58%. Moreover, Doppler auscultation was superior in the detection of impaired ventricular relaxation. Since the physics of Doppler auscultation and classic auscultation are different, it has been suggested that both methods could complement each other.[23][24] A military noise-immune Doppler based stethoscope has recently been developed for auscultation of patients in loud sound environments (up to 110 dB).
3D-printed
A 3D-printed stethoscope is an open-source medical device meant for auscultation and manufactured via means of 3D printing.[25] The 3D stethoscope was developed by Dr. Tarek Loubani and a team of medical and technology specialists. The 3D-stethoscope was developed as part of the Glia project, and its design is open source from the outset. The stethoscope gained widespread media coverage in Summer 2015.
The need for a 3D-stethoscope was borne out of a lack of stethoscopes and other vital medical equipment because of the blockade of the Gaza Strip, where Loubani, a Palestinian-Canadian, worked as an emergency physician during the 2012 conflict in Gaza. The 1960s-era Littmann Cardiology 3 stethoscope became the basis for the 3D-printed stethoscope developed by Loubani.
Earpieces
Stethoscopes usually have rubber earpieces, which aid comfort and create a seal with the ear, improving the acoustic function of the device. Stethoscopes can be modified by replacing the standard earpieces with moulded versions, which improve comfort and transmission of sound. Moulded earpieces can be cast by an audiologist or made by the stethoscope user from a kit.
A Doppler fetal monitor is a hand-held ultrasound transducer used to detect the fetal heartbeat for prenatal care. It uses the Doppler effect to provide an audible simulation of the heart beat. Some models also display the heart rate in beats per minute (BPM). Use of this monitor is sometimes known as Doppler auscultation. The Doppler fetal monitor is commonly referred to simply as a Doppler or fetal Doppler. It may be classified as a form of Doppler ultrasonography (although usually not technically -graphy but rather sound-generating).
Doppler fetal monitors provide information about the fetus similar to that provided by a fetal stethoscope. One advantage of the Doppler fetal monitor over a (purely acoustic) fetal stethoscope is the electronic audio output, which allows people other than the user to hear the heartbeat. One disadvantage is the greater complexity and cost and the lower reliability of an electronic device.
The device was invented in 1958 by Dr. Edward H. Hon,[1] Originally intended for use by health care professionals, this device is becoming popular for personal use.
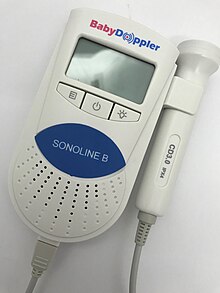
A major advantage of being able to record and share the recording is that it can be emailed to a healthcare professional to be checked if there are any concerns about whether or not it is the fetus's heart rate and whether or not is normal. Typically, they work from about 12 weeks.
In response to increasing home usage of clinical fetal doppler systems, the FDA issued a formal statement recommending against at-home use.[3] Fetal dopplers using 2-3GHz ultrasound are prescription devices designed and developed for use by licensed and trained health care professionals. System misuse (duration, angulation) and systems operating outside of intended range can produce thermal and non-thermal effects on fetal tissue,[4] including the possibility for over-heating fetal tissue and introducing mechanical stress on the fetus due to cavitation, radiation force, and acoustic streaming.
The use of the word Sonicaid for Doppler fetal monitors comes from the products of the UK company Sonicaid Ltd. Sonicaid products included the D205/206 portable fetal Dopplers and FM2/3/4 series of fetal monitors. The company was acquired by Oxford Instruments in 1987 to form Oxford Sonicaid.
Doppler auscultation in adults
It was recently demonstrated that continuous Doppler enables the auscultation of valvular movements and blood flow sounds that are undetected during cardiac examination with a stethoscope in adults. The Doppler auscultation presented a sensitivity of 84% for the detection of aortic regurgitations, while classic stethoscope auscultation presented a sensitivity of 58%. Moreover, Doppler auscultation was superior in the detection of impaired ventricular relaxation Since the physics of Doppler auscultation and classic auscultation are different, it has been suggested that both methods could complement each other.[

Electronic Stethoscope

Electronic Stethoscope Circuit

An electronic stethoscope is used to listen to your heartbeat and you would normally use a listening tube or stethoscope. This electronic stethoscope circuit uses a piezo sounder from a musical greetings card or melody generator, as a microphone. This transducer has an output signal in the order of 100 mV and its low frequency response is governed by the input impedance of the amplifier.
For this reason we have chosen to use an emitter follower transistor amplifier. This has a high input impedance and ensures that the transducer will have a very low frequency response. At the output you just need to connect a set of low impedance headphones to be able to listen to your heartbeat.
For this reason we have chosen to use an emitter follower transistor amplifier. This has a high input impedance and ensures that the transducer will have a very low frequency response. At the output you just need to connect a set of low impedance headphones to be able to listen to your heartbeat.
Replacing the emitter follower with a Darlington transistor configuration will further increase the input impedance of the amplifier.
Electronic Stethoscope Circuit diagram
Acupuncture Point Locator Circuit
This acupunture point locator circuit is used to locate the sensitive acupuncture points location on the human body. Acupuncture belongs to the traditional alternative medicine. This healing method require the knowledge of the correct location of the important ponts of the body. Traditional acupuncture specialists rely on their expert knowledge to locate these points.
Many of them also use electronic devices to help them locate these points. Most of these electronic devices measure the skin resistance based on the observed phenomenon that the skin resistance is lower on these acupuncture points.
The featured electronic acupuncture point location circuit uses a PLL IC . This is a CMOS IC with an integrated VCO that is ideal for the application. The frequency range of the VCO is set by the RC circuit R3/C1. This is also dependent on a control voltage. This control voltage comes from a voltage divider circuit which is made of the skin resistance in conjunction with R1 and P1. With a decreasing skin resistance, the control voltage and the frequency increases. The signal can be heard through the speaker. Transistor T1 delivers enough power to drive the speaker.
Acupuncture point location circuit diagram

Note:
Use only batteries to power the acupuncture point locator circuit. Never connect it to main power lines. The current consumption is around 45 mA at 9 volts.
Electronic Stethoscope
Stethoscopes are not only useful for doctors, but home mechanics, exterminators, spying and any number of other uses. Standard stethoscopes provide no amplification which limits their use. This circuit uses op-amps to greatly amplify a standard stethoscope, and includes a low pass filter to remove background noise.
Circuit diagram

Parts:
R1 10K 1/4W Resistor
R2, R3, R9 2.2K 1/4W Resistor
R4 47K 1/4W Resistor
R5, R6, R7 33K 1/4W Resistor
R8 56K 1/4W Resistor
R10 4.7K 1/4W Resistor
R11 2.5K Pot
R12 330K 1/4W Resistor
R13 1K 1/4W Resistor
R14 3.9 Ohm 1/4W Resistor
C1 470uF Electrolytic Capacitor
C2, C3, C4 0.047uF Capacitor
C5 0.1uF Capacitor
C6 1000uF Electrolytic Capacitor
D1 Bi-Colour LED
U1, U2, U3, U4, U5 741 Op-Amp
MIC1 Electret Mic
J1 1/4" Phone Jack
MISC Board, Wire, Sockets for ICs, Knob for pot, Stethoscope, Rubber tube
Notes:
1. MIC1 is an assembly made out of a stethoscope head and electret mic. Cut the head off the stethoscope and use a small piece of rubber tube to join the nipple on the head to the mic.
2. Be careful with the volume, as excess noise level may damage your ears.
3. The + and - 9V may be supplied by two 9V batteries wired in series and tapped at the junction.
4. R11 is the volume control.
Description
Stethoscopes are not only useful for doctors, but home mechanics, exterminators, spying and any number of other uses. Standard stethoscopes provide no amplification which limits their use. This circuit uses op-amps to greatly amplify a standard stethoscope, and includes a low pass filter to remove background noise.
Circuit diagram

Parts:
- R1 10K 1/4W Resistor
- R2, R3, R9 2.2K 1/4W Resistor
- R4 47K 1/4W Resistor
- R5, R6, R7 33K 1/4W Resistor
- R8 56K 1/4W Resistor
- R10 4.7K 1/4W Resistor
- R11 2.5K Pot
- R12 330K 1/4W Resistor
- R13 1K 1/4W Resistor
- R14 3.9 Ohm 1/4W Resistor
- C1 470uF Electrolytic Capacitor
- C2, C3, C4 0.047uF Capacitor
- C5 0.1uF Capacitor
- C6 1000uF Electrolytic Capacitor
- D1 Bi-Colour LED
- U1, U2, U3, U4, U5 741 Op-Amp
- MIC1 Electret Mic
- J1 1/4" Phone Jack
- MISC Board, Wire, Sockets for ICs, Knob for pot, Stethoscope, Rubber tube
Notes:
- MIC1 is an assembly made out of a stethoscope head and electret mic. Cut the head off the stethoscope and use a small piece of rubber tube to join the nipple on the head to the mic.
- Be careful with the volume, as excess noise level may damage your ears.
- The + and - 9V may be supplied by two 9V batteries wired in series and tapped at the junction.
- R11 is the volume control.
Making a Stethescope Amplifier – Full Circuit Diagram with Guide
how to make an electronic stethoscope amplifier circuit for enabling a loud audible reproduction of the heart beats which is being diagnosed.
Significance- An ordinary stethoscope is a device used to listen to breathing and heart sounds. A hollow rubber tube is connected at one end to a disk shaped diaphragm (placed over the patient) and other end connected to as Y shape to the ear of listener. As breathing and heart sounds create slight vibrations, these make the diaphragm vibrate and then the sound is amplified in the disk and audible through the tube to the other end.
In hospitals, often there is noise of other equipment hence the weak sounds transmitted by stethoscope are sometimes inaudible and important diagnosis missed by the listener.
The Objective - A circuit is requested that picks up sound vibrations from the diaphragm of the stethoscope and convert it to electronic signals that are then amplified and can be heard through a speaker loud enough that connecting to ears is not required and no sound is missed (even by less experienced practitioners).
The battery utilised may be small lightweight 4.5V or 6V (like ones used in rechargeable led torch) OR through mobile power banks since stethoscope must be portable and easy to carry at the same time avoiding wall socket connections for power supply.
As an improvement of this circuit - If possible the circuit may derive power through an android phone directly AND again if possible the output signals may be visualized as a graph in the android screen.
As there is no direct contact with ears, this will also prevent cross infection of ears as sometimes happens when one stethoscope is used by multiple users.
The Design
The sound of a heart beat can be extremely weak and therefore it cannot be heard without a minimum suitable device such as a stethoscope.
A stethoscope is a basic device which relies on picking and transferring the air vibrations through a tube into the ears of the user.
The vibrations are caused by the heart beats on the stethoscope's sensing diaphragm when it is brought at a close proximity to the chest where the heart is situated, and the diaphragm movement sets the air column inside the tube into a correspondingly push-pull vibrating motion
This surely means that even though the air vibration or the sound vibration generated by the heart could be small enough but it's loud enough to be heard without the aid of electrical device, which implies that the sound may be sufficiently strong to be amplified using an audio amplifier, because if a naked ear can hear these minute vibrations so can the amplifier MIC.
Producing Heartbeat in Loudspeaker
In order to reproduce the sound over a loudspeaker, the signal needs to be amplified significantly and also in the course it must be suitably processed to remove any associated disturbances.
The circuit diagram of the proposed electronic stethoscope amplifier is designed using two stages, one consisting of the opamp based tone control circuit, and the integrated proper amplifier stage.
The tone control stage is built around the opamp 741, and with the help of the associated RC networks and the pots. The upper pot controls the low frequency limit, while the lower pot is used to control the upper frequency limit. Both these pots can be appropriately set for achieving the best possible sound clarity.
In addition to the sound processing, the opamp stage also acts like a preamplifier for elevating the very low amplitude of the heart beat pulses to a suitable level for the power amplifier input. This enables the power amplifier to pick the signals at above the required minimum detectable level and amplify it on the loudspeakers optimally.
MIC as the main Sensor
The main sensing stage of this electronic stethoscope circuit is formed by an electret MIC which can be seen configured across the input of the tone control stage via an RC network.
In order to enable the MIC to sense the minute heart beat signals, the mic is enclosed within a rubber pipe with a rubber funnel like mouth opening.
The funnel like opening is supposed to be stuck over the chest of the patient just above the heart area for allowing the MIC to detect the concentrated heart rate sound and convert it into minute proportionately pulsating electrical pulses.
The opamp circuit responds to these signals and processes it appropriately as per the setting of the low pass and the high pass filter pots.
The finalized signal is applied to the input of the power amplifier configured around the TDA2003 amplifier circuit which is capable of generating a strong 10 watts of amplification over a 8 ohm loudspeaker.
The pot between the 741 output and the TDA input determines the volume of sound and can be adjusted for the same.
A Simpler Alternative (using a Wireless FM Transmitter)
In the request we also see the mentioning of a android phone compatible unit, which is difficult to achieve using the above circuit since the minimum operating voltage of this circuit can be over 12V so it cannot be operated easily using a cellphone existing battery
A simpler yet a more advanced method for achieving an electronic stethoscope amplifier functionality with a cellphone is to go wireless.
A small FM transmitter circuit can be used and positioned near the chest of the patient, and the heart pulses can be heard or recorded loud and clear over any cellphone equipped with an FM radio, which is commonly included in all standard cellphone regardless of its sophistication level.
The mic will need to be encapsulated appropriately inside a pipe/funnel kind of enclosure as suggested in the previous discussion, so that other forms of disturbances become undetectable for the MIC.
Once the heart beats are recorded inside the android phone, this can be easily used with a suitable app for converting the same into a graphical format and for enabling a more scientific assessment of the patient heart condition.
The wireless stethoscope amplifier circuit set up can be understood from the following diagram
Parts List
R1 =1M,
R2 = 2K2,
R3 = 470 Ohms,
R4 = 39K,
R5 = 470 Ohms,
R6 = 4k7
R7 = 270K
C1 = 0.1 uF,
C2 = 4.7 uF,
C3, C6 = 0.001uF,
C4 = 3.3pF,
C5 = 10pF,
C7 = 100uF/16V
D1----D4 = 1N4007
L1 = See Text
T1, T2 = BC547B,
T3 = BC557B
TR1 = transformer, 0-9V, 100mA
The design explained above needs to be correctly optimized in order to get the most favorable results, however in order to enhance the outcome to maximum, a transistorized MIC preamp could be introduced at C5, as illustrated in the following diagram, this should hopefully make the proposed electronic stethoscope circuit extremely sensitive and enable the heartbeat to become loudly audible.
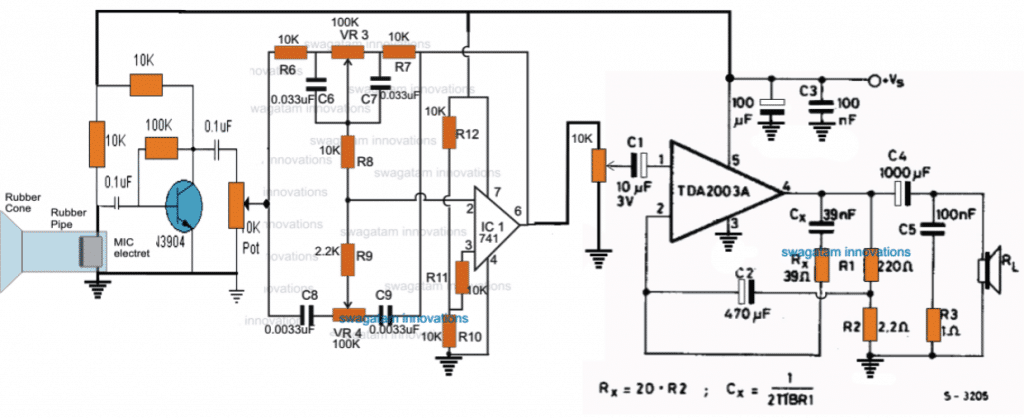
ELECTRONIC STETHOSCOPE - FIND THAT NOISE!
The first listening aid (for automobiles) was an acoustic stethoscope, similar to a medical acoustic stethoscope except for the sound pickup (actually a vibration pickup). A metal probe connected to a diaphragm is used. The back of the diaphragm is enclosed, and flexible tubes connect it to metal earpieces. The probe is placed in contact with suspected sources of noise, and vibrations conducted by the probe to the diaphragm are converted into sound waves which travel through the tubes to the earpieces.
An electronic stethoscope can be a considerable improvement over an acoustic stethoscope. It is more sensitive, has better frequency response, and has a volume control to reduce the level when the noise is loud.
Several electronic units are sold by automobile parts and equipment suppliers, and several construction articles have been published in electronics publications.
In these units, the noise is picked up by a probe, then amplified and sent to headphones. Most of them use a small microphone element in the probe which picks up sounds from the air; a few use a vibration probe.
With a microphone, the probe does not have to contact the noise source. As it is brought near the source of noise, the sound in the headphones gets louder. For some noises, a microphone probe is better. For others — for example, a noisy alternator bearing — a vibration probe is better.
When I needed to find a noise in my car, I looked at several published stethoscope circuits. Most of them used several parts or required high-impedance headphones. Some required a split power supply. I had recently built some circuits using the LM386 power amplifier IC, and I decided a simpler, better stethoscope could be built using it.
My circuit uses a single LM386 and a few other parts, operates from a single nine-volt battery, and drives standard stereo headphones with more than adequate volume. Not only are stereo headphones easier to find (most of us have some extras lying around), their wide frequency response gives better reproduction of low-frequency noises than most high-impedance headphones.
In some published stethoscope circuits, stereo headphones are used, but the headphone units are connected in series to increase their impedance for adequate volume.
A series connection drives the headphones out of phase, which may produce an odd sound. The electronic stethoscope has more than adequate power and gain with the headphones connected in parallel (producing more natural in-phase sound from the headphone units).
Several stereo headphones were tried, all of them provided higher volume than is needed. Both types of probes — a microphone probe and a vibration probe — are included, for use with different types of noises.
CIRCUIT DESCRIPTION
The LM386 power-amplifier IC is used in the electronic stethoscope. A number of circuits have been published using the LM386, one of the most useful, readily available guides is the LM386 data sheet in Radio Shack’s Semiconductor Reference Guide.
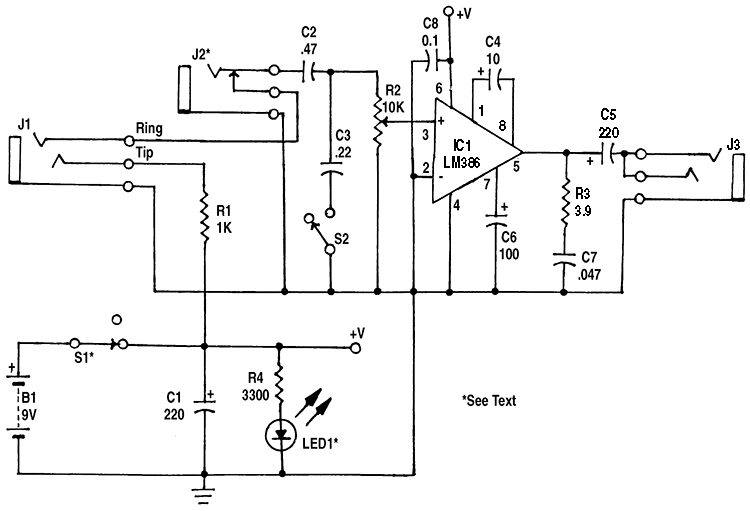 |
| Figure 1. In the stethoscope amplifier, IC1 has a voltage gain of 200. |
In the electronic stethoscope circuit (shown in Figure 1), the LM386 operates at its maximum voltage gain of about 200; R2 is the volume control. (In circuits using the LM386, if C4 is omitted, the gain is about 20 and bypass capacitor C6 is not needed. Intermediate gains can be obtained by connecting a resistor in series with C4; 1200 ohms gives a gain of about 50.)
R3 and C7 improve high-frequency stability of the amplifier. In building several different circuits using the LM386, power supply bypass capacitor C8 has been very important in assuring a stable amplifier. It should be located close to IC1 (within one or two inches on the board). Some published circuits for the LM386 do not use it, but one circuit I built was very unstable until it was added.
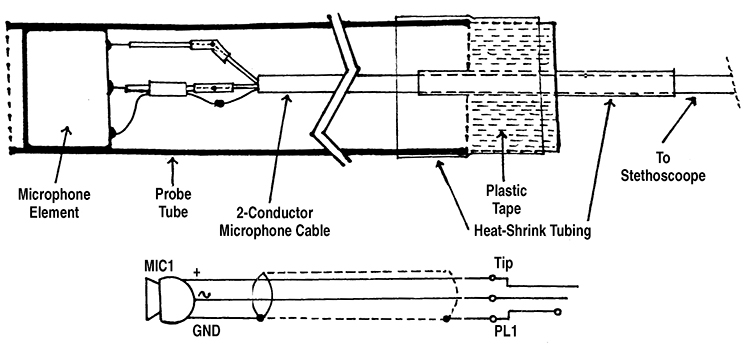 |
| Figure 2. The Microphone Probe. |
Battery operation is possible because the quiescent current of IC1 is about 5 mA. For low battery drain, LED1 — the pilot light — is a low-current type, which draws only 2 to 2.5 mA. C3 and S2 form a treble-cut tone control, useful when looking for a low-frequency noise. The microphone element in the microphone probe (Figure 2) is connected directly to the input of the amplifier.
A piezo element is used as a pickup transducer in the vibration probe (Figure 3). When used as a sound source, a piezo element cannot produce low frequencies, because of the small size and stiffness of the vibrating element. However, when used as a pickup, it has a fairly good low-frequency response. (Similarly, the small diaphragm of the microphone could not produce low frequencies, but it is effective in picking up low frequencies.)
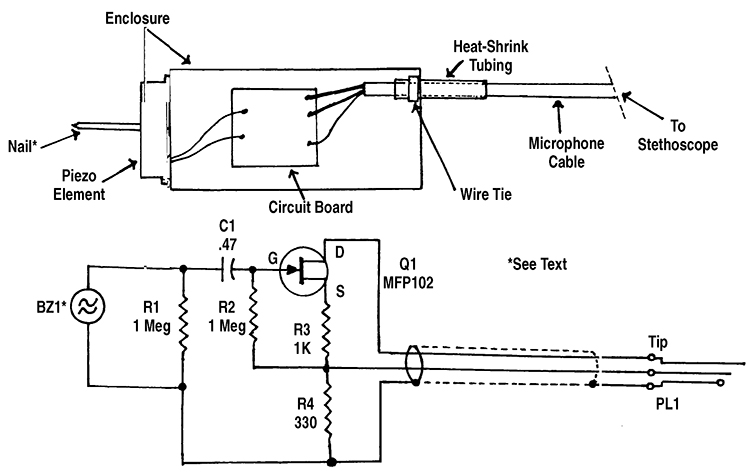 |
| Figure 3. The Vibration Probe. |
Because of its effective internal series capacitance of 0.025 µF, the piezo element (BZ1) must be connected to a circuit with a high input impedance for good low-frequency response. If it was connected directly to the amplifier input, the 10,000 ohm resistance of R2 would cause the low frequency response to roll off at 6 dB per octave below about 640 Hz.
In the circuit in Figure 3, Q1 is used as a source follower. Its high input impedance eliminates low-frequency roll off; its gain is slightly less than one. The output of the vibration probe is still higher than the output of the microphone probe; R3 and R4 form a voltage divider to reduce the output.
The impedance matching circuit of Figure 3 is located in the probe to eliminate noise pickup in the shielded cable. (High-impedance cables pick up noise unless they are very well shielded, and there is lots of noise around a car engine!)
CONSTRUCTION
The circuit was built on one section of a RadioShack 276-159 Dual IC Project Board. (I have found this board to be useful for many small projects, using one IC, two small ICs, or several parts but no ICs.) Not all of the board is used and it is possible to cut off one or two edges of the board (with a fine-tooth hacksaw) to make it a better fit in the case.
A RadioShack 270-239 metal case (left over from an earlier project) was used. A plastic case could probably be used, as the shielding of a metal case does not seem to be necessary; there is little hum or noise pickup in the amplifier. R2, S2, J1, J3, and LED1 were all mounted in one end of the case, allowing the case to be placed in a pocket or clipped to the user’s clothing.
The two-conductor shielded microphone cables to the probes are about four feet long. Probe jack J1 is a miniature (1/8”) stereo phone jack. This could cause a problem, as output jack J3 is also a stereo phone jack. I tried to find a different connector for J1, but could not find a three-conductor connector that is small enough to fit in the end of the case.
I used a regular (1/4”) jack for J3, both to make it different from J1 and to allow large headphones to be used, since most large headphones have a 1/4” plug. (An adapter is used for headphones with a 1/8” plug.) R1 was added to prevent shorting B1 if headphones are accidentally plugged into J1.
If a different connector is used for J1, R1 can be omitted. (The supply voltage rating of MIC1 is 4 to 10 volts; it can be supplied directly by B1.)
J2 was added to allow the amplifier to be used separately — such as an audio signal tracer — when needed. It was mounted on the side of the case, as there was not room on the end.
S2 can be replaced by a 10,000-ohm pot, for a variable treble-cut tone control. In my unit, there was not room in the end of the case for another pot (S2 is smaller). If a pot is used, you may want to change C3 to 0.47 µF or larger, for more high-frequency reduction at the maximum cut setting.
There are several sources for low-current LED1 (2 to 2.5 mA) used for a pilot light. A red low-current LED is sold by RadioShack (stock number 276-044). QT Optoelectronics low-current LEDs are available from Digi-Key Corp. (701 Brooks Ave. South, P.O. Box 677, Thief River Falls, MN 56701-0677, phone 1-800-344-4539) as stock number HLMP-4700QT-ND (red) and HLMP-4719QT-ND (yellow).
(The current rating of these is not shown in recent Digi-Key catalogs, but was shown in earlier catalogs, and I used these LEDs in my stethoscope and in several other battery-powered projects.)
Hewlett Packard No. HLMP-4700 (red) is available from Hosfelt Electronics, Inc. (2700 Sunset Blvd., Steubenville, OH 43952, phone 1-800-524-6464), as stock number 25-325. Other low-current LEDs, available from various distributors, include those manufactured by Lumex Optoelectronics, Inc., Industrial Devices, Inc., Chicago Miniature Lamps, and Linrose Electronics, Inc.
I built the microphone probe in a metal “faucet supply tube” (used in plumbing). This has an outside diameter of 3/8”, expanded to about 1/2” at the end which attaches to the faucet. The expanded end, which is partially closed, was drilled out to 3/8” diameter to fit MIC1. The tube is longer than needed for the probe, and can be cut to a suitable length (about 4” to 6”).
A plastic faucet supply tube is also available (it probably could be used), as well as a higher-priced “flexible” metal tube, which probably would not work as a probe housing.
If you have trouble finding a faucet supply tube, a straight metal or plastic tube, 3/8” inside diameter, can be used.
Construction of the probe using a straight tube is shown in Figure 2. The shielded cable is spliced to the short cable attached to the microphone element. Then the microphone element is mounted, with a small amount of glue, near the end of the probe tube.
Strain relief must be provided where the cable leaves the probe, to prevent pulling on the microphone or on the splices. The strain relief I used is also shown in Figure 2.
First, a 2-1/2” to 3” length of heatshrink tubing is placed over the cable (this is easier if it is done before the microphone element is mounted in the probe). Then, after the element is in the probe, the cable is wrapped with 3/4” plastic electrical tape to a diameter just smaller than the probe tube.
About 2” of 1/2” heatshrink tubing is placed over the plastic tape and the probe tube to hold them together. (If desired, the heatshrink tubing can extend over the entire length of a metal probe tube to protect against shorts if the probe is dropped.)
The circuit and construction of the vibration probe is shown in Figure 3. An encased piezo element is used as a vibration transducer. It is fastened to the end of a small project box with plastic glue or Super Glue™.
A standard four-penny (1-1/2”) nail is used as the vibration pickup. It is glued to the center of the piezo element, extending through the hole in the element case. The glue would be strong enough to hold the nail to the element, but not so strong as to tear the metal coating on the element if there is a blow to the nail. Super Glue or epoxy glue are probably best.
The nail, next to the head, was built-up with 3/4” electrical tape and heatshrink tubing to the diameter of the hole in the element case, to (hopefully) protect against a blow to the nail. (After the nail in my unit was loosened by a blow, I made a carrying case for the vibration probe from a small shipping box. Plastic foam was cut to shape and glued in the box to hold the probe in place.)
If the head of the nail is not smooth, it should be smoothed with a file. If the nail head is larger than the hole in the piezo element case, the edge of the head can be filed to a smaller diameter, or the hole in the element case enlarged (very carefully).
The impedance matching circuit (Q1 and associated parts) was built on a small perforated board and mounted in the probe enclosure. Q1 can be an MPF102, 2N3819, or similar small JFET. Note that the gate is lead 3 on a MPF102, and lead 2 on a 2N3819.
On these and many other small JFETs, the source and drain are interchangeable. To provide strain relief, a length of heatshrink tubing (about 2”) was placed on the probe cable where it leaves the enclosure. Then a wire tie was tightened over the heatshrink tubing inside the enclosure until the tie would not slide on the cable (see Figure 3).
TESTING AND OPERATION
Connect the microphone probe and turn on the amplifier. At higher volume settings, sound should be heard in the headphones if the probe is near any source of sound. There may be a feedback howl if the probe is brought close to the headphones.
To use the stethoscope, bring the probe close to suspected sources of noise. The sound in the headphones will get louder as the microphone probe is brought closer to the noise source. If you have trouble locating the source, switch to the vibration probe.
For example, a noisy alternator bearing produced similar noise levels with the microphone probe when the probe was near any part of the alternator. But when touching both ends of the alternator with the vibration probe, the end with the bad bearing was noticeably louder.
The microphone probe can also be used for checking stereo speakers. Good quality headphones should be used, preferably large-size units with a cushion which reduces external sounds. Hold the probe a few inches in front of each tweeter, mid-range, and woofer unit.
Any noise, distortion, weak sound, etc., can be heard in the headphones when the probe is in front of the defective unit. If in doubt, compare with the sound from the speaker for the other channel.
You can also do a rough check of the dispersion angle of a tweeter by holding the probe at different angles and positions in front of the tweeter.
AMPLIFIER PARTS LIST (FIGURE 1)
SEMICONDUCTORS
IC1 - LM386 audio amplifier, integrated circuit
LED1 - Low-current LED (see text)
IC1 - LM386 audio amplifier, integrated circuit
LED1 - Low-current LED (see text)
RESISTORS (1/4-watt, 5% or 10%)
R1 - 1,000 ohm
R2 - 10,000 ohm audio taper panel-mount potentiometer, with switch (Radio Shack 271-215 or
similar)
R3 - 3.9 ohm
R4 - 3,300 ohm
R1 - 1,000 ohm
R2 - 10,000 ohm audio taper panel-mount potentiometer, with switch (Radio Shack 271-215 or
similar)
R3 - 3.9 ohm
R4 - 3,300 ohm
CAPACITORS
C1, C5 - 220 µF, 16 WVDC, electrolytic
C2 - 0.47 µF, ceramic disc or Mylar
C3 - 0.22 µF, ceramic disc or Mylar
C4 - 10 µF, 16 WVDC, electrolytic
C6 - 100 µF, 16 WVDC, electrolytic
C7 - 0.047 µF, ceramic disc or Mylar
C8 - 0.1 µF, ceramic disc or Mylar
C1, C5 - 220 µF, 16 WVDC, electrolytic
C2 - 0.47 µF, ceramic disc or Mylar
C3 - 0.22 µF, ceramic disc or Mylar
C4 - 10 µF, 16 WVDC, electrolytic
C6 - 100 µF, 16 WVDC, electrolytic
C7 - 0.047 µF, ceramic disc or Mylar
C8 - 0.1 µF, ceramic disc or Mylar
OTHER COMPONENTS
J1 - Miniature (1/8”) stereo phone jack (see text)
J2 - Closed circuit mono phone jack (optional, see text)
J3 - 1/4” stereo phone jack (see text)
S1 - Power switch (part of R2)
S2 - SPST miniature slide or toggle switch
B1 - Nine-volt alkaline battery
J1 - Miniature (1/8”) stereo phone jack (see text)
J2 - Closed circuit mono phone jack (optional, see text)
J3 - 1/4” stereo phone jack (see text)
S1 - Power switch (part of R2)
S2 - SPST miniature slide or toggle switch
B1 - Nine-volt alkaline battery
MISCELLANEOUS
Enclosure (see text), circuit board (Radio Shack 276-159 or similar, see text), stereo headphones, nine-volt battery snap with leads, knob, wire, solder, hardware, etc.
Enclosure (see text), circuit board (Radio Shack 276-159 or similar, see text), stereo headphones, nine-volt battery snap with leads, knob, wire, solder, hardware, etc.
MICROPHONE PROBE PARTS LIST (FIGURE 2)
MIC1 - Electret microphone element (Radio Shack 270-092 or similar)
PL1 - 1/8” stereo phone plug (see text)
Small two-conductor shielded cable (Radio Shack 278-514 or similar), “faucet supply tube” or 3/8” ID tubing (metal or plastic, see text), heatshrink tubing, plastic electrical tape, wire, solder, etc.
PL1 - 1/8” stereo phone plug (see text)
Small two-conductor shielded cable (Radio Shack 278-514 or similar), “faucet supply tube” or 3/8” ID tubing (metal or plastic, see text), heatshrink tubing, plastic electrical tape, wire, solder, etc.
VIBRATION PROBE PARTS LIST (FIGURE 3)
RESISTORS (1/4-watt, 5% or 10%)
R1 , R2 - 1 megohm
R3 - 1,000 ohm
R4 - 330 ohm
R1 , R2 - 1 megohm
R3 - 1,000 ohm
R4 - 330 ohm
OTHER COMPONENTS
Q1 - MPF102 or similar JFET
C1 - 0.47 µF, ceramic disc or Mylar capacitor
BZ1 - Encased piezo element (Radio Shack 273-073 or similar)
PL1 - 1/8” stereo phone plug (see text)
Q1 - MPF102 or similar JFET
C1 - 0.47 µF, ceramic disc or Mylar capacitor
BZ1 - Encased piezo element (Radio Shack 273-073 or similar)
PL1 - 1/8” stereo phone plug (see text)
MISCELLANEOUS
Enclosure (Radio Shack 270-220 or similar), small two-conductor shielded cable (Radio Shack 278-514 or similar), four-penny (1-1/2”) nail, small perforated board, heatshrink tubing, small wire tie, wire, solder, etc.
Enclosure (Radio Shack 270-220 or similar), small two-conductor shielded cable (Radio Shack 278-514 or similar), four-penny (1-1/2”) nail, small perforated board, heatshrink tubing, small wire tie, wire, solder, etc.

Transmitter circuit diagram of the designed wireless electronic esophageal stethoscope
Digital Stethoscope
A portable, electronic auscultation device
"A digital stethoscope that can amplify, play, and record heart signals in real-time."
The purpose of this project was to design and implement a digital stethoscope to serve as a platform for potential computer aided diagnosis (CAD) applications for the detection of cardiac murmurs. The system uses a custom-built sensor to capture heart sounds at 8 kHz and converts them to electrical signals to be processed by an ATmega644 microcontroller. The captured signals are outputted via pulse-width modulation to a standard 3.5 mm audio socket for real-time auscultation. In addition, the stethoscope uses a 1MB external Flash memory chip to record and playback audio waveforms. For the user interface, the system includes a 4-line 20-character wide LCD display and a 16-button keypad. Real-time and recorded data can also be visualized using a MATLAB interface that runs on a separate PC and connects to the stethoscope system via the USART interface on the microcontroller. The MATLAB interface also uses the transmitted data to calculate and display the patient’s average heart rate in beats per minute.
This project is meant to provide a framework for developing useful embedded CAD tools for cardiac murmur detection. Heart murmurs may go unnoticed during routine check-ups since detection relies on the training of physicians, the quality of the equipment used, and the severity of the condition. A digital stethoscope can be used to assist physicians in analyzing cardiac signals in real time during auscultation to reduce the risks of not detecting certain conditions.

Figure 1. Digital Stethoscope System
High Level Design
Overview
The overall architecture of the system is centered on the ATmega644 microcontroller. The acoustic sensor and keypad are inputs to the MCU, while the LCD, headphones, and MATLAB visualization tool are outputs. Communication with the Flash memory is bi-directional. Figure 2 shows an overview of the system high level design.
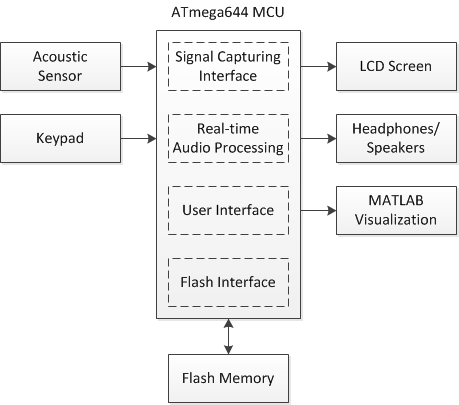
Figure 2. System High Level Design
The MCU runs several software interfaces to support the various features of the digital stethoscope. The signal capturing interface uses the analog-to-digital converter to sample the acoustic sensor at 8 kHz. The real-time audio processing module modifies the measured signal based on user settings and outputs it to the 3.5 mm audio socket via pulse-width modulation. The user interface supports the detection and de-bouncing of keypad button presses as well as controls the LCD display to reflect the current state of the system. In addition, the user interface also outputs real-time or recorded data at 100 Hz to a MATLAB utility running on a separate PC for signal visualization and average heart rate calculations. The Flash interface includes a software library for SPI communication to read from and write data to the external Flash memory chip.
Hardware Design & Implementation
Stethoscope Acoustic Sensor
The stethoscope acoustic sensor was an integral hardware component of the system. The quality of the sensor directly impacts the quality of the real-time audio output as well as all analyses performed on the measured waveforms. Because of this, a custom sensor was designed and developed to capture heart signals. The sensor includes a standard stethoscope chest piece to amplify acoustic signals and an electret condenser microphone to convert the amplified signals to electrical waveforms. A microphone with a 20 Hz – 20 kHz frequency range was selected in order to capture all of the low frequencies characteristic of internal body sounds. The microphone was placed within a rubber tubing as close as possible to the base of the chest piece. In order to reduce noise and improve convenience, a 3.5 mm shielded cable was soldered to the leads of the microphone and pulled through the rubber tubing to interface with the MCU. Figure 3 shows an image of the constructed stethoscope sensor.
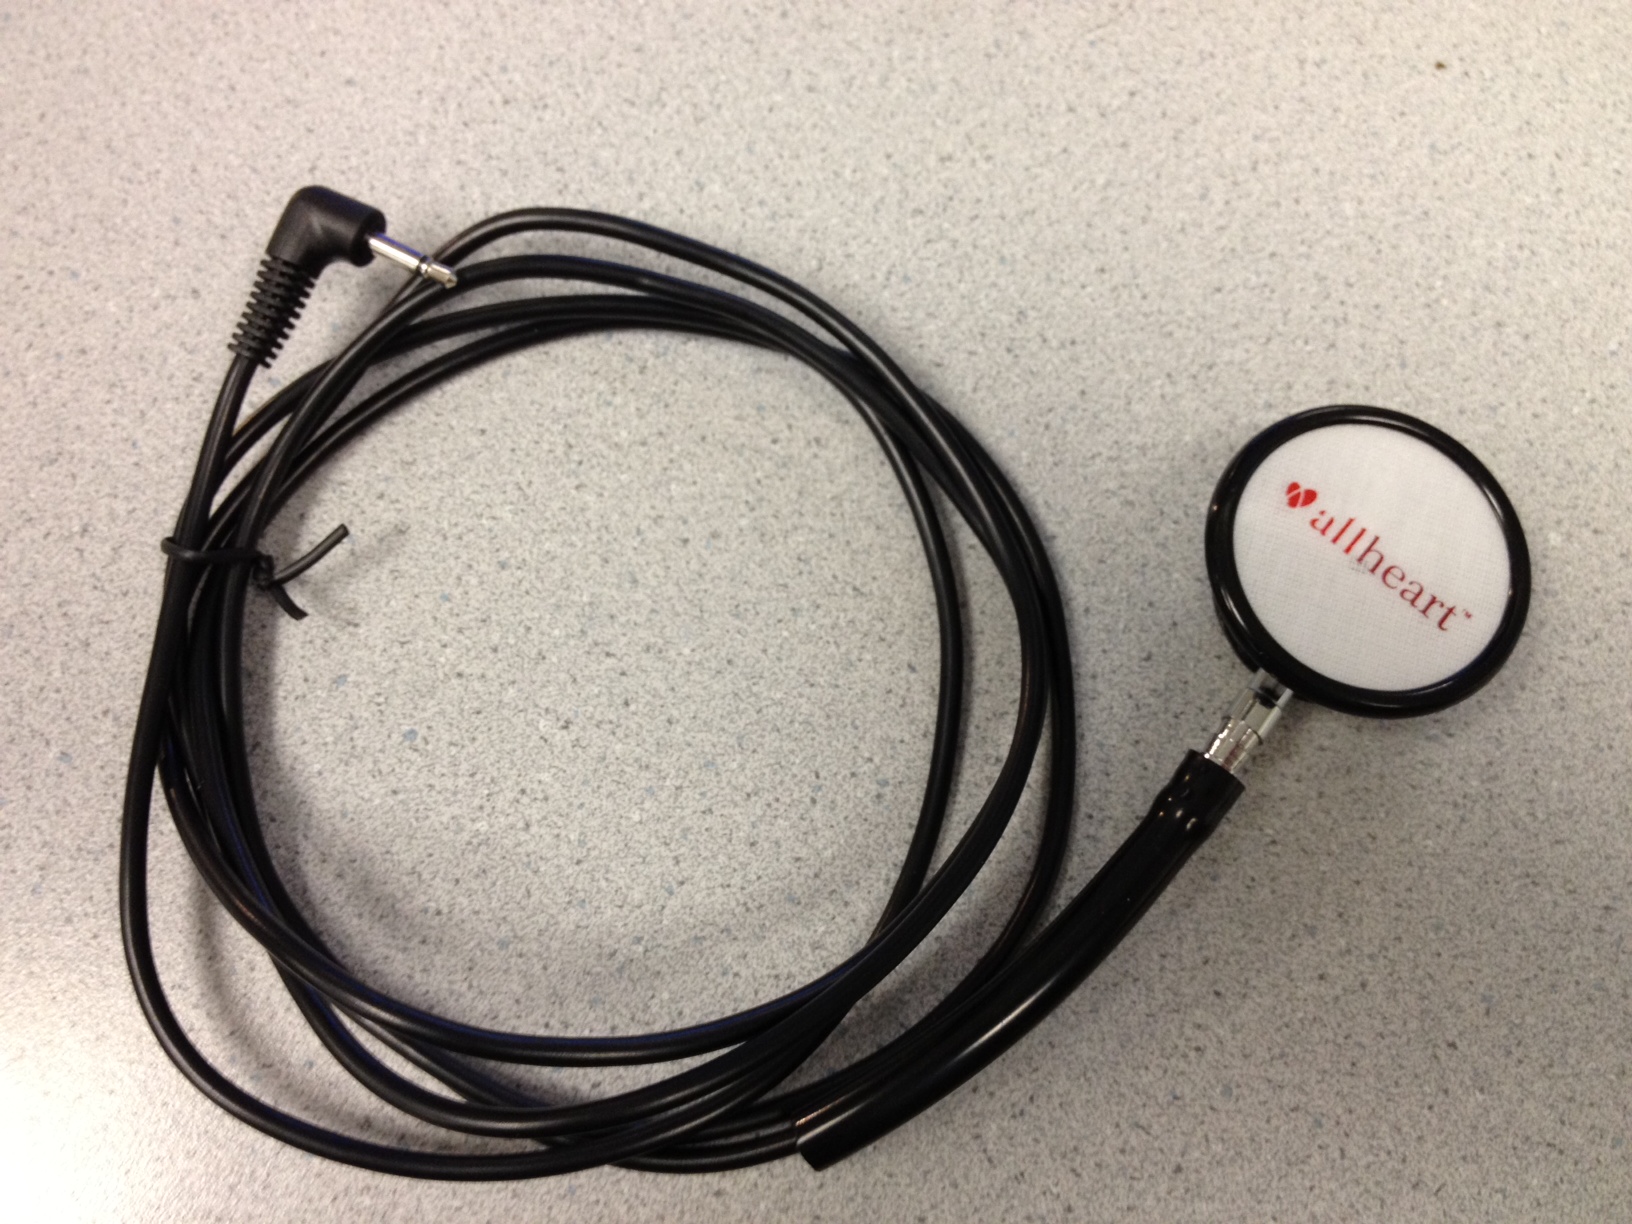
Figure 3. Stethoscope Acoustic Sensor
The sensor construction was tested by using a multimeter to detect shorts and to verify that proper connections were made. The actual sensing capability of the component was tested using the bias/amplifier circuit described in the next section.
Microphone Bias and Amplifier Circuit
The microphone in the acoustic sensor needed to be biased in order for proper operation. In addition, the output of the microphone is on the order of millivolts, which is relatively small in magnitude compared to the precision of the ADC sampling the sensor (the ADC has a precision of approximately 20 mV when taking 8-bit samples). This makes it challenging for the microcontroller to detect changes in sensor output. In order to address both these issues, a bias and amplifier circuit was designed and implemented to interface the raw sensor output with the MCU. The goal of the circuit was to properly bias the microphone and amplify the sensor output to detect voltage swings caused by sounds. The figure below shows a schematic of the completed circuit.
Figure 4. Microphone Bias and Amplifier Circuit
The typical operating range for the microphone was 2 V, with a maximum rating of 10 V. The MCU provided a voltage of 5 V, so a simple voltage divider circuit with identical 1k resistors was used to reduce the voltage to 2.5 V to bias the microphone. The output of the microphone was passed through a capacitor to remove the DC offset. The capacitor used was large enough to make sure that the desired low frequencies were not filtered out. With two 1k resistors in parallel with the output of the microphone, the equivalent output impedance of the sensor is roughly 400 ohms. Using a 10 uF capacitor, a simple high pass filter with a cutoff frequency around 40 Hz was designed, which is below most of the low frequencies of interest.
The AC-coupled signal was connected to the positive input (Vin+) of an operational amplifier to boost the signal amplitude. Because the microcontroller ADC measures voltages between 0 and 5 V, the Vin+ line of the op-amp was biased to 2.5 V in order to capture the largest magnitude of positive and negative swings from the microphone output. This biasing was implemented with another voltage divider circuit using identical 20k resistors. The values of these resistors were chosen to be larger than the resistors in the previous voltage divider in order to avoid affecting the equivalent output impedance of the previous stage.
For signal amplification, a non-inverting op-amp configuration was used. The gain of the circuit is defined by the following equation:
The resistors were selected to achieve an ideal gain of 150 for frequencies between the range of 20 Hz and 2 kHz. The gain was selected based on the 300 kHz gain-bandwidth product constraint of the op-amp. *Note: the resistor R6 was implemented in hardware as a variable resistor (10k trimpot) in order to allow for more convenient prototyping and testing. A capacitor was added in series with resistor R6 in the op-amp feedback loop to create a system with unity gain for DC voltage inputs. The unity gain at DC is important to prevent amplification of the 2.5 V bias at the Vin+ node. Without this additional capacitor, the output of the amplifier would saturate to 5 V when the microphone did not detect any sounds. A 10 uF capacitor was selected for C1 in order to achieve a high pass filter cutoff of approximately 2 Hz, which is close to DC in order to pass all non-DC signals. On the other hand, a 500 pF capacitor was selected for C5 in parallel with a 1M resistor in order to create a low-pass filter with a cutoff frequency of approximately 300 Hz. With all of these basic hardware filter realizations, the effective frequency range of the filtered output signal is between 40 – 300 Hz.
For stability, 0.1 uF decoupling capacitors were added in parallel to the Vcc and Gnd nodes of the op-amp. And to protect the ADC pin on the MCU, protective diodes and a 10k series resistor were added to the circuit.
The amplifier circuitry was thoroughly tested after it was built on the breadboard. A function generator was connected to the input of the circuit and frequencies were manually swept to test and verify the circuit’s frequency response. The following table and plot shows the measured frequency response of the microphone circuit:
Microphone Circuit Frequency Response Results
| Input Frequency (Hz) | Input Peak-to-Peak (mV) | Output Peak-to-Peak (mV) | Gain (abs) | Gain (dB) |
|---|---|---|---|---|
| 20 | 2.08 | 272 | 130.77 | 42.33 |
| 50 | 2.08 | 272 | 130.77 | 42.33 |
| 100 | 2.08 | 264 | 126.92 | 42.07 |
| 150 | 2.08 | 248 | 119.23 | 41.53 |
| 200 | 2.08 | 232 | 111.54 | 40.95 |
| 250 | 2.08 | 216 | 103.85 | 40.32 |
| 300 | 2.08 | 200 | 96.15 | 39.66 |
| 500 | 2.08 | 152 | 73.08 | 37.28 |
| 1000 | 2.08 | 88 | 42.31 | 32.53 |
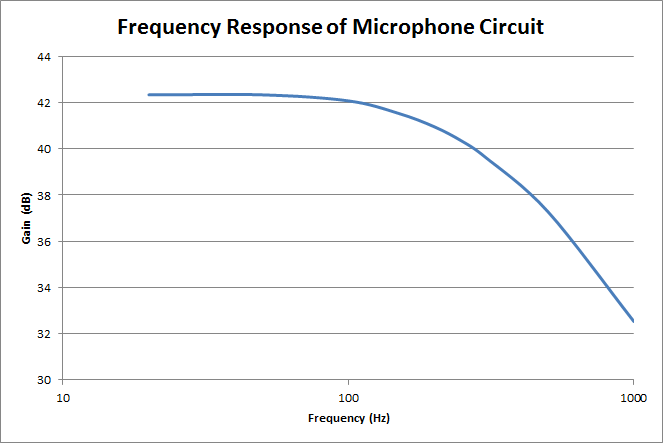
Figure 5. Microphone Circuit Frequency Response
The measured data shows that there is approximately a 3dB drop in gain at the 300 Hz cutoff frequency. This shows that the implementation of the low pass filter properly attenuates high frequency signals. After verifying that the frequency response of the circuit was as expected, the acoustic sensor was tested by connecting it to the input of the bias/amplifier circuit.
Digital-to-Analog Converter
In order to output the real-time or recorded audio waveform to a headphone/speaker, a simple digital-to-analog converter was implemented in the form of an RC low-pass filter. This circuit averages a pulse-width modulated input signal in addition to attenuating high frequency content. Figure 6 shows a schematic of the DAC circuit.
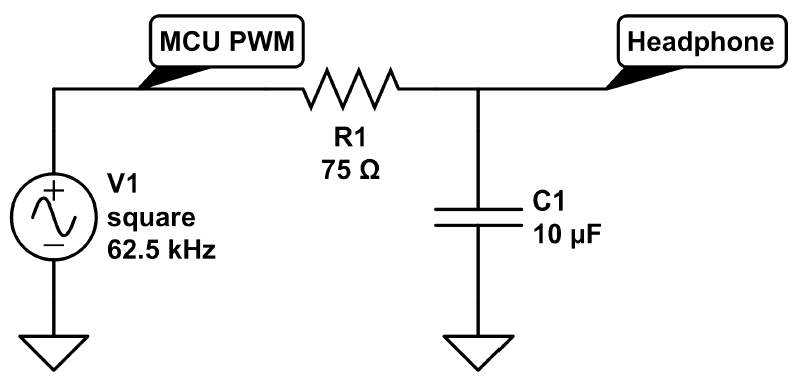
Figure 6. Digital-to-Analog Circuit for Audio Output
The RC time constant of the filter was designed to attenuate frequencies higher than approximately 210 Hz. This cutoff frequency is below the frequency range of the input signal to the MCU. The circuit was designed this way in order to reduce higher frequency noise introduced to the signal at the PWM output. A relatively small resistor value was chosen for the circuit in order to interface with low input impedance headphones.
The circuit was tested and validated using the stethoscope sensor and amplifier circuit after the software to capture the stethoscope output and generate the PWM signal was developed. The figure below shows the PWM signal and corresponding analog signal captured on an oscilloscope.
Flash Memory
A 1MB Flash memory chip was acquired to provide the capacity to store up to 10 cardiac waveforms for future playback and analysis. Since the chip requires a supply voltage between 2.7 V and 3.6 V, a power regulator was used to convert the 5 V supply powering the rest of the circuit to a stable 3.3 V supply for the memory. The microcontroller communicated with the Flash chip through a serial peripheral interface (SPI), with the MCU as the master and the Flash chip as the slave device. The SPI bus specifies four logic lines: serial clock (SCLK), master output (MOSI), master input (MISO), and slave select (SS). The SCLK, MOSI, and SS lines are outputted by the MCU and therefore require level shifting from 5 V to approximately 3.3 V. The MISO line is outputted by the Flash memory and does not require any voltage translation to interface with the MCU. This is because the 3.3 V output of the memory is within the lower bound to detect an input high voltage on the I/O pin. Figure 7 shows a schematic of the flash memory circuit.
Figure 7. Flash Memory and Voltage Regulator Circuits
Voltage translation was implemented using simple resistive dividers. The values of the resistors were selected to be small in order to reduce the RC time constant of the translation. This was necessary in order to cleanly level shift the high frequency clock signal without distortion.
To test the read functionality of the Flash memory, a short segment of code was written to send a command from the microcontroller to read the memory chip manufacturer’s ID. To test the erase and write functionalities, a sector erase followed by a page write command were sent to the chip to store data. A data read command was then issued to verify that the contents of the memory were correct.
Keypad and LCD
A 16-button keypad and 4-line 20-character wide LCD display were used for the primary user interface of the system. The two components were directly connected to I/O pins on the microcontroller and did not require any extra hardware circuitry for operation.
Software Design & Implementation
The overall software for the project consisted of embedded code running on the Atmega644 microcontroller and a MATLAB visualization tool on a PC.
ATmega644 Microcontroller
The microcontroller served as the central system component. The software running on the microcontroller was responsible for sampling the stethoscope sensor output, generating a PWM signal for audio playback, adjusting the volume of the audio output, storing the acquired data in Flash memory for later playback, and transmitting data to the MATLAB visualization tool. Figure 8 shows an overview of the software system architecture.
Figure 8. System Software High Level Overview
Signal Acquisition
The ADC module was used to convert the analog electrical signal from the output of the sensor circuit into a digital signal that the microcontroller can process. The voltage reference for the ADC module was set to 5 V. The system clock running at 16 MHz was divided by 32 to drive the ADC at a frequency of 500 kHz. The Timer 1 Capture ISR was used to sample the ADC at 8 kHz with 8-bit precision. Although the frequency content of most internal body sounds are relatively low (< 300 Hz), a higher sampling rate was used to improve the audio quality of the acquired signal. *Note: the minimum sampling rate needed to reconstruct a 300 Hz signal without aliasing is 600 Hz based on the Nyquist sampling theorem. Within the ISR, the sampled data is then scaled based on the current volume settings and written to a flash buffer in the MCU if the system is in capture mode.
PWM Waveform Generation and Serial Data Transfer
Cardiac waveforms were played in real time and from previous recordings by generating a PWM signal using the sampled data from the ADC. A 62.5 kHz PWM output was produced using Timer 2. The magnitude of the output is updated within the Timer 1 Capture ISR at the same 8 kHz sampling rate based on the sampled or recorded data. In addition to outputting the audio data to headphones/speakers, the data is also transmitted to a MATLAB visualization tool via the USART module at 100 Hz. Since the serial transfer task is non-critical, the data is only written to a serial transfer buffer within the Timer 1 ISR. The actual transmission of the data using the USART is performed within the main loop based on system and task times updated using the Timer 0 Compare ISR.
Flash Operations
The software interface with the Flash memory chip utilized the SPI hardware module in the microcontroller. To send a command via SPI, the slave select line was first enabled. The desired transmit data was then written to the SPI data register, which outputs the clock signal on the SCLK line and shifts the data bits (MSB first) out onto the MOSI line. After sending all data bytes, the slave select line was disabled to execute the command in the memory. *Note: SPI communication is full-duplex. As each bit is shifted out onto the MOSI line, a new bit is shifted in from the MISO line. Because of this, dummy data can be sent from the master in order to receive data from the slave. The table below lists the major Flash commands used to read, erase, and write data to the chip.
| Command | Instruction Code | Description |
|---|---|---|
| Page Program | 0x02 | Program up to 256 bytes of data at erased locations |
| Read Data | 0x03 | Read 1 or more bytes of data sequentially |
| Read Status Register-1 | 0x05 | Reads the 8-bit status register-1 |
| Write Enable | 0x06 | Must be executed before writing or erasing data |
| Sector Erase | 0x20 | Erases a 4KB sector of memory |
| Read Manufacturer ID | 0x90 | Reads the manufacturer ID of the chip |
| Chip Erase | 0xC7 | Erases the entire Flash memory |
| Block Erase (64 KB) | 0xD8 | Erases a 64 KB block of memory |
Flash Commands
Writing Acquired Data
In order to minimize SPI communication overhead, captured signal data is first written to a Flash write buffer in the Timer 1 ISR. An SPI page program command is only sent after 256 bytes of data have been collected in the buffer. Each audio recording is allocated 64KB of memory, which corresponds to approximately 8 seconds of recording data when sampling at 8 kHz. This size was chosen in order to fit all of the data within a single block.
Reading Recorded Data
In order to playback recorded data, it is necessary to read data from the Flash memory. This is done one page at a time using two Flash read buffers in the MCU. The playback data is first initialized by reading two pages of data and storing it in the read buffers. The data in the buffers are then output at 8 kHz using the PWM. After a full page of data has been output to the headphones, the second buffer is used to continue the operation. When the buffer switches, a Flash read command is issued to re-populate the original buffer. This process continues until all 64KB of data has been read from memory and outputted to the headphones.
Managing Recording Data
The digital stethoscope system supports saving up to 10 different waveform recordings. Each recording is assigned an ID between 0 and 9. Each recording is also allocated a separate 64KB block of Flash memory. A special 16-bit location in Flash memory is interpreted as a recording status register, which indicates which recordings are valid and stored in memory. This is done through a simple one-hot encoding scheme where the recording ID corresponds to the bit position in the register. For instance, if bit 3 in the recording register is set to 1, then that means that recording 3 is stored in the Flash memory at its specific block address. If the bit value is set to 0, then the recording is not stored in memory.
When initializing the system on power-up, the MCU reads a special “signature” memory address to identify whether the project signature has been written to the chip. The signature indicates that the Flash memory has been properly formatted and the data in the recording status register is valid. If the signature is not found, the chip is erased and the recording status register is programmed to have a value of 0x0000, which indicates that no recording data is stored on the chip.
Keypad and LCD Operation
The primary user interface for controlling the microcontroller consisted of the keypad and the LCD display. The keypad was used to toggle between several modes of operation to record cardiac waveforms, play them back, and adjust the volume settings. The LCD was used to display instructions and visually see that the system was setting parameters and switching between operating modes as expected. The microcontroller software was thus responsible for the operation of these two hardware components, periodically checking the state of the keypad, de-bouncing button presses, and updating the messages displayed on the LCD.
When a button on the keypad is pressed, two of the eight pins get shorted. A piece of code that collected the values of each of the pins in a single number and mapped the result to a number between 1 and 16 was provided. This value corresponded to index of the button in the 4x4 array of buttons. For example, button A was mapped to a numerical value of 4. This value (butnum) was used in the de-bounce state machine for the system (see Figure 3). If the value was anything other than zero, the system would jump from the default RELEASED_STATE to the MAYBE_PUSH_STATE. If the same button is still pressed (and the value of butnum is not zero), the system jumps to the PUSHED_STATE. If the same button is released, the system goes to the MAYBE_REL_STATE before jumping to the RELEASED_STATE and setting a tag to indicate that a button was pressed and released. The button verication and de-bounce code is executed every 30 ms. The value of butnum was mapped to the actual numerical values 0-9 if one of those buttons was pressed. The buttons corresponding to the asterisk (*), pound symbol (#), and the letters were mapped to 11-15 in that respective order. These mappings were stored in the global variable keynumber and were used to evaluate button actions. Figure 9 below demonstrates the state machine used to de-bounce a button press.
Figure 9. Keypad De-bounce State Machine
The system used several states to differentiate between when a user could specify a setting and when an input wouldn't be registered. In the default state, the system sampled the stethoscope sensor output, outputted the PWM audio signal, and transmitted the data to the PC in real time. Numbers were used to enter various modes of operation. The asterisk and pound keys served the purpose of clearing or entering previously pressed characters.
When a user selected “1” and pressed the pound symbol, the system would enter a recording mode. The user would enter “A” to start a recording and “B” to end it. After a recording is stopped, the user was given the option to play the recording, delete it, or store the sample to Flash memory for later playback. A confirmation message is then displayed based the user input and the system will return to the default state when “D” is entered. The user could play a previously recorded sample by entering “2” to enter playback mode when the system was in the default state. The user could then press the number corresponding to one of the saved waveforms to play the previously recorded sample. The volume could be adjusted by entering “3” in the default state to enter a volume selection mode and entering a number in the range between “0” and “4”. The lowest setting disables the audio output entirely while the highest one double the amplitude of the voltage swings from their default values to produce a sound that is twice as loud as the default one. The current volume setting and the number of waveforms stored could be displayed on the LCD screen by selecting “4” in the default mode. The table below conveys the button functions in each mode.
| Mode | Button | Function |
|---|---|---|
| Default | 1 | Enter Pre-Recording Mode |
| 2 | Enter Pre-Playback Mode | |
| 3 | Enter Volume Select Mode | |
| 4 | Enter Settings | |
| 5 | Enter Flash Utility Mode | |
| Pre-Recording | A | Start Recording |
| D | Return to Default Mode | |
| Post-Recording | A | Delete Saved Waveform |
| B | Play Saved Waveform | |
| Delete | Any | Return to Default Mode |
| Pre-Playback | 0-9 | Play Saved Waveform |
| Post-Playback | A | Delete Saved Waveform |
| B | Play Saved Waveform | |
| D | Return to Default Mode | |
| Volume Select | 0-9 | Set Volume Level |
| Settings | D | Return to Default Mode |
| Flash Utility | A | Erase Flash Memory |
| D | Return to Default Mode | |
Keypad Button Functions
MATLAB User Interface
A MATLAB program was developed to read data from the microcontroller through a serial connection with a baud rate of 9600 bits per second. The connection port was periodically queried and read. The received data was then processed and displayed on a MATLAB plot in real time. The program was also designed to calculate the beats-per-minute (BPM) of a cardiac waveform in real time as well. An average of a cardiac waveform was taken to filter out ambient noise and detect when voltage spikes from heartbeats in a clean fashion. The average calculation was non-linear, intended to increase drastically at the start of a heartbeat and gradually decay until the next one. The first and second derivatives of the average were taken to determine where those steep spikes occur and thus, record the start time for each heartbeat. By calculating the difference between consecutive start times, it was possible to measure the time for a single heartbeat and to calculate BPM.
Results
Overall, the digital stethoscope system performed well in terms of audio quality, heart rate detection accuracy, and meeting real-time deadlines. The system successfully captured the heartbeat of various volunteers. The sound of the heartbeat was easily heard using standard headphones, indicating that the PWM audio output of the captured waveform was not significantly distorted by ambient noise. However, the audio became much noisier when a waveform was being recorded to the Flash memory and being subsequently played back.
The MATLAB user interface also met expectations, displaying cardiac waveforms in real time and when a stored waveform was played back as illustrated in the figure below. Several people were tested using the stethoscope to determine the accuracy of the BPM measurement algorithm. After obtaining a measurement using the digital stethoscope, the volunteers also determined their heart rate by holding two fingers to their necks and recording the number of seconds required for 10 heart beats. The results are included in the table below. The largest error between the two measurement techniques for the samples taken was around 6%, suggesting that the BPM measurements displayed on the plot were fairly accurate. It should be noted that there is a degree of uncertainty in measuring heart rate using the method with two fingers.
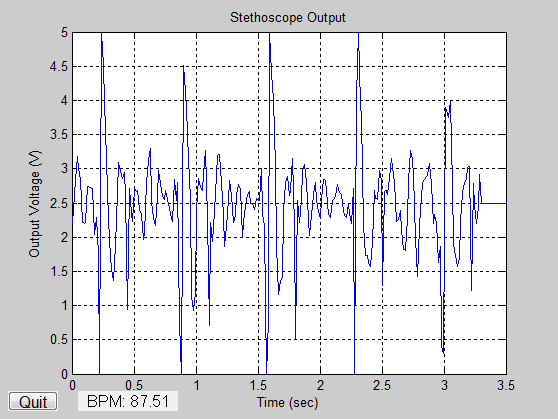
Figure 10. Cardiac Waveform Captured in MATLAB
| Volunteer | Hand Calculation (BPM) | MATLAB Algorithm (BPM) | Percentage Difference |
|---|---|---|---|
| Michael Wu | 82.7 | 83.3 | 0.76 |
| Garen Der-Khachadourian | 82.2 | 86.8 | 5.60 |
| Stephanie Stoughton | 71.4 | 72.6 | 1.68 |
| Stephen Wu | 64.5 | 67.8 | 5.12 |
Heart Rate Measurements
In terms of real-time performance, the software was able to meet the key timing requirements. The most important real-time constraint was the Timer 1 Compare ISR execution speed. The Timer 1 ISR was used to capture and playback audio samples at 8 kHz. In addition, the ISR was also responsible for writing and reading data from the Flash buffers. If the ISR takes too many CPU cycles and interrupts are missed, then the quality of the recording and playback of the audio signal would be reduced. Using simple software profiling, the CPU utilization of the Timer 1 ISR was measured under various conditions. During idle mode when the system samples the acoustic sensor and outputs it to the headphones, the CPU utilization of Timer 1 is approximately 24.75%. During capture mode when the system also stores the sampled data to the Flash write buffer, the utilization is 28.5%. And finally, when the system is in playback mode and reads data from the Flash read buffers to output the recorded sample, the utilization is 5.85%. These values indicate that real-time deadlines are being met, since the only other interrupt service routine is small and only responsible for updating the system and task times.
Since the goal of the project was to develop a system that users would interact with, safety was an important consideration. After the hardware components were prototyped and tested on a breadboard, the circuitry was implemented on a solder board to reduce wire lengths and establish permanent connections. Each hardware feature was then installed into the box enclosure. As a result, the electrical components are protected and the user is able to safely use the system.
Usability was another key consideration during the design process. One of the objectives of the project was to create a fully functional device that a user could easily operate. The keypad and LCD interface provided a user-friendly means to input commands and control the operation of the system. The MATLAB user interface intuitively displayed cardiac waveforms to assist auscultation. A 3.5 mm audio cable was used for the microphone to easily plug the stethoscope sensor into a standard jack, minimizing the wiring of the circuit and providing a clean way for the user to plug the device into the system. The stethoscope chest piece was integrated into the sensor for both functional and aesthetic purposes. The hardware components were embedded to the box to hold the final product in a simple container and provide a friendly interface for the user to plug in the peripheral components. Furthermore, a 9 V battery was included in the system to allow the user to run the system without the need for an external 9 V DC supply. For these reasons, the system’s portability is significant feature that enhances its usability.
Conclusions
Final Thoughts
The completed digital stethoscope system was able to able to meet the various goals of the project. The system is able to perform the following key features:
1. Capture a cardiac signal using a custom-built acoustic sensor and an analog-to-digital converter
2. Output a real-time audio signal based on the sampled input using a digital-to-analog converter
3. Record and playback captured signals using external Flash memory
4. Transmit real-time and recorded serial data via the USART for visualization and analysis
2. Output a real-time audio signal based on the sampled input using a digital-to-analog converter
3. Record and playback captured signals using external Flash memory
4. Transmit real-time and recorded serial data via the USART for visualization and analysis
Although the system meets all of the basic requirements, there is still room for future improvement and optimization. One critical challenge is to identify and remove the noise that pollutes the audio output signal during reading and writing of the Flash memory. This would greatly improve the quality of the recordings that are saved to Flash. For additional features, implementing the MATLAB heart rate detection algorithm in the microcontroller software would be valuable to move the system towards a completely embedded solution. Another useful feature of the stethoscope would be an implementation of software FIR filters to allow users to filter out specific frequency ranges.
In addition to these improvements, a significant extension to this project would be to research and implement an algorithm to detect and classify cardiac murmurs based on the captured waveform data. With a quick online search, it is clear that digital stethoscope systems are commercially available to physicians and other healthcare specialists. However, most of these products do not offer any built-in CAD features to help improve diagnostic abilities. As the computational performance of microcontrollers increase, it is becoming possible for effective CAD applications to be developed for embedded systems. A digital stethoscope with embedded CAD features could help identify cardiac murmurs and other heart conditions, eliminating the need for separate imaging procedures (e.g. echocardiography) for diagnosis.
Intellectual Property Considerations
Several resources were used as references in this project. Bruce Land's keypad de-bounce and LCD display software proved useful in implementing the user interface for the application. Online resources were referenced to implement the MATLAB user interface as well. Each reference is appropriately documented and acknowledged in the References section. There is no intention to pursue the acquisition of a patent for this project. Several patents already exist for digital or electronic stethoscopes. This project was intended as a proof-of-concept.
Legal and Ethical Considerations
The hardware and software design decisions made throughout the project followed the IEEE Code of Ethics. Precautions were taken to ensure that no one was subjected to a situation that involved physical risk and all hardware components were soldered and wired carefully. Assistance was requested when obstacles were encountered during the design process. The design is intended for use and does not cause harm to the patient. Individuals who volunteered for auscultation verbally consented to participate in the process.
Appendices
A. Source Code
Source files
- lab5_stethoscope.c (36KB) – microcontroller software used to control signal acquisition, PWM waveform generation, and keypad/LCD display operation
- flash.c (4KB) – microcontroller software used to control cardiac waveform recording and playback
- uart.c (5KB) – Bruce Land's UART code
- lcd_lib.c (9KB) – Bruce Land's LCD library code
- realtime.m (6KB) – MATLAB virtualization software
Header files
- lab5_stethoscope.h (6KB) – contains global variables, definitions, and function prototypes
- flash.h (2KB) – contains Flash function prototypes
- uart.h (1KB) – contains UART function prototypes
- lcd_lib.h (5KB) – contains LCD display prototypes
Download all files: software.zip (20KB)
B. Bill of Materials
| Component | Part # | Quantity | Vendor | Cost |
|---|---|---|---|---|
| 3.5mm Cable | CP-2206-ND | 1 | Digikey | $3.09 |
| Condenser Microphone | P9955-ND | 1 | Digikey | $2.22 |
| Flash Memory (1 MB) | W25Q80BVDAIG-ND | 1 | Digikey | $1.39 |
| Operational Amplifier | MCP6231-E/P-ND | 1 | Digikey | $0.38 |
| Stethoscope | AH-DST0201 | 1 | Allheart.com | $6.98 |
| Plastic Box (Clear Blue) | N/A | 1 | Michael's | $3.00 |
| Max233CPP | N/A | 1 | ECE 4760 Lab | $7.00 |
| ATmega644 | N/A | 1 | ECE 4760 Lab | $6.00 |
| Keypad | N/A | 1 | ECE 4760 Lab | $6.00 |
| Custom PC Board | N/A | 1 | ECE 4760 Lab | $4.00 |
| Solder board (6 inch) | N/A | 1 | ECE 4760 Lab | $2.50 |
| Small solder board (2 inch) | N/A | 1 | ECE 4760 Lab | $1.00 |
| Voltage Regulator (3.3V) | N/A | 1 | ECE 4760 Lab | $0.00 |
| Resistors | N/A | Many | ECE 4760 Lab | $0.00 |
| Capacitors | N/A | Many | ECE 4760 Lab | $0.00 |
| Diodes | N/A | 2 | ECE 4760 Lab | $0.00 |
| LCD Display | N/A | 1 | Previously Owned | $0.00 |
| Switch | N/A | 1 | Previously Owned | $0.00 |
| Voltage Regulator (5V) | N/A | 1 | Previously Owned | $0.00 |
| 9V Battery | N/A | 1 | Previously Owned | $0.00 |
| Total: | $43.56 |
C. Tasks
| Michael Wu | Garen Der-Khachadourian |
|---|---|
| Hardware wiring | MATLAB user interface |
| Stethoscope capture, record, playback code | Keypad/LCD Display code |
| Flash memory programming | Webpage formatting |
The other aspects of the project were completed as a group. These tasks include: building the protoboard, integrating the hardware into the box, and testing the hardware and software components.

Block diagram of the designed wireless electronic esophageal stethoscope
Transmitter
The transmitter acquires, filters, amplifies and wirelessly sends the heart sound and lung sound data to the receiver. The schematic circuit of the transmitter is shown in . The sound is captured by a microphone connected to an esophageal catheter. A microphone with a 20 Hz to 20 KHz frequency range was selected to capture all the frequency characteristics of the heart and lung sound.

Transmitter circuit diagram of the designed wireless electronic esophageal stethoscope
The signal from the microphone is contaminated by noise and is very feeble too. Sources of noise are background noise and power line noise. Interference and low amplitude of the acquired signal may cause difficult for the anesthesiologist to differentiate every sound. Therefore, low pass filter with cut off frequency of around 27 KHz is used to reduce the effect of noise and a pre-amplifier is employed to increase the input signal amplitude by a gain factor of 50. The pre-amplifiers provide initial amplification and better noise rejection. The designed pre- amplifier is also an active low-pass filter that boosts signals and enhances the signal-to- noise ratio of the captured signal simultaneously.
The output signal from the pre-amplifier is amplified by an amplifier and a power amplifier to supply the necessary power to drive the headphones and for further processing. This amplifier has a variable gain that helps adjusting the amplitude of the signal for the correct analysis.
As discussed, the main objective of this work was to design a system that can be used for observing inaccessible patients during CT scan. For this purpose, the system wirelessly sends the acquired signals (heart and breath sounds) to a receiver if needed. The output of the pre-amplifier is band-pass filtered and then is delivered to the frequency modulation (FM) unit and radio frequency (RF) amplifier. The output of the RF amplifier is then sent to the receiver via an antenna. The transmission frequency range of the transmitter is 2400 to 2483 MHz. If the receiver is not receiving signal correctly, the transmission frequency can be adjusted using three DIP switches to get a desirable signal.
Receiver
The receiver processes and delivers the heart sound data to a head phone. shows the schematic circuit of the receiver system. As shown the hardware design of the receiver consists of an RF amplifier, a demodulator, a low-pass filter and an audio amplifier. The received signal may be feeble, contaminated by the background noise. Therefore, the signal is amplified using a RF amplifier and then is filtered using a simple RC low filter (R5 and C1 ). The filtered output signal is boosted by a digitally controlled programmable gain power amplifier to pick up this signal and helps drive the sound for a head phone. On Figure 3 this power amplifier consists of U1, U2 and U3.

Schematic diagram of the receiver of the designed wireless electronic esophageal stethoscope
Results and Discussion
The designed transmitter and recivear circuit was frist evalued using a computer simulation via PsPice software and then fabricted and tested in real world. The parts were delicately transferred to a designed printed circuit board (PCB) shown . The overall montaged system is shown .

The designed printed circuit board (i.e.,PCB) for transmitter (top) and the receiver (bottom) of the developed wireless electronic esophageal stethoscope.

The transmitter (top) and receiver (bottom) of developed wireless electronic esophageal stethoscope.
An example signals recorded using the designed instrument is shown in . As show, both heart and lung sounds were captured and amplified with clear audibility such that proper auscultation is possible that means the instrument be an effective and suitable device for observing inaccessible patients in several conditions such as during CT scan.
+++++++++++++++++++++++++++++++++++++++++++++++++++++++++++++++++
e- IC Stethoscope (electronic- Instrument and Control Stethoscope )

+++++++++++++++++++++++++++++++++++++++++++++++++++++++++++++++++
Did you check my new article how long does it take for an apple tree to bear fruit : I desire you may adore it :)
BalasHapusHi, Such a well written article, If we talk about stethoscope then i am sure that Littmann Stethoscope uk is the bes brand to choose.
BalasHapusThanks for sharing nice information about head heart lung cardiology stethoscope with us. i glad to read this post.
BalasHapus