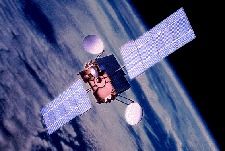


Earth observation satellite

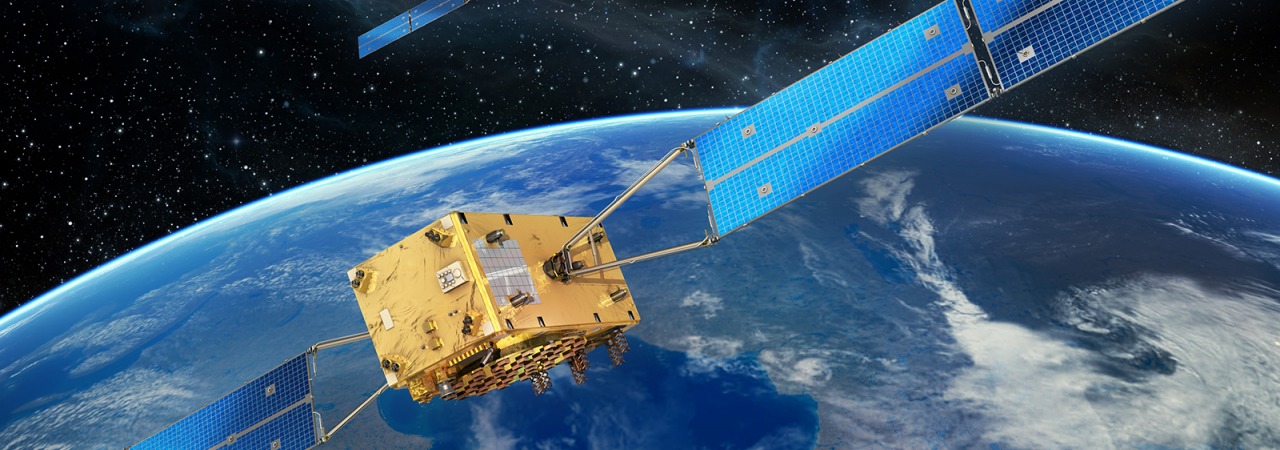
Most Earth observation satellites carry instruments that should be operated at a relatively low altitude. Altitudes below 500-600 kilometers are in general avoided, though, because of the significant air-drag at such low altitudes making frequent orbit reboost maneuvres necessary. The Earth observation satellites ERS-1, ERS-2 and Envisat of European Space Agency as well as the MetOp spacecraft of EUMETSAT are all operated at altitudes of about 800 km. The Proba-1, Proba-2 and SMOS spacecraft of European Space Agency are observing the Earth from an altitude of about 700 km. The Earth observation satellites of UAE, DubaiSat-1 & DubaiSat-2 are also placed in Low Earth Orbits (LEO) orbits and providing satellite imagery of various parts of the Earth.
To get (nearly) global coverage with a low orbit it must be a polar orbit or nearly so. A low orbit will have an orbital period of roughly 100 minutes and the Earth will rotate around its polar axis with about 25 deg between successive orbits, with the result that the ground track is shifted towards west with these 25 deg in longitude. Most are in sun-synchronous orbits.
Spacecraft carrying instruments for which an altitude of 36000 km is suitable sometimes use a geostationary orbit. Such an orbit allows uninterrupted coverage of more than 1/3 of the Earth. Three geostationary spacecraft at longitudes separated with 120 deg can cover the whole Earth except the extreme polar regions. This type of orbit is mainly used for meteorological satellites.
Weather

A weather satellite is a type of satellite that is primarily used to monitor the weather and climate of the Earth.[7] These meteorological satellites, however, see more than clouds and cloud systems. City lights, fires, effects of pollution, auroras, sand and dust storms, snow cover, ice mapping, boundaries of ocean currents, energy flows, etc., are other types of environmental information collected using weather satellites.
Weather satellite images helped in monitoring the volcanic ash cloud from Mount St. Helens and activity from other volcanoes such as Mount Etna.[8] Smoke from fires
Environmental monitoring

Other environmental satellites can assist environmental monitoring by detecting changes in the Earth's vegetation, atmospheric trace gas content, sea state, ocean color, and ice fields. By monitoring vegetation changes over time, droughts can be monitored by comparing the current vegetation state to its long term average.[9] For example, the 2002 oil spill off the northwest coast of Spain was watched carefully by the European ENVISAT, which, though not a weather satellite, flies an instrument (ASAR) which can see changes in the sea surface. Anthropogenic emissions can be monitored by evaluating data of tropospheric NO2 and SO2.
These types of satellites are almost always in Sun synchronous and "frozen" orbits. The Sun synchronous orbit is in general sufficiently close to polar to get the desired global coverage while the relatively constant geometry to the Sun mostly is an advantage for the instruments. The "frozen" orbit is selected as this is the closest to a circular orbit that is possible in the gravitational field of the Earth.
Mapping
Terrain can be mapped from space with the use of satellites, such as Radarsat-1 and TerraSAR-X.
XO__XO satellites : the sky has eyes
There are approximately 120 private companies in the world that operate about a third of the thousands of small, orbiting, uninhabited space vehicles commonly known as satellites; none of these companies are American. In the USA, the only entities that are allowed to own and operate satellites -- even if they are used to do scientific research, or to provide commercial services relating to communications, entertainment or weather forcecasting -- is the Department of Defense (DOD) or one of the USA's independent intelligence-gathering agencies: the Central Intelligence Agency (created in 1947), the National Security Agency (1952), the National Reconnaissance Organization (1960), or the National Imagery and Mapping Organization (1996). Foreign governments, private companies and scientific institutions must either pay a fee or enter into an exclusive information-sharing agreement (or both) if they want to get access to America's satellites.
In the other countries that have placed satellites in orbit (Russia, China, France, Japan, India, Canada and Israel), the military/intelligence satellites (if any) are kept separate from the commercial ones, and private companies can operate their own satellite systems. This makes sense from an operational point of view. With some exceptions, military satellites are designed to move in complex elliptical orbits around the earth, so that they can photograph very large areas of the surface (whole continents) and determine the locations of sources of certain microwave transmissions. Commercial satellites, by contrast, are "geo-stationary," that is, designed to stay "motionless" in orbit above or, rather, in between certain (limited or very specific) locations that can't be connected with cables (see diagram below).
The US military makes extensive use of both kinds of satellites. As might be expected, geo-stationary satellites are used to produce very detailed radar images or photographs of small, strategically important locations, and to gather signals intelligence about or intercept and eavesdrop upon certain transmissions. But the DOD also uses geo-stationary satellites to direct precision-guided weapons to their locations. The satellites do this by directing down to the surface a laser beam that can be detected, locked on to and then followed all the way down by bombs or missiles that have laser-readers installed in their cones. And so, these satellites aren't fully automated killers, unlike their "cousins," the the uninhabited aerial vehicles. But they're close, and will get even closer if self-avowed President George W. Bush succeeds in his effort to revive Ronald Reagan's "Star Wars" missile defense plan from the 1980s.
It is highly instructive that the very first American satellite was a "reconnaissance" (spy) satellite and that it was the product of an intense, behind-the-scenes competition between the DOD and the CIA, which are still in competition with each other. (Note the battle to see who will achieve "Total Information Awareness" first.) On February 7, 1958 -- three years after the Air Force had begun work on a satellite that would provide continuous surveillance of "pre-selected areas of the earth" in order "to determine the status of a potential enemy's war-making capability," and one year after the Soviets launched Sputnik, thereby beating the Americans into space -- President Dwight Eisenhower turned to the CIA and asked it to develop a reconnaissance satellite of its own. Unlike the Air Force's satellite program, which had tried unsuccessfully to produce a satellite that would use electronics to beam its photographs down to earth, the CIA's CORONA program concentrated on producing a satellite that would simply put its photographs into a canister that could be dropped down and recovered from wherever it landed.
To make sure that the DOD didn't feel slighted, on February 7, 1958 Eisenhower also created the Advanced Research Projects Agency (ARPA), which later became the Defense Advanced Research Projects Agency (DARPA). The DOD could also console itself with the fact that it still operated the Space Surveillance Network, which ever since 1957 has used ground-based radar and optical sensing equipment to detect, identify, track and catalogue all the artificial objects orbiting Earth, including satellites (both active and inactive), spent rocket bodies and other pieces of debris, even those as small as baseballs.
It took the CIA over a year and 14 separate launches before it finally managed to get an operational CORONA satellite placed in orbit. But Eisenhower deemed it worth the expense and the wait. In a single day, the satellite's Keyhole-1 camera -- which could "resolve" upon objects as small as 40 feet long -- photographed more of the Soviet Union than had been photographed over a period of years by all of the Air Force's U-2 spy planes put together.
In 1963, CORONA was supplemented by GAMBIT, a "close-look" or "spotting" satellite designed to target specifics areas. Thanks to its high-resolution Keyhole-7 camera, which could resolve upon objects as small as 18 inches long, GAMBIT was able to take photographs useful for detailed intelligence work, such as inspecting foreign weapons systems. After GAMBIT, the CIA developed HEXAGON, which could cover even more ground than CORONA and yet still resolve upon objects as small as 1 or 2 feet long. At the same time (the early 1970s), the Air Force developed the Defence Support Program, which placed a constellation of satellites in geostationary orbit around the Earth. Unlike their predecessors, these satellites contained infrared sensors as well as photographic cameras, which allowed them to work at night and/or despite the presence of heavy cloud cover.
According to the European Parliament and other researchers, the early 1970s was also the period in which the various American intelligence-gathering agencies -- trying to keep up with the satellite launches of the International Telecommunications Satellite Organization, formed in 1964 and capable of providing truly global coverage in 1968 -- developed the ECHELON system. Built upon a 1947 intelligence-sharing agreement between the USA, Canada, England, Australia and New Zealand, the ECHELON system uses immense ground-based listening stations (see picture below) to intercept and eavesdrop upon satellite-based communications. These listening stations are dispersed throughout the world, in such places as Yakima (Washington State, USA), Sugar Grove (West Virginia, USA), Menwith Hill (England), Hong Kong, Guam, Misawa Air Base (Japan), and Sabana Seca (Puerto Rico); they allow the English-speaking countries (the USA, mostly) to eavesdrop upon what the rest of the world is saying in their faxes, telexes and international telephone calls.

(Listening station in West Virginia, USA.)
By 1976, satellites such as CRYSTAL were finally able to do what Eisenhower wanted the Air Force's first satellites to do, namely, use electronic signals to relay images down to earth as soon as they are captured by the satellite's (Keyhole-11) cameras. But, despite their incredible sophistication, these space-to-earth transmissions -- like all wireless broadcasts -- were and still are vulnerable to interception.
In 1982, the Department of Defense starting launching the first of the 24 satellites that today enable the operation of the Global Positioning System (GPS). Because it is the subject of a vast and rapidly expanding literature, GPS has been taken up in a separate entry,
Wireless surveillance in England.
The camera is at lower left; the modulator is on the right; and the microwave "beamer" is at upper left.
There are several serious problems with using traditional coaxial or even high-tech fiber-optic cables to transmit video images from the surveillance cameras to the stations at which the images are monitored and/or recorded. Cables are easily damaged or severed by bad weather, birds, insects, accidents or saboteurs, and thus require nearly constant monitoring, maintanence and repair. Furthermore, cables cannot be strung over long distances without sacrificing image quality or having to build expensive booster stations along the way. The use of cable thus necessitates the close physical proximity of the monitoring stations to the areas under video surveillance. But proximity might be undesirable if the surveillance is intended to be covert or impossible if the subject of surveillance is constantly on the move.
To solve these problems, video surveillance has gone wireless. There are several means by which live video images can be transmitted without the use of cables or wires: lasers, radar signals and radio (all of which are "microwaves," differing only in frequency on the spectrum). The most commonly used microwave is radio-frequency ("radio" for short). Radio broadcasts intended to travel long distances usually make use of ground-based antennae or satellites that relay the signal from the transmitter to the receiver. Broadcasts intended to travel short distances are usually beamed "point-to-point," that is, directly from the transmitter to the receiver. (Unfortunately for the people who visit and work in the area, an example of a high-powered point-to-point system can be found right in the heart the New York City's Times Square.)
In England, whole towns are covered by complex networks of point-to-point systems. In this schematic, which explains the operation of the secure system in which the wireless surveillance camera depicted above is an element, note that the video-signal is first "modulated" (encrypted), then relayed through a "control room," at which it is "demodulated," then relayed through a "node," at which the signal is modulated again, before it finally reaches the police station, where it is (no doubt) finally unencrypted and watched and/or recorded.
In America, many law enforcement agencies use radio signals to transmit, relay and receive live video images. These agencies include the California Highway Patrol, the US Border Patrol and the the New York Police Department (NYPD). Their use of wireless cameras can either be covert or overt.
In covert operations ("stake-outs"), the cameras are usually small devices that beam their signals over short distances (usually to an unmarked van or car parked nearby) from hidden, semi-permanent locations on or near the suspects. In overt operations ("routine patrols"), the cameras are usually large devices that beam their signals over relatively long distances (back to headquarters or some other command-and-control center) from their mounts atop news-style vans or mobile command centers (usually buses). Overt wireless spy cameras can also be installed on helicopters, planes, unmanned aerial vehicles and satellites.
Whether used covertly or overtly, wireless video is a risky business for two reasons: 1) though such transmissions are often "modulated" or otherwise encrypted, they are nevertheless sent on "open," non-secured frequencies, and so can be intercepted and, given time, decoded; and 2) officers routinely stationed near the transmitters can suffer serious health problems if over-exposed to microwave radiation.
In the other countries that have placed satellites in orbit (Russia, China, France, Japan, India, Canada and Israel), the military/intelligence satellites (if any) are kept separate from the commercial ones, and private companies can operate their own satellite systems. This makes sense from an operational point of view. With some exceptions, military satellites are designed to move in complex elliptical orbits around the earth, so that they can photograph very large areas of the surface (whole continents) and determine the locations of sources of certain microwave transmissions. Commercial satellites, by contrast, are "geo-stationary," that is, designed to stay "motionless" in orbit above or, rather, in between certain (limited or very specific) locations that can't be connected with cables (see diagram below).
The US military makes extensive use of both kinds of satellites. As might be expected, geo-stationary satellites are used to produce very detailed radar images or photographs of small, strategically important locations, and to gather signals intelligence about or intercept and eavesdrop upon certain transmissions. But the DOD also uses geo-stationary satellites to direct precision-guided weapons to their locations. The satellites do this by directing down to the surface a laser beam that can be detected, locked on to and then followed all the way down by bombs or missiles that have laser-readers installed in their cones. And so, these satellites aren't fully automated killers, unlike their "cousins," the the uninhabited aerial vehicles. But they're close, and will get even closer if self-avowed President George W. Bush succeeds in his effort to revive Ronald Reagan's "Star Wars" missile defense plan from the 1980s.
It is highly instructive that the very first American satellite was a "reconnaissance" (spy) satellite and that it was the product of an intense, behind-the-scenes competition between the DOD and the CIA, which are still in competition with each other. (Note the battle to see who will achieve "Total Information Awareness" first.) On February 7, 1958 -- three years after the Air Force had begun work on a satellite that would provide continuous surveillance of "pre-selected areas of the earth" in order "to determine the status of a potential enemy's war-making capability," and one year after the Soviets launched Sputnik, thereby beating the Americans into space -- President Dwight Eisenhower turned to the CIA and asked it to develop a reconnaissance satellite of its own. Unlike the Air Force's satellite program, which had tried unsuccessfully to produce a satellite that would use electronics to beam its photographs down to earth, the CIA's CORONA program concentrated on producing a satellite that would simply put its photographs into a canister that could be dropped down and recovered from wherever it landed.
To make sure that the DOD didn't feel slighted, on February 7, 1958 Eisenhower also created the Advanced Research Projects Agency (ARPA), which later became the Defense Advanced Research Projects Agency (DARPA). The DOD could also console itself with the fact that it still operated the Space Surveillance Network, which ever since 1957 has used ground-based radar and optical sensing equipment to detect, identify, track and catalogue all the artificial objects orbiting Earth, including satellites (both active and inactive), spent rocket bodies and other pieces of debris, even those as small as baseballs.
It took the CIA over a year and 14 separate launches before it finally managed to get an operational CORONA satellite placed in orbit. But Eisenhower deemed it worth the expense and the wait. In a single day, the satellite's Keyhole-1 camera -- which could "resolve" upon objects as small as 40 feet long -- photographed more of the Soviet Union than had been photographed over a period of years by all of the Air Force's U-2 spy planes put together.
In 1963, CORONA was supplemented by GAMBIT, a "close-look" or "spotting" satellite designed to target specifics areas. Thanks to its high-resolution Keyhole-7 camera, which could resolve upon objects as small as 18 inches long, GAMBIT was able to take photographs useful for detailed intelligence work, such as inspecting foreign weapons systems. After GAMBIT, the CIA developed HEXAGON, which could cover even more ground than CORONA and yet still resolve upon objects as small as 1 or 2 feet long. At the same time (the early 1970s), the Air Force developed the Defence Support Program, which placed a constellation of satellites in geostationary orbit around the Earth. Unlike their predecessors, these satellites contained infrared sensors as well as photographic cameras, which allowed them to work at night and/or despite the presence of heavy cloud cover.
According to the European Parliament and other researchers, the early 1970s was also the period in which the various American intelligence-gathering agencies -- trying to keep up with the satellite launches of the International Telecommunications Satellite Organization, formed in 1964 and capable of providing truly global coverage in 1968 -- developed the ECHELON system. Built upon a 1947 intelligence-sharing agreement between the USA, Canada, England, Australia and New Zealand, the ECHELON system uses immense ground-based listening stations (see picture below) to intercept and eavesdrop upon satellite-based communications. These listening stations are dispersed throughout the world, in such places as Yakima (Washington State, USA), Sugar Grove (West Virginia, USA), Menwith Hill (England), Hong Kong, Guam, Misawa Air Base (Japan), and Sabana Seca (Puerto Rico); they allow the English-speaking countries (the USA, mostly) to eavesdrop upon what the rest of the world is saying in their faxes, telexes and international telephone calls.
By 1976, satellites such as CRYSTAL were finally able to do what Eisenhower wanted the Air Force's first satellites to do, namely, use electronic signals to relay images down to earth as soon as they are captured by the satellite's (Keyhole-11) cameras. But, despite their incredible sophistication, these space-to-earth transmissions -- like all wireless broadcasts -- were and still are vulnerable to interception.
In 1982, the Department of Defense starting launching the first of the 24 satellites that today enable the operation of the Global Positioning System (GPS). Because it is the subject of a vast and rapidly expanding literature, GPS has been taken up in a separate entry,
wireless video surveillance
radio frequencies and microwaves
The camera is at lower left; the modulator is on the right; and the microwave "beamer" is at upper left.
There are several serious problems with using traditional coaxial or even high-tech fiber-optic cables to transmit video images from the surveillance cameras to the stations at which the images are monitored and/or recorded. Cables are easily damaged or severed by bad weather, birds, insects, accidents or saboteurs, and thus require nearly constant monitoring, maintanence and repair. Furthermore, cables cannot be strung over long distances without sacrificing image quality or having to build expensive booster stations along the way. The use of cable thus necessitates the close physical proximity of the monitoring stations to the areas under video surveillance. But proximity might be undesirable if the surveillance is intended to be covert or impossible if the subject of surveillance is constantly on the move.
To solve these problems, video surveillance has gone wireless. There are several means by which live video images can be transmitted without the use of cables or wires: lasers, radar signals and radio (all of which are "microwaves," differing only in frequency on the spectrum). The most commonly used microwave is radio-frequency ("radio" for short). Radio broadcasts intended to travel long distances usually make use of ground-based antennae or satellites that relay the signal from the transmitter to the receiver. Broadcasts intended to travel short distances are usually beamed "point-to-point," that is, directly from the transmitter to the receiver. (Unfortunately for the people who visit and work in the area, an example of a high-powered point-to-point system can be found right in the heart the New York City's Times Square.)
In England, whole towns are covered by complex networks of point-to-point systems. In this schematic, which explains the operation of the secure system in which the wireless surveillance camera depicted above is an element, note that the video-signal is first "modulated" (encrypted), then relayed through a "control room," at which it is "demodulated," then relayed through a "node," at which the signal is modulated again, before it finally reaches the police station, where it is (no doubt) finally unencrypted and watched and/or recorded.
In America, many law enforcement agencies use radio signals to transmit, relay and receive live video images. These agencies include the California Highway Patrol, the US Border Patrol and the the New York Police Department (NYPD). Their use of wireless cameras can either be covert or overt.
In covert operations ("stake-outs"), the cameras are usually small devices that beam their signals over short distances (usually to an unmarked van or car parked nearby) from hidden, semi-permanent locations on or near the suspects. In overt operations ("routine patrols"), the cameras are usually large devices that beam their signals over relatively long distances (back to headquarters or some other command-and-control center) from their mounts atop news-style vans or mobile command centers (usually buses). Overt wireless spy cameras can also be installed on helicopters, planes, unmanned aerial vehicles and satellites.
Whether used covertly or overtly, wireless video is a risky business for two reasons: 1) though such transmissions are often "modulated" or otherwise encrypted, they are nevertheless sent on "open," non-secured frequencies, and so can be intercepted and, given time, decoded; and 2) officers routinely stationed near the transmitters can suffer serious health problems if over-exposed to microwave radiation.
MSNBC and the Microwave Monster
Without intending to do so or realizing what it did, MSNBC (cable television) solved a small but important mystery during the program that it aired between 2:30 pm and 3 pm (EST) on Tuesday, 3 July 2001. Devoted to face recognition software and the use of surveillance cameras in public places, this program -- an awkward mish-mash of live and pre-recorded segments -- included a short interview with Bill Brown of the Surveillance Camera Players that had been taped in Times Square, Manhattan, earlier in the day.
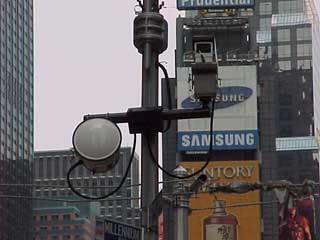
The now-solved mystery was this: who owns and operates the large unlabeled surveillance camera installed right in the heart of Times Square? It's the one installed at the top of a City-owned pole on the north end of the traffic island that lies between 43rd and 44th Streets and between Broadway and Seventh Avenues. (See photograph above.)
In addition to systematically violating people's right to privacy, this surveillance camera is jeopardizing and possibly adversely affecting the health of the tens of thousands of unsuspecting people who either work in the surrounding buildings and/or visit Times Square, the so-called crossroads of the world, as tourists. Unlike most surveillance cameras in New York City, the one in Times Square is outfitted with a large, expensive and very nasty-looking microwave transmitter, which obviously beams the images captured by the camera to an equally large receiver, which is installed high up in a building two blocks away. In the process, the transmitter -- which is continually operating, installed only 25 feet above ground-level and violates federal law to the extent that it doesn't bear a label saying that it has been inspected and approved by the Federal Communications Commission -- regularly pollutes the entire area with microwave radiation.
Who could afford to operate such a monster, which costs around $10,000? Who could operate it on City-owned property? Who would operate it with such complete disregard for federal law and the public health? The New York Police Department, which maintains a police station just one block away? The Department of Defense, which operates a recruiting center at the far end of the traffic island? No one knew.
And so the Microwave Monster has been an important topic of discussion during every single walking tour of surveillance camera locations in Times Square. Indeed, had there been enough time, Bill Brown would have shown the Monster to MSNBC's reporter Monica Novotny when he gave her an abbreviated version of the Times Square walking tour on the morning of Tuesday, 3 July. It would have been very interesting indeed if the MSNBC crew had included shots of the Monster in the collage of Times Square surveillance cameras that opened Novotny's report.
The mystery was solved by the following, perhaps unscripted admission. To provide continuity between an interview with Larry Irving of the Privacy Council and Monica Novotny's interview with Bill Brown, "Rick" at the MSNBC Live news-desk said:
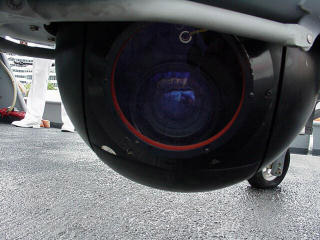
"We're going to talk a little bit more about this. How many surveillance cameras are there in Times Square, for example? Well, you're looking at [sic] one of them right now. It's probably the most famous: NBC's Times Square camera, and that's just one of many."Despite Rick's obvious mistake -- the viewer wasn't looking at a surveillance camera, but through the lens of one -- it was easy to deduce the location of this "famous" camera by the view of the area it afforded: the exact same location occupied by the Microwave Monster. There can be no doubt; no other camera is positioned to take such a view. The Microwave Monster has nothing whatsoever to do with law enforcement: it isn't owned or operated by the NYPD or the US military, but by NBC.
It is imperative that we get NBC to confirm or deny that it is in fact the owner/operator of the Microwave Monster; NBC must explain how it justifies the use of a dangerous, high-powered microwave transmitter in the heart of Times Square.
U.S. acts over satellite images
LONDON, England -- U.S. officials plan to encrypt data after it was revealed that European satellite TV viewers can tune into live spy plane transmissions. CNN confirmed on Thursday that footage from American aircraft flying over Medovci, Bosnia, could still be accessed live by satellite. The alarm was raised by British satellite enthusiast John Locker who told CNN: "I thought that the U.S. had made a deadly error. My first thought was that they were sending their spy plane pictures through the wrong satellite by mistake, and broadcasting secret information across Europe."
Locker, from the Wirral, north-western England, said he tried repeatedly to warn British, NATO and U.S. officials about the leak but his warnings were set aside. One officer wrote back to tell him that the problem was a "known hardware limitation." Locker said that it was easier for terrorists to tune into live video of U.S. intelligence activity than to pick up Disney cartoons or newly released movies. The high-intensity signal can be picked up using just basic equipment.
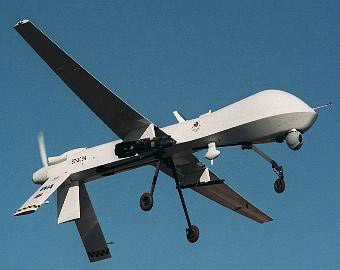
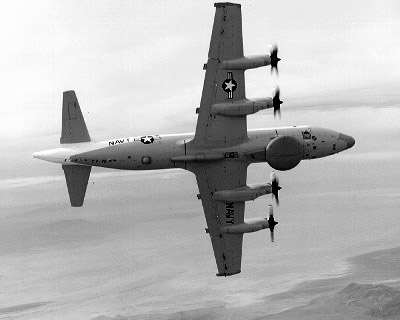
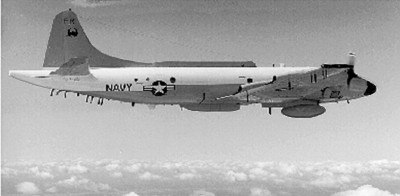
Pentagon officials told CNN's Jamie McIntyre the video was deliberately left "in the clear" and did not show sensitive information. The video, which on Thursday appeared to show a region's mountainous terrain, military-type vehicles, and other landmarks, is coming from either an unmanned Hunter surveillance drone, or the manned P-3 type of aircraft. The P-3 is similar to the four-engined, propeller plane that was forced to land on China's Hainan Island in April, 2001, after a mid-air collision with one of Beijing's warplanes.
Pentagon officials said the only "story" regarding the video would be that having to send such video in the clear underscores a lack of technology among NATO allies. The unclassified video is made available by agreement with the U.S. and any NATO allies who have troops deployed in the Bosnian region. A NATO spokesman in Brussels told CNN that it was a U.S. issue and the Pentagon had decided on the level of security at which it would accept the material.
Locker said he was able to identify the spy aircraft, Hunter and the P-3 which were helpfully identified in the corner of the screen. Geoff Bains, editor of Britain's "What Satellite TV?" magazine, said any satellite TV enthusiast in Europe could tune in with a one-metre dish costing about 60 ($90) and a free-to-air DBS digital satellite receiver costing from 150 ($220) upwards. "There's nothing complicated about the hardware to receive the signal." he told CNN.
Viewers tuning into the satellite this week were able to watch a security alert round the U.S. Army's headquarters at Camp Bondsteel in Kosovo. Last week, the spy plane provided airborne cover for a heavily protected patrol of the Macedonian-Kosovo border near Skopje. The pictures, from manned spy aircraft and drones, have been broadcast through a satellite over Brazil. The links, which are not encrypted, have also been transmitted over the Internet.
Locker said: "Obviously I'm not a military analyst and I'm not an expert in this field but I am just amazed this type of material is going out free-to-air. They put up data quite often which identified vehicles and the area to within two metres. That to me is a risk."
Richard Perle, chairman of the Pentagon's Defense Policy Board, told the BBC: "There are plans to encrypt this data. We have discovered in the period since September 11 how important this sort of real-time intelligence is. Now we are making much better use of this kind of information and it will make sense to encrypt it in the future."
Defence analyst Andrew Brookes of the International Institute for Strategic Studies told CNN the information being transmitted did not pose a risk to the planes or crew, and seemed designed for training purposes. He said the decision to use channels accessible to the public was a question of prioritising as there are only limited numbers of secret military satellite channels available.
aerial surveillance
uninhabited aerial vehicles (UAVs)
Both helicopters and spy planes have a very serious weakness: they must be piloted by human beings; that is to say, human beings must be aboard them. And so, they cannot be lost with impunity; they cannot enter into or create toxic environments. One must avoid both the purely negative consequences of crashes (death and property destruction), but also the consequences that are positive for one's enemies (the taking of prisoners of war, hostages and other potential sources of sensitive information).
And so, in order to maim and kill from a distance and without fear of being maimed or killed, the United States military has since 1964 spent billions of dollars researching and developing uninhabited (or "unmanned") aerial vehicles ("UAVs"). Because most of them can use the US military's system of satellites to communicate with their ground stations, these UAVs have mostly been used by the Air Force for reconnasissance and surveillance ("imagery intelligence") at very long ranges (between 50 and 3,000 nautical miles away). But they have also been used as combat aircraft, that is, as automated killers.
Of particular interest are (1) the Global Hawk, made by Northrop Grumman, (2) the Predator, made by General Atomics, (3) the Cypher, made by Sikorsky, and (4) the Desert Hawk, made by Lockheed Martin.
(1) Each Global Hawk costs $15 million to manufacture. This UAV is over 40 feet long, and thus requires a very large run-way for take-offs and landings. Controlled by a human operator, not an on-board computer, the Global Hawk can stay in the air for as long as 40 hours. In that time, and without stopping once to re-fuel, it can travel 3,000 miles to its target; focus upon a huge area (as many as 3,000 square miles) from as high up as 65,000 feet; use electro-optical, infra-red and Synthetic Aperture Radar (SAR) cameras to take pictures of the ground; use wireless technology or satellites to transmit those pictures in "real time"; and then return back to its homebase. The Global Hawk was first used by the Department of Defense to help NATO bombers spot potential targets in the 1998 war over Kosovo.
(2) The Predator is quite similar to the Global Hawk: it also requires a human operator and a long run-way for take-offs and landings. But, at $4.5 million each, the 27-foot-long Predator is cheaper and smaller. As a result, it is worth the risk of being sighted and shot-down to fly a Predator at relatively low altitudes (25,000 feet and below). Predators were first deployed for reconnaissance and surveillance operations ("RQ-1") by the US military during the 1995 civil war in Bosnia. Predators were used far more extensively in the USA's assault against and occupation of Afghanistan in October 2001.
Each Predator is equipped with a color nose camera (generally used by the aerial vehicle operator for flight control), a day variable aperture TV camera, a variable aperture infrared camera (for low light/night), and a synthetic aperture radar for looking through smoke, clouds or haze. The cameras produce full motion video and the SAR still frame radar images. According to Coast Guard Lt. Cmdr. Troy Beshears, a UAV platform manager in Washington, D.C., a Predator's cameras "can read a 3 to 6-inch letter from 10,000 feet."
Predator "drones" can also be equipped with lasers, targeting systems, and a pair of "Hellfire" anti-tank missiles, and used in combat ("MQ-1"). It was in fact an armed Predator that the Central Intelligence Agency -- working by remote-control from its headquarters in Langley, Virginia -- used on 3 November 2002 to assassinate Qaed Salim Sinan al-Harethi, an alleged member of Al Qaeda, and five other men (one, Kamal Derwish, a US citizen), as they traveled in a car on a road in Yemen. Al-Harethi was suspected of being responsible for the attack on the USS Cole, as well as the recent attack on a French oil tanker off the Yemeni coast.
Unfortunately, this still-unpunished war crime wasn't the first time that the CIA used an armed UAV to assassinate a group of "suspects." Earlier in the year (2002), in Afghanistan, an armed Predator was used to assassinate Mohammed Atef, al Qaeda's chief of operations. Other attacks by armed Predators -- such as those against the Taliban's former leader, Mullah Omar, and Gulbuddin Hekmatyar (a former Afghan prime minister and the head of the Islamic fundamentalist Hezb-e-Islami group) -- have missed their targets and/or killed civilians. (Here the CIA is following the example of the Israeli special forces, which have for years been using American-made missile-firing helicopters to assassinate suspected Palestinian terrorists.)
And yet the US military didn't use Predators in its March 2003 assault against and occupation of Iraq. The reason was clear: too many of the damn things -- as many as 12 percent of them, according to one estimate -- had crashed in Afghanistan due to bad weather conditions and other "technical" problems. In addition to wasting money, these little-publicized crashes made great trophies. But these facts shouldn't have come as surprises to the Department of Defense, which had already been informed by Thomas P. Christie, the director of the Pentagon's Operational Test and Evaluation Office, that, "As tested, the Predator UAV system is not operationally effective or suitable [...] Poor target location accuracy, ineffective communications, and limits imposed by relatively benign weather, including rain, negatively impact missions such as strike support, combat search and rescue, area search, and continuous coverage."
In place of Predators, the US military forces in Iraq used AAI's Shadow 200, which cost $300,000 each. Much smaller than Predators, the 11-foot-long Shadows don't require run-ways to take-off and land. Like helicopters, they only require clearance space above them. And yet Shadows can still send live feeds from their video and infrared cameras over distances of 77 miles. Another "Unmanned Combat Air Vehicle" or UCAV is the X-45, manufactured by Boeing ($10 million each) and capable of launching precision-guided weapons.
(3) The Cypher is relatively small. Some "mini-Cyphers" are only 8 feet tall and 3 feet wide, and weigh only 30 pounds, which allow it to enter buildings as well as hover above or land on top of them. (Other UAVs, such as MLB's truck-launched UAV, can be even smaller.) But the uniqueness of the Cypher isn't simply a matter of its small size and maneouverabiliy. Unlike the Global Hawk and the Predator, the Cypher flies itself. A fully automated uninhabited spy plane, it simply needs to know where to go to find its targets. Once given this information, the Cypher can launch itself (veritically, like a helicopter); can use the military's network of Global Positioning Satellites (GPS) to find out where its launch has placed it; and can use a variety of on-board cameras to "see" where it needs to go. Internal computer programs will also tell the Cypher when it has arrived, what to do, and when to return to homebase.
Onboard each Cypher are video cameras, Forward-Looking Infra-Red (FLIR) cameras, chemical detectors, magnometers, radio and satellite links, microphones to relay pre-recorded announcements, and so-called non-lethal payloads (tear gas and/or smoke cannisters, steel spikes to puncture tires or printed propaganda). As one can see from this "mixed" payload, the Cypher is very different from both the Global Hawk and the Predator. It isn't primarily designed to be used as a spy plane (or as an automated assassin) in wars against heavily armed combatants, though it can serve quite well in such instances. The Cypher's real usefulness is in what the US military calls "operations other than war," that is to say, in domestic police actions or enforcements of the law against civilian non-combatants one wants to disperse or arrest, but not murder in cold blood.
(4) The Desert Hawk is truly tiny. Manufactured by Lockheed Martin, it's less than 3-feet-long and, according to a 6 March 2004 report by Jim Skeen of the Daily News, it's being used by the US military in both Iraq and Afghanistan.
Palmdale Calif. - A tiny spy plane developed by Lockheed Martin engineers in Palmdale is doing sentry duty around U.S. air bases in Iraq and Afghanistan. Weighing seven pounds and looking like something out of a hobby shop, Desert Hawk controls itself without human guidance and carries video cameras and infrared sensors that allow security personnel to scout outside bases without exposing themselves to danger.
"A key factor of our system is it's fully autonomous. You don't have to have a guy standing there with a joy stick," said David Eichstedt, Lockheed Martin's project manager.
A product of Lockheed Martin Aeronautics Co./Palmdale, the craft is formally known as the Force Protection Airborne Surveillance System, or FPASS. It was nicknamed "Desert Hawk" by the general in charge of air forces in the Middle East. The Desert Hawk is just 32 inches long and has a wingspan of 52 inches, powered by an electric motor and able to fly for an hour to 75 minutes at a time. It is operated in a system that each includes six Desert Hawks, a ground station and a remote viewing terminal, plus a field kit for repairs. While the Desert Hawk looks like a remote-controlled model plane, it is much more sophisticated. Its missions are programmed in advance using a touch-screen interface on a laptop computer. A mission can be changed while the aircraft is in flight. The aircraft lands by itself, without guidance from its human operators. Rather than taking off from a runway, the aircraft are launched into the air with a bungee cord that can stretch out to 150 feet. "It can fling it up 200 feet in short order," Eichstedt [of Lockheed Martin] said.
The Defense Department is looking at expanding the use of Desert Hawk by placing unmanned air vehicles and their operators with Army Special Operations forces. Four systems have been delivered to the British Army. For now, Lockheed Martin is focused on military uses of the Desert Hawk.
Federal Aviation Administration regulations block unmanned air vehicles from using the national air space [hic], making civilian applications problematic. NASA and the aviation industry are embarking on an effort to determine what regulations and what advancements in unmanned air vehicle technologies are needed to allow aircraft like Desert Hawk as well as larger unmanned craft to routinely use the national air space. Resolving those issues will open up the national air space for civilian applications of UAVs.
"You can think of all kinds of cool things to do with UAVs -- look for forest fires, search and rescue missions, monitoring aqueducts and pipelines," Eichstedt said.
The Desert Hawk's roots go back to 1996 when Lockheed Martin was conducting research and development under a program called Micro Air Vehicle for the Defense Advanced Research Projects Agency. At the time, DARPA was interested in the idea of developing a UAV that was no more than 6 inches long. Out of that work came development of autopilot and communications technologies that would serve as the backbone of Desert Hawk. In February 2002, as the Afghanistan campaign was well under way, Lockheed Martin entered into a contract with the Air Force to begin providing the Desert Hawk systems. The first two systems were delivered four months later. The Air Force was so pleased with the system that it nominated Desert Hawk for the 2002 Collier Trophy, the aviation world's equivalent of an Academy Award. While it did not win the Collier, the Air Force's nomination was high praise. Employment numbers on the program were not disclosed, but company spokeswoman Dianne Knippel said the Desert Hawk is not a large employment project. The Desert Hawk is in use in both Iraq and Afghanistan, but Lockheed Martin officials would not comment on how many have been deployed [or lost].
*
One often hears about the use of UAVs in "the war on terrorism" and "homeland security." For example, on 11 November 2002, the Newhouse News Service reported that "Pilotless Planes' Latest Target May Be Homeland Security," that is, "[i]f concerns about their safety and reliability can be resolved." Good point, but there is another "concern" that must be addressed before UAVs can been used over the USA: the Federal Aviation Administration has to approve their use in commercial flight zones, which is something it hasn't done yet, and isn't likely to do due to the still-unresolved problem of crashes.
On 26 November 2002, The Gaithersburg News reported that UAVs can be used to gather photographs and videotape for use in Lockheed Martin's Geographic Information System (GIS), which displays large quantities of detailed information in the form of digital maps, which in turn can be used to make quick and well-chosen responses to emergencies (such as terrorist attacks). But there are still significant technical problems. At the demonstration at Lockheed Martin's plant in Gaithersburg, there was in the words of the reporter "a planned demonstration" that literally "never got off the ground" (most unfortunate, because this particular demonstration concerned the actual merging of UAV and GIS technologies!), and "another demonstration" that was cancelled due to "weather and technical glitches."
On 23 July 2003, The Herald Sun reported that the Australian military would soon start using UAVs to track "rebels" and "gangs of thugs" on the Solomon Islands. "Once located," the story says, "targets can be kept under surveillance, filmed and photographed day and night." But these one-meter-long UAVs will not use on-board transmitters. Instead, "film and photographs will be flown back to base, probably at Honiara airport, where they will be analysed by military experts and defence scientists and used to help plan operations." And so, while they are "more secure" to the extent they aren't sending out transmissions that the rebels can intercept, these UAVs will more likely be targets for ground-to-air attacks: bring one down and you've destroyed both the UAV itself and any images it took.
surveillance from the air
spy planes
As we've mentioned elsewhere, helicopters have certain drawbacks: they are very noisy; they must fly at relatively low altitudes; they cannot "hide" by achieving high altitudes; they're vulnerable to small arms fire from the ground; and they can't fly long distances or stay aloft for long periods of time without refueling. And so helicopters are increasingly being used alongside a variety of other aircraft, including spy planes.
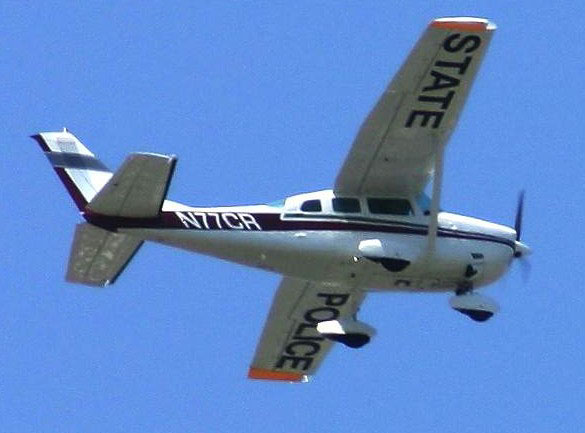
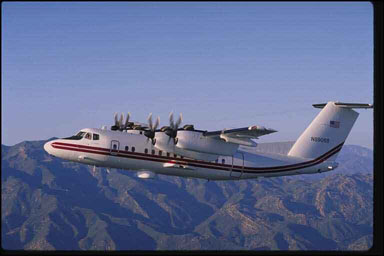
To be as undetectable, as sneaky, as possible, spy planes aren't large military jets, but small propeller-driven "private" airplanes (usually Cessnas or De Havillands) that have been packed with military equipment. The motors have been modified so that they can run "silently." As a result, spy planes make virtually no noise, look "perfectly innocent" and are highly unlikely to be detected, even when they fly slowly at low altitudes. (The only dead giveaway is the antennae-laden "radom" on the plane's underside.)
Ironically, spy planes are easier to spot at night than during the day. They frequently fly very slowly -- so slowly, in fact, that at times they appear to be motionless. Spy planes don't keep to the easy to spot flight routes maintained by the Federal Aviation Admininstration (FAA) for jet-powered commercial aircraft, and sometimes circle several times around a "pivot" (target) on the ground. The bodies of spy planes are silver or white, and bear few if any identifying or distinguishing markings or insignia. Finally, unlike the lights on commercial airplanes, which are bright and continuously shining, the lights on spy planes are dim and/or red-colored, alternate in irregular patters ("flicker") and sometimes go completely dark, and then light up again, in a matter of seconds.
Spy planes have long been used by so-called intelligence-gathering agencies such as the National Security Agency (NSA) to monitor foreign countries, especially the Soviet Union. But in recent years, especially since September 11th, spy planes are being used to fly reconnaissance missions over the territory of the United States of America. To our knowledge, at least two "authorities" are currently using spy planes for the purpose of "homeland security": the Federal Bureau of Investigation (FBI) and the Department of Defense.
On 15 March 2003, the Associated Press (AP) reported that "the FBI has a fleet of aircraft [...] flying America's skies to track and collect intelligence from suspected terrorists." There are around 100 of these planes, which are nicknamed "Nightstalkers" and can be flown by any of the FBI's 56 field offices. Each spy plane is equipped with what the AP describes as "electronic surveillance equipment so agents can pursue listening devices placed in cars, in buildings and even along streets, or listen to cell phone calls. Still others fly photography missions [using] infrared devices that allow agents to track people and vehicles in the dark."
The AP report went on to explain that, "Legally, no warrants are necessary for the FBI to track cars or people from the air. Law enforcement officials need warrants to search homes or to plant listening devices or monitor cell phone calls -- and that includes when the listener is flying in an airplane [...] A senior FBI official, speaking on condition of anonymity, said the FBI does not do flyovers to listen to telephone calls and gather electronic data from random citizens in hopes the data will provide leads. Rather, the planes are used to follow specific individuals."
In mid-October 2002, the Department of Defense (DOD) used the series of sniper attacks in the Washington, DC area as an opportuntiy to "offer" the use of its spy planes to catch the culprits (one whom, it turned out, had extensive military training). Dispatched from the 204th Military Intelligence Battalion at Fort Bliss, Texas, the DOD's planes are even more sophisticated than those flown by the FBI: each one is equipped with long-range cameras, radar and hyperspectral sensors, Forward Looking Infra-Red (FLIR) imaging devices, on-board computers, target-acquisition and tracking software programs, and microwave transmitters to "downlink" to monitoring stations on the ground.
News reports indicate that the Department of Defense's kindly offer was reluctantly refused. There had been too much criticism of the offer, which clearly violated the spirit, if not the actual letter, of the 1878 Posse Comitatus Act (there must be a strict separation between the military and domestic law enforcement agencies, that is, if democracy is to survive).
Needless to say, the Bush Administration wants to repeal the Posse Comitatas Act, and for the same cynical reasons that the New York Police Department wants to nullify the Handschu Consent Decree: September 11th rendered these internal controls both obsolete and an obstacle to preventing future attacks. And so, without generating any objections at all, the DOD announced in March 2003 (five months after the sniper attacks had ended) that it was deploying Black Hawk helicopters in New York's "airspace." No doubt, DOD (or NSA?) spy planes were also deployed.
The digital camera can be considered as an alteration of the conventional analog camera. Most of the associated components are also the same, except that instead of light falling on a photosensitive film like an analog camera, image sensors are used in digital cameras. Though analog cameras are mostly dependent on mechanical and chemical processes, digital cameras are dependent on digital processes. This is a major shift from its predecessor as the concept of saving and sharing audio as well as video contents have been simplified to earth.
Digital Camera Basics
As told earlier, the basic components are all the same for both analog and digital cameras. But, the only difference is that the images received in an analog camera will be printed on a photographic paper. If you need to send these photos by mail, you will have to digitally convert them. So, the photo has to be digitally scanned.
This difficulty is not seen in digital photos. The photos from a digital camera are already in the digital format which the computer can easily recognize (0 and 1). The 0’s and 1’s in a digital camera are kept as strings of tiny dots called pixels.
The image sensors used in an digital can be either a Charge Coupled Device (CCD) or a Complimentary Metal Oxide Semi-conductor (CMOS). Both these image sensors have been deeply explained earlier.
The image sensor is basically a micro-chip with a width of about 10mm. The chip consists arrays of sensors, which can convert the light into electrical charges. Though both CMOS and CCD are very common, CMOS chips are known to be more cheaper. But for higher pixel range and costly cameras mostly CCD technology is used.
A digital camera has lens/lenses which are used to focus the light that is to be projected and created. This light is made to focus on an image sensor which converts the light signals into electric signals. The light hits the image sensor as soon as the photographer hits the shutter button. As soon as the shutter opens the pixels are illuminated by the light in different intensities. Thus an electric signal is generated. This electric signal is then further broke down to digital data and stored in a computer.
Pixel Resolution of a Digital Camera
The clarity of the photos taken from a digital camera depends on the resolution of the camera. This resolution is always measured in the pixels. If the numbers of pixels are more, the resolution increases, thereby increasing the picture quality. There are many type of resolutions available for cameras. They differ mainly in the price.
- 256×256 – This is the basic resolution a camera has. The images taken in such a resolution will look blurred and grainy. They are the cheapest and also unacceptable.
- 640×480 – This is a little more high resolution camera than 256×256 type. Though a clearer image than the former can be obtained, they are frequently considered to be low end. These type of cameras are suitable for posting pics and images in websites.
- 1216×912 – This resolution is normally used in studios for printing pictures. A total of 1,109,000 pixels are available.
- 1600×1200 – This is the high resolution type. The pictures are in their high end and can be used to make a 4×5 with the same quality as that you would get from a photo lab.
- 2240×1680 – This is commonly referred to as a 4 megapixel cameras. With this resolution you can easily take a photo print up to 16×20 inches.
- 4064×2704 – This is commonly referred to as a 11.1 megapixel camera. 11.1 megapixels takes pictures at this resolution. With this resolution you can easily take a photo print up to 13.5×9 inch prints with no loss of picture quality.
- There are even higher resolution cameras up to 20 million pixels or so.
Color Filtering using Demosaicing Algorithms
The sensors used in digital cameras are actually coloured blind. All it knows is to keep a track of the intensity of light hitting on it. To get the colour image, the photosites use filters so as to obtain the three primary colours. Once these colours are combined the required spectrum is obtained.
For this, a mechanism called interpolation is carried out. A colour filter array is placed over each individual photosite. Thus, the sensor is divided into red, green and blue pixels providing accurate result of the true colour at a particular location. The filter most commonly used for this process is called Bayer filter pattern. In this pattern an alternative row of red and green filters with a row of blue and green filters. The number of green pixels available will be equal to the number of blue and red combined. It is designed in a different proportion as the human eye is not equally sensitive to all three colours. Our eyes will percept a true vision only if the green pixels are more.
The main advantage of this method is that only one sensor is required for the recording of all the colour information. Thus the size of the camera as well as its price can be lessened to a great extent. Thus by using a Bayer Filter a mosaic of all the main colours are obtained in various intensities. These various intensities can be further simplified into equal sized mosaics through a method called demosaicing algorithms. For this the three composite colours from a single pixel are mixed to form a single true colour by finding out the average values of the closest surrounding pixels.
Take a look at the digital camera schematic shown below.

- Digital Camera Diagram
Parameters of a Digital Camera
Like a film camera, a digital camera also has certain parameters. These parameters decide the clarity of the image. First of all the amount of light that enters through the lens and hits the sensor has to be controlled. For this, the parameters are
- Aperture – Aperture refers to the diameter of the opening in the camera. This can be set in automatic as well as the manual mode. Professionals prefer manual mode, as they can bring their own touch to the image.
2. Shutter Speed – Shutter speed refers to the rate and amount of light that passes through the aperture. This can be automatic only. Both the aperture and the shutter speed play important roles in making a good image.
3. Focal Length – The focal length is a factor that is designed by the manufacturer. It is the distance between the lens and the sensor. It also depends on the size of the sensor. If the size of the sensor is small, the focal length will also be reduced by a proportional amount.
4. Lens – There are mainly four types of lenses used for a digital camera. They differ according to the cost of the camera, and also focal length adjustment. They are
- Fixed-focus, fixed-zoom lens – They are very common and are used in inexpensive cameras.
- Optical-zoom lenses with automatic focus – These are lenses with focal length adjustments. They also have the “wide” and “telephoto” options.
- Digital zoom – Full-sized images are produced by taking pixels from the centre of the image sensor. This method also depends on the resolution as well as the sensor used in the camera.
- Replaceable lens systems – Some digital cameras replace their lenses with 35mm camera lenses so as to obtain better images.
Digital Cameras v/s Analog Camera
- The picture quality obtained in a film camera is much better than that in a digital camera.
- The rise of technology has made filming the help of digital techniques easier as well as popular.
- Since the digtal copy can be posted in websites, photos can be sent to anyone in this world.
Different Types Of Digital Cameras
Digital cameras are mainly classified according to their use, automatic and manual focus, and also price. Here are the classifications.
1. Compact digital cameras
Compact cameras are the most widely used and the simplest cameras to be ever seen. They are used for ordinary purposes and are thus called “point and shoot cameras”. They are very small in size and are hence portable. Since they are cheaper than the other cameras, they also contain fewer features, thus lessening the picture quality. These cameras are further classified according to their size. The smaller cameras are generally called as ultra-compact cameras. The others are called compact cameras.
Here are some features of this camera
- Compact and simple.
- Images can be stored in computer as JPEG files.
- Live preview can be seen before taking photos.
- Low power flashes are available for taking photos in the dark.
- Contains auto-focus system with closer focusing ability.
- Zoom capability.
Although these features are available, their magnitude may be less compared to other cameras. The flashes may be available only for nearby objects. The preview of the picture to be taken will have less motion capability. The image sensors used in these cameras have a very small diognal space of about 6mm with a crop factor of 6.

Compact Digital Cameras
2. Bridge cameras
Bridge cameras are most often mistaken for single-lens reflex cameras (SLR). Though they have the same characteristics their features are different. Some of its features are
- Fixed lens
- Small image sensors
- Live preview of the image to be taken
- Auto-focus using contrast-detect method and also manual focus.
- Image stabilization method to reduce sensitivity.
- Image can be stored as a raw data as well as compressed JPEG format.
Though they resemble SLR in many ways, they operate much slower than the latter. They are very big in size and so the fixed lenses are given very high zooming capability and also fast apertures. The autofocus or manual focus is set according to our necessity. The image preview is done using either a LCD or an Electronic View Finder (EVF).

Bridge Cameras
3. Digital single lens reflex cameras (DSLR)
This is one of the most high end cameras obtainable for a decent price. They use the single-lens reflex method just like an ordinary camera with a digital image sensor. The SLR method consists of a mirror which reflects the light passing through the lens with the help of a separate optical viewfinder.
Some features of this camera are
- Special type of sensors is setup in the mirror box for obtaining autofocus.
- Has live preview mode.
- Very high end sensors with crop factors from 2 to 1 with diagonal space from 18mm to 36mm.
- High picture quality even at low light.
- The depth of field is very less at a particular aperture.
- The photographer can choose the lens needed for the situation and can also be easily interchangeable.
- A focal plane shutter is used in front of the imager.
") Digital single lens reflex cameras (DSLR)
Digital single lens reflex cameras (DSLR)
4. Electronic viewfinder (EVF)
This is just a combination of very large sensors and also interchangeable lenses. The preview is made using an EVF. There is no complication in mechanism like a DSLR.

Electronic View Finder
5. Digital rangefinders
This is a special film camera equipped with a rangefinder. With this type of a camera distant photography is possible. Though other cameras can be used to take distant photos, they do not use the rangefinder technique.

Digital rangefinders
6. Line-scan cameras
This type of cameras is used for capturing high image resolutions at a very high speed. To make this mechanism possible, a single pixel of image sensors are used instead of a matrix system. A stream of pictures of constantly moving materials can be taken with this camera. The data produced by a line-scan camera is 1-dimensional. It has to be processed in a computer to make it 2-D. This 2-D data is further processed to obtain our needs.
Line-scan cameras
Charge Coupled Device and CMOS Active Pixel Sensor have already been posted, it is time to know their comparison, advantages and disadvantages. Though both of them are equally used in cameras, there are some differences in parameters like gain, speed and so on.
Comparison – Charge Coupled Device and CMOS Active Pixel Sensor
- Both the devices are used to convert light into electric signals and are used for the same applications. After converting the signals, they have to be read from each cell. This process is different for both the devices.
- The charge from each chip is taken to the end of the array and then read in a CCD. This is then converted into a digital signal with the help of an analog to digital converter (ADC). The process of reading the signal by CMOS Active Pixel Sensor is done by using transistors and amplifiers at each pixel and then the signal is moved using traditional wires.
Difference – Charge Coupled Device and CMOS Active Pixel Sensor
- CCD image sensors create super quality pictures. They also produce lesser noise than CMOS APS.
- In a CMOS all the transistors are kept right next to each pixel. As a result, all the photons that hit the device actually get scattered by hitting the transistors as well. Thus, the sensitivity of CMOS Active Pixel Sensor is lesser than that of a Charge Coupled Device.
- The design of the CCD sensors is in such a way that they require more power for its operation. If both the devices of equal reception are taken, the CCD is considered to consume almost 100 times more power than its equivalent CMOS Active Pixel Sensor.
- All the devices have been using Charge Coupled Device devices far more than CMOS Active Pixel Sensor. As a result a vast study has been done on CCD devices. So, they are more mature and also tend to have higher quality pixels.
"Nannycams" and other insecure forms of video surveillance

Thousands of people who have installed a popular wireless video camera, intending to increase the security of their homes and offices, have instead unknowingly opened a window on their activities to anyone equipped with a cheap receiver. The wireless video camera, which is heavily advertised on the Internet, is intended to send its video signal to a nearby base station, allowing it to be viewed on a computer or a television. But its signal can be intercepted from more than a quarter-mile away by off-the-shelf electronic equipment costing less than $250.
A recent drive around the New Jersey suburbs with two security experts underscored the ease with which a digital eavesdropper can peek into homes where the cameras are put to use as video baby monitors and inexpensive security cameras. The rangy young driver pulled his truck around a corner in the well-to-do suburban town of Chatham and stopped in front of an unpretentious house. A window on his laptop's screen that had been flickering suddenly showed a crisp black-and-white video image: a living room, seen from somewhere near the floor. Baby toys were strewn across the floor, and a woman sat on a couch.
After showing the nanny-cam images, the man, a privacy advocate who asked that his name not be used, drove on, scanning other houses and finding a view from above a back door and of an empty crib [...]
The vulnerability of wireless products has been well understood for decades. The radio spectrum is crowded, and broadcast is an inherently leaky medium; baby monitors would sometimes receive signals from early cordless phones (most are scrambled today to prevent monitoring). A subculture of enthusiasts grew up around inexpensive scanning equipment that could pick up signals from cordless and cellular phones, as former Speaker Newt Gingrich discovered when recordings of a 1996 conference call strategy session were released by Democrats [...]
In the case of the XCam2, the cameras transmit an unscrambled analog radio signal that can be picked up by receivers sold with the cameras. Replacing the receiver's small antenna with a more powerful one and adding a signal amplifier to pick up transmissions over greater distances is a trivial task for anyone who knows his way around a RadioShack and can use a soldering iron.
Products intended for the consumer market rarely include strong security, said Gary McGraw, the chief technology officer of Cigital, a software risk-management company. That is because security costs money, and even pennies of added expense eat into profits. "When you're talking about a cheap thing that's consumer grade that you're supposed to sell lots and lots of copies of, that really matters," he said.
Refitting an X10 camera with encryption technology would be beyond the skills of most consumers. It is best for manufacturers to design security features into products from the start, because adding them afterward is far more difficult, Mr. McGraw said. The cameras are only the latest example of systems that are too insecure in their first versions, he said, and cited other examples, including Microsoft's Windows operating system. "It's going to take a long time for consumer goods to have any security wedged into them at all," he said [...]
As a security expert, Mr. Rubin said he was concerned about the kinds of mischief that a criminal could carry out by substituting one video image for another. In one scenario, a robber or kidnapper wanting to get past a security camera at the front door could secretly record the video image of a trusted neighbor knocking. Later, the robber could force that image into the victim's receiver with a more powerful signal. "I have my computer retransmit these images while I come by," he said, explaining the view of a would-be robber. Far-fetched, perhaps. That is the way security experts think. But those who use the cameras and find out about the security hole seem to grasp the implications quickly
the real news from Washington

At approximately 9:00 am (Eastern Standard Time) on Sunday 21 April 2002, the CBS news program Sunday Morning with Charles Osgood included a segment on surveillance cameras. Reported by news correspondent Martha Teichner and produced by Jason Sacca, this 10-minute-long segment focused upon the police video surveillance system in Washington, D.C., and included interviews with D.C. Police Chief Charles Ramsey, Congressional Representative Connie Morella, Bill Brown of the New York Surveillance Camera Players, and Marc Rotenberg of the Electronic Privacy Information Center (EPIC), which has put up a new web site exclusively devoted to surveillance cameras in the District of Columbia.
If one didn't see the TV broadcast but simply read about it on CBS's web site, one might resonably have thought that the focus of the story was primarily New York City, not Washington, D.C.
(CBS) Times Square. The best place in the United States to lose yourself. Pretty anonymous, right? Think again. As many as 200 surveillance cameras are observing every move you make.Unfortunately, this was only the beginning of the confusion. A patch-work construction, CBS's program on surveillance introduced several, possibly (un)related themes: 1) the use of police cameras to watch political demonstrators (the program opened with shots of and commentary about demonstrators walking beneath surveillance cameras during a large anti-war demonstration held in Washington, D.C., on 20 April 2002); 2) the use of Park Police cameras to watch visitors to the monuments in the nation's capital; 3) the use of police cameras to watch tourists in Times Square; and 4) the use of surveillance cameras in England (there was a brief sub-segment that included shots of cameras in London and a badly recorded voice-over that was no doubt left in because it couldn't be re-recorded without flying back to England). There was also 5) a series of ad hoc references to topics of "current" interest, such as face recognition software, traffic or "red-light" cameras and the use of surveillance cameras to watch passengers on JetBlue airplanes. (We must place the word "current" in quotes because CBS passed on lots of out-of-date information about these subjects: Correspondent Teichner referred to the use of face recognition in Tampa Bay, Florida, without mentioning the fact that Tampa's police stopped using the software back in August 2001 because it was totally unreliable; and she referred to traffic cameras without mentioning the fact that, in the last few months, these devices have either been successfully challenged in court or taken down in several American cities and states, including Denver, San Diego and Hawaii.)
That's nothing compared to Washington, D.C., where the chief of police says that he potentially has access to an unlimited number of cameras.
This Sunday Morning, the slippery slope of surveillance.
Americans have grown accustomed to surveillance cameras watching them in convenience stores, at work, and at ATM machines. But in the aftermath of Sept. 11, many private businesses, town governments, and police departments are installing surveillance cameras, often in public places, at what privacy advocates say is an alarming rate. They want to know, "Who's watching the watchers?"
CBS News Sunday Morning Correspondent Martha Teichner reports on the growing debate between security and privacy.
Unfortunately for the (average) viewer, at least two of these themes -- the sub-segment on England and the series of ad hoc references -- should never have been included in the first place. The time spent on these matters, which are clearly of secondary concern, should have been devoted instead to the widespread but under-reported use of cameras by police departments to watch political demonstrations both large and small, both in the nation's capital and elsewhere. (Note well that the DC Independent Media Center carried a great deal of coverage of the 20 April 2002 demonstrations, but did not mention the police's use of high-tech surveillance cameras to watch the participants in them, despite the fact that -- according to the police -- many of these cameras were originally installed to surveill the demonstrators outside of the World Bank/International Monetary Fund meetings that were held in Washington, D.C., in April 2000.) Instead, CBS chose to devote the majority of its attention to the use of police cameras to watch visitors to the national monuments in Washington, D.C., and "tourists" in Times Square.
According to EPIC's Marc Rotenberg, D.C. will be the main field upon which the looming battle over surveillance cameras and privacy rights will be fought. Rotenberg's right, but not necessarily (or solely) for the reason given, i.e., that Washington's monuments -- the Lincoln Memorial, the Vietnam Veterans' Memorial, et al -- literally symbolize the country's commitment to "liberty and justice for all," and so should not be defiled or trivialized by the presence of devices that provide "security for some." People won't stand for it, or so goes this line of reasoning.
But "people" will stand for it: CBS says so and of course CBS has "the facts" to prove it. According to a poll "out today," 77 percent (of those who responded) were in favor of the use of police cameras at the nation's monuments; 81 percent didn't think such cameras were an invasion of the right to privacy; and 72 percent would be willing to give up "some" of their personal liberties for increased "security." Even more damaging to the position(s) taken by Rotenberg, Rep. Morella and Bill Brown (that is to say, everyone other than Police Chief Ramsey) was the "fact" that, despite the use of video surveillance by 80 percent of America's 19,000 police departments, CBS "couldn't find any evidence of serious abuses."
Neither Rotenberg, Morella, nor Brown were given an opportunity to respond to these alledged facts, which are either completely irrelevant or obviously inaccurate. The express intention of the Bill of Rights was to guarantee the protection of certain basic human rights, including the right to privacy, despite the vicissitudes of public opinion, unless or only if those vicissitudes rose to the level at which another amendment to the Constitution was necessary. The Ninth Amendment makes it clear that, even if the Fourth Amendment doesn't use the word "privacy," the right to privacy (among other unspecified rights) is still protected by the Constitution. Serious abuses of video cameras have been reported over and over again in New York's newspapers. In the most recent case, the building superintendant at 597 Fifth Avenue in Manhattan was caught using the "security" system he himself installed and maintained, not to prevent crimes, but to commit them, i.e., to watch women's bathrooms for sexual gratification). Such stories have led to the passage of measures against secret videotaping in Florida and other states.
In the absence of this truly relevant information, the viewer of the CBS program must have thought that all the anti-surveillance activists have going for them is: 1) the Fourth Amendment to the U.S. Constitution, which CBS showed Bill Brown reading aloud to what the TV network identified as a police surveillance camera in Times Square (this scene was in fact the segment's conclusion); 2) the scene in which EPIC's photographers were physically ejected from a building by private security guards (in the incongruous voice-over, Correspondent Teichner implored her viewers "You be the judge" of whether or not this horrific footage documents precisely the sort of "abuse" that CBS claimed that it couldn't find among police officers, who sometimes moon-light as security guards); and 3) the scene in which Marc Rotenberg pointed out that Police Chief Ramsey was obviously lying when he (Ramsey) claimed that his cameras can't zoom in and focus on the words in a flyer or newspaper that is being distributed by someone standing on the street, nor can they pull back and read a license plate on a car one mile away, when (as Rotenberg pointed out) a camera with these abilities (and more) can be purchased at any electronics store in America for under $1,000.
Though that was a lot of damaging testimony, it wasn't enough to give the viewer a sense of what's really at stake in the battle over the surveillance of public places by the D.C. police. As a result, the opposition -- even if it was articulated by three (very) different people (Rotenberg, Brown and Morella) -- seemed irrelevant, out-of-step and possibly motivated by ulterior ("political") motives, unlike humble public servant Charles Ramsey. "This isn't the 19th Century," the ultra-modern Chief of Police, possibly confused about the century in which the Bill of Rights was passed, said to CBS; "it's the 21st Century, and we're going to use what's available to us."
And that, of course, is the rub. "What's available" to the D.C. police -- what makes D.C. the field upon which the battle over surveillance is going to take place -- is perhaps the most sophisticated (and the most vulnerable) surveillance system in the world. Unfortunately, CBS didn't tell its viewers about this system or how it works; it simply showed it. And, unless the viewer knew exactly what he or she was looking at when CBS showed Police Chief Ramsey standing in front of a wall of computer screens, what was shown was likely to go right by the average viewer.
The D.C. police aren't using a "traditional" closed-circuit television (CCTV) system, in which the surveillance cameras are physically connected to the video monitors by cables, but an "ultra-modern" open-circuit television (OCTV) system, in which the cameras contain microwave transmitters that use digital wireless networks to send the images they've captured to the monitors. The D.C. police are also "tapping into" or gaining physical access to other, pre-existing CCTV systems and using microwave transmitters to beam the images captured by these systems to the police's own video monitors. To allow the watchers of these monitors to be anywhere they want or need to be, rather than in a specific control-room or some other centralized location, the transmitted images are being received and displayed by Internet servers. In exactly the same way that the average Internet user might employ a Web browser such as Netscape or Internet Explorer to click through and look at a series of Web sites, the D.C. police are using special computer software to click through and look at any surveillance camera that's part of the system.
The advantages of such an OCTV system are clear: not only does it allow both centralized and decentralized watching (indeed, the watcher(s) of a particular camera can be anywhere in the world an Internet connection is possible), it also obviates the necessity for protecting and repairing those troublesome video cables, which can easily be damaged by heat, cold, insects, birds, accidents, saboteurs, etc etc. The images captured by such a system aren't limited to the medium of videotape, and can be reproduced and distributed instantaneously in a wide variety of other media (print, fax, e-mail) without an appreciable loss of quality or detail. Furthermore, these digital images can be stored without using hardly any computer space, and can be retrieved, sorted through and grouped in a matter of seconds. Working with all this high-tech gadgetry must sure be flattering to the egos of the rookie officers and demoralized veterans who are assigned to be the video watchers . . . .
But the disadvantages of the OCTV system in Washington, D.C. are very serious indeed, and far outweigh the advantages. In a story published in The New York Times and brought to Bill Brown's attention by none other than Martha Teichner and on the very day that she interviewed Bill for CBS, it was revealed that wireless nanny cams -- which are surveillance cameras that use wireless OCTV systems to surveill nannies while the parents are away -- can easily be "hacked into" by people who purchase a certain, relatively inexpensive electronic device that scans for and locks on to wireless video transmissions. And so, the very same device (the wireless nanny cam) that supposedly gives parents (and only parents) the opportunity to "secretly" watch nannies, and thereby protect their children from predators, can also be used by anyone (a burglar, rapist or voyeur) to pry right into people's homes without their owners knowing or even suspecting.
When asked to respond to the story in The New York Times, Bill ignored the question of hackers and focused on the situation they were exploiting: while at work, parents are using wireless cameras and the Internet to watch the people they have hired to watch their children. What struck Bill was the fact that these parents are getting things backwards, and that what they should be doing is staying at home with their children, and using the Internet to "telecommute" into work. Unfortunately, none of this -- neither nanny cams nor Bill's response to the article in The New York Times about them -- made it into CBS's broadcast.
What Martha Teichner knows, but (also) didn't put into her piece, was the simple fact that the D.C. police's wireless OCTV system -- and the New York Police Department's video vans and helicopters and the many other similar systems in operation -- have the exact same (fatal) vulnerability as that possessed by privately owned wireless nanny cams: they can easily be hacked into by curious-seekers, criminals or terrorists. And these hackers need not be "passive," that is, they need not be satisifed with the views that their unwitting hosts have provided for them. In a fact not mentioned by The New York Times, hackers can also actively re-program the computer that controls the OCTV system and, if they like, feed the system a stream of misleading or fake images, or even create new, "super-secret" views (these might be of the original programmer and/or the people or things he or she originally sought to protect).
And so, the real news is this: in the name of providing "security," the D.C. police and the NYPD have installed systems that are thoroughly insecure, and thus actual dangers to the people they were installed to protect.
Cops Build Private TV Networks
When Does Intelligence Become Snooping?

NEW YORK -- By the nature of their work, police have always been a focus of media attention. Now, instead of merely appearing on news broadcasts, police are purchasing the equipment needed to make their own private broadcasts. In recent years, large departments have been outfitting video units with sophisticated cameras and microwave broadcast technology. The systems can relay live video from, say, the scene of a demonstration to police headquarters downtown, where coffee-swigging commanders can keep tabs on the action from a newsroom-style command center. Departments have equipped helicopters with microwave-transmitting cameras that can pick up a car's license plate from a half-mile away and broadcast it to police on the ground. And they've even begun to cover events using the ubiquitous electronic news-gathering (ENG) vans, with their trademark telescoping microwave transmitters rising from the roof.
Lawmen say the new technology allows them to deploy police officers more effectively, in cases of demonstrations that threaten trouble or in order to reduce traffic to and from planned events. Officers say they analyze the live video that gets streamed to headquarters, looking for gaps in police coverage. Live broadcasts can also help stop a crime in progress.
"You've got to understand the advantage of having a helicopter in the sky. If you're a bad guy, you just can't get away," said Steve Yanke, a salesman at San Diego's Broadcast Microwave Services, a company that targets the police market. And at large events or political demonstrations, video cameras can scan the crowds, with officers monitoring broadcasts for faces of known troublemakers or terrorists. "It doesn't do any good to tape them and drag the tape back to headquarters to look at," said Yanke. "Those people move."
For some, police use of broadcast technology -- and video in general -- smacks of Big Brother-style meddling in citizens' private lives. Officers wielding cameras has a chilling effect on free speech and assembly rights, they say. "It discourages people from using their constitutional right to speak or to petition the government for rights and grievances," said Barry Steinhardt, associate director of the American Civil Liberties Union. Steinhardt said he worries that the new technology allows the police to analyze live footage with facial recognition software and create photographic databases of political activists and demonstrators. "If these people are criminals, fine. Let the police arrest them," he said. "But if they're political opponents of the mayor, the police have no business engaging in surveillance." Courts would take a dim view of such police actions, Steinhardt said.
Even before broadcast, police have long taken advantage of -- and been dogged by -- video recordings. Private videographers have drawn attention to police brutality, in cases such as the Rodney King beating in Los Angeles. And police have used video cameras to aid in prosecutions. Police routinely use cameras mounted inside patrol cars to film traffic stops. The tapes help officers contest brutality charges and win convictions. For example, an embarrassing videotape might be enough to convince a drunken driving suspect to plead guilty. "It keeps everyone honest," said Yanke.
Being so close to Hollywood, the Los Angeles Police Department (LAPD) became a police video pioneer, rolling cameras as early as 1972. Now, the department operates a sophisticated microwave network that employs transmitters in three ENG trucks and several helicopters. In Los Angeles, police use broadcast technology for crowd and traffic control at large events, such as the recent Emmy awards ceremony, said Larry Fugate, principal photographer with the LAPD's 11-person video unit. "They're not looking for criminals, per se -- although we have done that," said Fugate. Commanders at police headquarters monitor the broadcasts, asking the cameramen to focus on crowds and traffic situations in order to deploy officers more efficiently, Fugate said. "They'll say 'Look, there's a crowd forming on Fifth and Wall. We need a horse over there,'" said Fugate. "It allows a smaller police presence. We can put officers where they're needed."
In San Diego, police began live broadcasts when the Republican National Convention rolled into town in 1996. Camera operators on the ground and in helicopters beamed a stream of images to police headquarters, where commanders were able to monitor crowds, traffic and keep an eye out for troublemakers, said police spokesman Dave Cohen. At one point, the police transmission interfered with NBC's signal, and an NBC engineer had to help the police adjust their broadcast signal, Cohen said.
At Yanke's Broadcast Microwave Service, a company Web site illustrates the value of airborne broadcasting. A diagram on the page depicts a helicopter camera shooting video of a gunman holding hostages on a city bus. The helicopter is simultaneously broadcasting the video to an officer's nearby patrol car and a monitor in headquarters, where police commanders watch events unfolding. "Helicopter Video Down-Link systems for law enforcement are becoming a necessity," a caption states. "Immediate access to situational video gives ground-based supervisors the information they need to make tactical and manpower decisions during high-risk incidents."
For the most part, the microwave transmitters used by police are the same as those used by the media. But the broadcast frequencies lie in a portion of the spectrum reserved for law enforcement. Departments' first purchases tend to be equipment needed to transmit live from a helicopter to a central receiving site, usually at police headquarters, said Yanke. Armed with a helicopter transmitter, departments purchase ENG trucks and relay transmitters that can sit atop tall buildings and mountains and bounce the signal from the field to headquarters, Yanke said.
There are also covert uses for police broadcast technology, such as hidden cameras and microwave transmitters used for surveillance of criminal suspects. Salesmen for NS Microwave, a Spring Valley, Calif., company that caters to the police market, say they keep the more cloak-and-dagger microwave technology the company sells as secret as possible, so as not to compromise its effectiveness.
"We can't talk about it," said Louis Tabeek, a former New York Police Department officer who operates from an office in Staten Island. "A lot of [police departments] won't buy from you if you give out information." Among the company's products are video-equipped emergency command posts for city police departments that can receive live transmissions from helicopters and ENG trucks, which they also equip. The company also sells surveillance technology that allows police to monitor hidden cameras that broadcast over the Internet, using videoconferencing software. "It allows you to sit at your desk and basically watch people," said Bill Barlow, an NS Microwave salesman.
Automobile Association of America pulls its support for traffic cameras
One of the foremost advocates of traffic safety has withdrawn support for the District of Columbia's traffic camera enforcement program after city officials conceded revenue was a primary motivation. The Automobile Association of America (AAA), which supports the use of traffic cameras to enhance road safety, has rebuffed the city's plan to expand the program to earn more revenue. The Metropolitan Police Department collected $18,368,436 in fines through August 2002 with the automated red-light enforcement program, which was implemented in August 1999 to combat "the serious problem of red-light running."
"There is a mixed message being sent here. When using these cameras you should not have a vested interest in catching one person running a red light or speeding," said Lon Anderson, spokesman for AAA Mid-Atlantic. Mr. Anderson said that AAA brought attention to a camera that the automobile association deemed unfair on H Street Northeast adjacent to the Union Station garage exit. The camera was affixed at a location on a declining hill with a flashing yellow light that went to red without changing to a solid yellow. "Drivers didn't even know they were running a light. That camera issued 20,000 tickets before we caught it," Mr. Anderson said. He said the camera also caused its share of rear-end collisions, as opponents have contended since the first few months after the program began. "At the H Street camera, we noticed several near rear-end collisions" Mr. Anderson said. "There have been studies that show that red-light cameras can cause an increase of rear-end accidents, but there aren't any hard numbers yet."
He said he became furious when he read reports in The Washington Times a week ago quoting D.C. Mayor Anthony A. Williams as saying that the cameras were about "money and safety." The mayor is also reported to have said that the city was looking to expand the program, in part, to earn revenue to offset a projected $323 million budget deficit. Mr. Anderson said the mayor's comments made it appear as if the city had a dual policy on cameras and that they undercut the credibility of Police Chief Charles H. Ramsey's automated red-light enforcement program. "That is what happens when you're putting [on] pressure for numbers," he [Anderson] said. Until recently, both Mr. Williams and Chief Ramsey have said that the No. 1 goal of the cameras is to make the streets safer for motorists, pedestrians, and cyclists by targeting red-light violations and speed infractions.
The city also may be heading for a court fight, said Richard Diamond, spokesman for House Majority Leader Dick Armey, Texas Republican, a strong opponent of the cameras. A number of cases against the cameras have been filed in D.C. Superior Court, but "when the courts get a hint that the case is trying to attack the system it is immediately dismissed," the spokesman said. A recent report by the Insurance Institute for Highway Safety showed that red-light running in the District had dropped 64 percent since the cameras were set up. But Mr. Diamond and Mr. Anderson said that the report says nothing about the increased number of rear-end collisions that may have been caused by the cameras. Richard Retting, the insurance institute's senior transportation engineer, said such collision increases were not studied for the report but may be included in studies later. Mr. Anderson and Mr. Diamond said that drivers approaching red-light cameras are so afraid of being flashed that they slam on their brakes well short of intersections, surprising tailing motorists and causing accidents.
Mr. Diamond cited the camera problems last year in San Diego. A judge threw out almost 292 traffic tickets issued by automated red-light cameras last year, ruling that the city had given away too much police power to the private company running the devices. "The only reason we found out about the accident increases in San Diego is because the courts forced them to release all of the data," he said. It also was discovered that the city's vendor, Lockheed Martin IMS, placed some of the cameras too close to the intersection and reduced the yellow-light time. San Diego Police Chief David Bejarano later said that more accidents were reported at some camera intersections than prior to the red-light photo enforcement. And at some intersections there was no change in accident totals. All of the information on the cameras' lack of effectiveness came after the courts forced the police department to release all the data. "This is the only case where we have the full data and the cameras didn't work,"
Can satellite cameras really see individual people on the streets?
Commerical 'earth imaging' satellites can achieve resolutions of about 0.5m per pixel, which basically means if you had an object 2m across you would be seeing four pixels worth of information. This isn't enough to make out a person, just enough to determine that there might be an object in that square. However these satellites aren't sitting over any one country, that would be rather expensive, they orbit in patterns (like thread around a ball) to cover the whole earth over a period (perhaps revisiting the same point daily or even weekly). Companies sometimes buy images from these satellites but they have to book in advance with the operator or have to take an image from the archive.
The US government and some other very rich governments have very expensive satellites which are rumoured to be very high resolution but not much has been confirmed officially. The standard rumour was that those satellites could read a newspaper from space, but even these satellites don't sit in one place, they orbit around the world.
The US government and some other very rich governments have very expensive satellites which are rumoured to be very high resolution but not much has been confirmed officially. The standard rumour was that those satellites could read a newspaper from space, but even these satellites don't sit in one place, they orbit around the world.
Resolving power is limited by the wavelength of light used (lambda) and the aperture of the telescope on the satellite (D). It's called the Rayleigh limit and has been known for over a century.
Combine that with the minimum altitude of the satellite (h), to get the minimum feature size resolvable on the ground (I'll call it x), while looking straight down.
This is an optical limit. There is another limit which is the resolution of the focal plane array. One way to think about this is to imagine the focal plane pixels projected onto the ground through the telescope lens. If they were square, then we call the length of the side of that projected square the Ground Sample Distance (GSD).
Commercial satellites are limited to resolving 42 cm GSD by US law. The US enforces this on lots of folks. They don't enforce it on the Russians, who have the optics, satellite technology, and launchers to put into orbit a very competitive commercial satellite imagery service. However, the Russians choose not to do this. *shrug*
42 cm is good enough to put two pixels on a person from straight overhead. It's very hard to determine if there is a person in a picture from two pixels.
Some commercial satellites can resolve a little better than 42 cm. They are not allowed to ship data better than 42 cm GSD, except to the US government.
The NRO's KH-12 satellites (US government) have 2.4 meter apertures, have low perigees (and thus have to keep reboosting, which uses up onboard fuel), and are unconstrained legally, so they can resolve 8 cm. My guess is that they have a slightly oversampled focal plane with 5 cm GSD. They can definitely see individual people in the open, but can't see identifiable features. They could probably tell if someone was in a wheelchair though. They also have real-time downlink by relaying through higher-altitude satellites, and stabilization sufficient to shoot very small amounts of lower-resolution imagery of still objects at night.
Here is a handy table.
- Resolution
- Aperture Altitude Limit GSD Satellites
- PlanetLabs 9 cm 400 km 285 cm 300-500 cm 87
- RapidEye 14 cm 630 km 294 cm 650 cm 5
- Skybox 40 cm 600 km 101 cm 90 cm 1
- GeoEye 110 cm 681 km 42 cm 37 cm 7 (various)
- WorldView 3 110 cm 617 km 38 cm 31 cm 1
- KH-12 240 cm 290 km 8 cm 5 cm 3
If you’ve ever watched a grainy movie or noisy analog TV, you’re familiar with this - it’s much easier to recognize things in motion than from a single still frame.
For instance, there’s a bunch of people analyzing driving patterns in parking lots and city streets using fairly low resolution (1–2 meter) imagery from low res cameras and cheap low res satellite imagery. I can easily identify my red car in Google Earth images with 1 m resolution, but only because I know where it is - it’s more “I can confirm that there are a couple pixels consistent with a red car in the place where I know I parked”. But if I were to track that tiny blob of red pixels as it moved, I could probably construct a fairly accurate path for the car.
That said, unless they have a tracking transmitter in the money pack, it’s going to be tough to track them after they walk out the door.
Electronic Spying, Satellite Surveillance & Drones
Over the last several years, technology available to the homeowners association has exponentially grown. Drones have become the proverbial “Soup de Jour.” An increasing numbers of homeowners associations use drones to inspect common areas, architectural improvements, combustibles on balconies in high rises, etc. Is this good or bad? That depends on who you ask.
For associations with vast acreage, using drones to inspect the common area has become commonplace because it is less expensive and tends to be a more effective vehicle to inspect architectural improvements, open space, brush clearance, and various security issues. People inspections are more expensive, less effective and arguably more intrusive than a drone flying 200 feet above. As the quality of the cameras in drones improves, the use of drones promises to increase.
Drones, however, have a downside. One of the significant issues is inspection of balconies on high-rises. Instead of looking 200 feet down, a scenario which generally would not create an unreasonable intrusion, the drone’s cameras cannot help but be pointed directly into bedrooms and areas in which owners have an expectation of privacy. There is also a potential risk because drone pilots are not yet required to have proper training and occasionally crash drones. Most observers believe it is only a matter of time before a drone causes a fatal accident. The trend appears to be to limit and highly regulate the use of drones in urban settings.
The use of drones can also sometimes cause homeowner “push back.” Some residents view the use of a drone by an association or an association member as distasteful or even as an invasion of privacy. While we all suspect that the NSA is monitoring us by satellite and records all cell phones, emails, etc., the idea of an association using a drone may not sit well with a segment of some members. Legal or not, a drone sometimes creates a picture of “big brother” even more than a physical inspection by a person, despite the fact that an inspection by a person can be far more intrusive.
Drone use has been argued to violate Civil Code Section 1708.8, which, in general, outlines the elements for invasion of privacy. While perhaps distasteful, proper drone use will rarely result in a cause of action for invasion of privacy in an association. The covenants which dominate association living and applicable laws result in a lower expectation of privacy. In fact, the Davis-Stirling Common Interest Development Act, specifically Civil Code Section 5975, provides that both an association and each individual owner has the right to enforce the association’s governing documents. The enforcement process affords a right to inspect which is not otherwise available outside of an homeowners association. The proper use of drones to catch unapproved modifications and misuse of common area is fair game.
The trend is for more drone use by associations. The reason is economics. Properly operated drones flown several hundred feet above the properties provides a less intrusive and broad overview of common areas and lots than inspection by people. In the case of condominium balconies, which are hard to inspect, drones are particularly effective. There is currently a problem with lack of pilot training. In that regard, dozens of statutes and regulations are being considered by states, cities and the FAA.
Finally, no, you cannot shoot down drones which come within range of your shotgun. The military and certain governmental entities, however, purportedly can and do so. There is purportedly a current device which can, when merely pointed at a drone, overload its circuits, almost like an EMP blast.
With Closed-Circuit TV, Satellites And Phones, Millions Of Cameras Are Watching
one of the greatest threats to our democracy is gerrymandering, in which the party in power in a state redraws the map of election districts to give the advantage to that party's candidates. Since districts are redrawn only every 10 years following the census, gerrymandering can almost guarantee that the majority party will stay in power. There are a couple of gerrymandering cases currently before the Supreme Court. Draper has reported on gerrymandering, and we'll talk about that a little later.
"They Are Watching You - And Everything Else On The Planet" published in this month's National Geographic. It's about state-of-the-art surveillance from closed-circuit TV to drones and satellites and the questions these surveillance technologies raise about privacy. As part of his research, he spent time in surveillance control rooms in London. And he went to a tech company in San Francisco whose mission is to image the entire Earth every day. Draper is a contributing writer for National Geographic and a writer at large for The New York Times Magazine.
The award announcement had barely been completed, though, when dissenting grenades started landing at the satellite agency.
Lockheed Martin, infuriated by the decision, filed a protest, which froze the project for several months as the agency reviewed its decision.
Eventually, Lockheed Martin withdrew its protest. Dennis R. Boxx, the company’s senior vice president for corporate communications, said he could not comment on classified projects. But government and industry officials said the company stood down after the agency awarded it a consolation prize, a relatively small piece of the project.
Within a few months, two cost-estimating groups, one operated by the Pentagon, the other by the office that coordinates work among intelligence agencies, determined that the Boeing plan would bust the budget caps.
One of the electro-optical satellite’s most important components — a set of oversize gyroscopes that help adjust the spacecraft’s attitude for precision picture-taking — was flawed, said engineers involved in the project. The problem was traced to a subcontractor that had changed its manufacturing process for a crucial part, inadvertently producing a subtle but disabling alteration in the metallic structure that went undetected until Boeing discovered it, three years into the project.
Several kinds of integrated circuits for the electro-optical satellite also proved defective. Even rudimentary parts like electric cabling were unfit for use, several engineers said. Customized wiring did not conform to the orders and in some cases was contaminated by dirt.
As for the sister satellite, Mr. Nowinski said, “We thought the radar system would be a piece of cake.”
But the plans were impeded by unexpected difficulties in increasing the strength of the radar signals that would be bounced off the earth. The problem, among other things, involved a vacuum-tube device called a traveling wave tube assembly. Perhaps most surprising was the appearance of parts containing tin, forbidden because it tends to sprout tiny irregularities, known as “tin whiskers,” in space. One military industry executive said he was astounded when, several years into the project, he got a form letter from Boeing telling suppliers not to use tin.
“That told me there had been a total breakdown in discipline and systems engineering on the project,” he said, “and that the company was operating on cruise control.”
Signs of a Project in Trouble
The tight schedule called for the radar-imaging satellite to be delivered in 2004 and its sister spacecraft the next year. Three years before that first deadline, government and industry officials say, it was becoming clear that the project was in trouble.
As costs escalated, Boeing cut back on testing and efforts to work several potential solutions to difficult technical problems. If a component failed, Boeing, lacking a backup approach, had to return to square one, forcing new delays.
Yet the company hesitated to report setbacks and ask for additional financing.
“When you’ve got a flawed program, or a flawed contract, you really have an obligation to go the customer and tell them,” Mr. Young said. “Boeing wasn’t doing that.”
The reason, according to an internal reconnaissance office post-mortem, was the budget cap, and the steep financial penalties for exceeding it. “The cost of an overrun was so ruinous that the strongest incentive it provided to the contractor was to prove they were on cost,” the post-mortem found.
It did not help that the government ordered two major and several minor design changes that added $1 billion to cost projections. The changes, government and industry officials said, were intended to give the electro-optical satellite the flexibility to perform additional functions.
It was against this backdrop that Mr. Teets, the satellite agency’s new director, formed the review group in May 2002 that recommended pressing on and seeking new financing.
The next year, the government ordered up another look at the project, as part of a broader examination of failing military space programs. The study, led by Mr. Young, reported that F.I.A. was “significantly underfunded and technically flawed” and “was not executable.”
By this time, the government had approved an additional $3.6 billion. Still, rather than recommending cancellation, the Young panel said the program could be salvaged with even more financing and changes in the program and schedule.
In an interview, Mr. Young said the panel genuinely thought the project could be saved. Several members, though, said the group should have called for ending the program but stopped short because of its powerful supporters in Congress and the Bush administration. Among the most influential was Representative Jane Harman, the ranking Democrat on the House Intelligence Committee, whose Southern California district includes the Boeing complex where the satellites were being assembled.
The death sentence for F.I.A. was finally written in 2005. Another review board pronounced the program deeply flawed and said propping it up would require another $5 billion — raising the ante to $18 billion — and five more years. And even with that life support, Mr. Fitzgerald recalled, the panel was not confident that Boeing could come through.
That September, the director of national intelligence, John D. Negroponte, killed the electro-optical program on the recommendation of the reconnaissance office’s new director, Donald M. Kerr. Lockheed was engaged to reopen its production line and build an updated model of its old photo satellite.
Government officials say the delivery date for that model has slipped to 2009. Late last year, a Lockheed satellite carrying experimental imagery equipment failed to communicate with ground controllers after reaching orbit, rendering it useless.
Boeing calculated that its revenue losses from the cancellation would total about $1.7 billion for 2005 and 2006, less than 2 percent of forecast revenues. Having kept the radar-satellite contract, the company is expected to deliver the first one in 2008 or early 2009, at least four years behind the original schedule.
The Search for Lessons
The satellite agency and military experts are still sifting through the wreckage, looking for lessons — beyond the budget issues — that would prevent a similar meltdown in the future.
How powerful are the cameras on modern spy satellites?
. In the 1970’s a US spy satellite program was made, before the internet really became much of a thing. Codenamed Hexagon, the 20 satellites had better resolution than Google Earth does today. Why? They were huge, about the size of a school bus.

Plus, there was no real communication, so they had to drop buckets full of film down into the atmosphere, onto specially designed nets carried by aircraft. Imagine what could happen now, with the NSA’s new NROL satellites. “The NSA is coming, to toowwwwnn! They know when you are sleeping, they know when you’re awake, they know if you’re good or bad so be good for your own sake!”-Edward Snowden
KH-9: 762mm aperture, 160 x 250km orbit, 700 nm light => 18 cm resolution (Rayleigh limit). The low orbit was possible because the satellite had a lifetime of just 18 months. Operational 1972–1986.
KH-11: 2400mm aperture, 256 x 1006km orbit, 700 nm light => 9 cm resolution (Rayleigh limit). These are what the U.S. uses today, although the name has changed. These satelllites stay up for a decade and so must fly higher to reduce atmospheric drag.
In metro areas, Google Maps and Apple are both substantially better than either of these. That’s not so amazing: Google and Apple collect imagery with light airplanes flying under 10,000 feet, around 100 times closer than the KH-11. So they need only 1% of the aperture. The lens on your DSLR is good enough for that.
The KH-11 gets regular imagery from denied airspaces, where Google and Apple have nothing at all. That’s the value.
When the military wants better resolution of an area under accessible airspace, they use a DB-110 pod mounted on an airplane, or a Wescam MX-15mounted on a Predator drone. Either is capable of 2 cm resolution from acceptable standoff distances. If you got shot by a drone during Obama’s tenure, chances are there was one of these, circling overhead, for months beforehand.
The trouble with KH-11 imagery is that the bad guys know when the satellites are overhead. Some western armed units train to cover up during satellite passes, so that they can’t be tracked, so I assume the bad guys do as well. The U.S. has been developing the RQ-170 to provide imagery similar to what comes from the Predator, from denied airspace. It’s a big drone (65 foot wingspan), so it will be capable of very long-duration (cross-continent) flights. One of these has already been captured by the Iranians. Oops.
Here is what a state-of-the-art Leica aerial camera is capable of. Google Earth imagery is not this good, because the many flights required would be expensive. Apple is shooting 5 cm GSD for their imagery.
Leica ADS100: 30mm aperture, 720 m altitude, 550 nm light => 1.6 cm resolution, sampled at 3.0 cm GSD (sensor resolution limit). These systems cost $1.3m, so you might wonder why people use them instead of a DSLR if the latter can take pictures that are just as good. The Leica has a horizontal swath of 20,000 pixels, approximately what you'd get from a 300 megapixel DSLR. As those aren't available, some folks use lots of DSLRs, but that leads to registration problems. For Apple and Google that's fine, they put a few programmers on the problem for a few years and it's managed. For a small operation running just a few cameras, it makes more sense to pay Leica.
Typical non-metro Google Earth imagery is 15 cm (6 inch) GSD, which is similar to the KH-9. There is also a fair bit of 30 cm (12 inch) GSD imagery, and in places where Google can’t put airplanes, there is 1 meter resolution stuff and worse from commercial satellites. The 15 cm GSD imagery is better than the KH-9 because the digital sensors used are more sensitive and have better dynamic range than the film used by the KH-9. For the film purists out there who want to insist that film has better dynamic range than digital, please remember that you are thinking of Fuji Velvia or somesuch. The film the KH-9 used was optimized for absolute low-light sensitivity, and so had larger grains and less dynamic range.
Google Earth imagery is shot with visible light, which is why I used 550 nm (green) above. Spysats in the past used panchromatic (grey scale) sensors, which picked up light centered around deep red, which is why I used 700 nm above. The longer wavelength trades away some resolution for reduced haze and scattering, which improves their signal to noise ratio. It’s possible imaging spysats have changed the wavelengths used, but I think that the advances there have been in 3-5 and 8–12 micron infrared imagery shot at night, which would have 10x worse resolution that what I listed above.
Bottom line, some of the Google Earth imagery is worse than what spysats were doing, but in metropolitan areas it’s mostly better than spysats did.
Optical sieve technology holds the promise of ~10 meter aperture space telescopes, and so ~2 cm resolution from orbit. There are many problems, including sensitivity, durability, stabilization and really motion of any kind, etc. These will probably deploy before I’m aware of a specific mission but my guess is that they are not up there yet.
in Google Earth you can spot cars and in some cases, can barely make out individual human forms. That is a measure of the optical spy satellite’s “resolution”. In this case, maybe 20cm–30cm which means they can differentiate distinct objects that size.
Today's optical satellites have much greater resolution. How does being able to read license plates grab ya? Or even being able to read the newspaper in your lap (under the right conditions) !!
Then top it all off with radar satellites that can see in the dark, through clouds and even discern the layout of underground bunkers. That's right, they can see what is both on and under the ground 24/7 regardless of weather.
Then, though not exactly satellites, both the U2 and J-Stars aircraft can cover huge swaths of surface area. It's not unheard of for a U2 to do photo reconnaissance of hundreds of square miles in a single passand add to that, the J-Stars, using radar is able to discern any moving object on the ground for hundreds of square miles as well !!
XO___XO DW Satellites
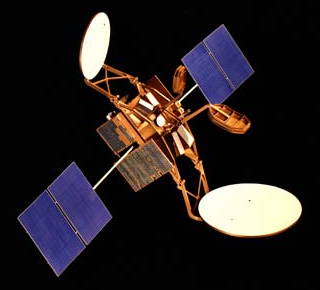
Eyes in the sky, space mirrors bouncing phone calls round Earth, heavenly compasses helping us home—these are just three of the things that satellites do for us. When you gaze through the clouds on a brilliant blue day, you might catch sight of a plane or two leaving vapor trails in its wake. But you're unlikely to see all the thousands of meticulously engineered satellites, some as small as your hand, some as huge as trucks, spinning in orbits high above your head. "Out of sight, out of mind" is probably one of the reasons we take satellites for granted, even though they play a crucial part in everything from TV broadcasting and transcontinental telephone calls to weather forecasting and the Internet.
What is a satellite?
A satellite doesn't necessarily have to be a tin can spinning through space. The word "satellite" is more general than that: it means a smaller, space-based object moving in a loop (an orbit) around a larger object. The Moon is a natural satellite of Earth, for example, because gravity locks it in orbit around our planet. The tin cans we think of as satellites are actually artificial (human-built) satellites that move in precisely calculated paths, circular or elliptical (oval), at various distances from Earth, usually well outside its atmosphere.
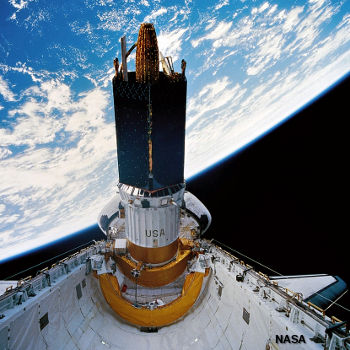
Photo: The Space Shuttle launches a communications satellite from its payload bay in 1984 by spinning it gyroscopically. You can see Earth to the left. Picture courtesy of NASA Johnson Space Center (NASA-JSC).
We put satellites in space to overcome the various limitations of Earth's geography—it helps us step outside our Earth-bound lives. If you want to make a phone call from the North Pole, you can fire a signal into space and back down again, using a communications satellite as a mirror to bounce the signal back to Earth and its destination. If you want to survey crops or ocean temperatures, you could do it from a plane, but a satellite can capture more data more quickly because it's higher up and further away. Similarly, if you want to drive somewhere you've never been before, you could study maps or ask random strangers for directions, or you could use signals from satellites to guide you instead. Satellites, in short, help us live within Earth's limits precisely because they themselves sit outside them.
What do satellites do for us?
We tend to group satellites either according to the jobs they do or the orbits they follow. These two things are, however, very closely related, because the job a satellite does usually determines both how far away from Earth it needs to be, how fast it has to move, and the orbit it has to follow. The three main uses of satellites are for communications; photography, imaging, and scientific surveying; and navigation.
Communications
Communications satellites are essentially used to relay radio waves from one place on Earth to another, catching signals that fire up to them from a ground station (an Earth-based satellite dish), amplifying them so they have enough strength to continue (and modifying them in other ways), and then bouncing them back down to a second ground station somewhere else. Those signals can carry anything radio signals can carry on the ground, from telephone calls and Internet data to radio and TV broadcasts. Communications satellites essentially overcome the problem of sending radio waves, which shoot in straight lines, around our curved planet—intercontinental signals, in other words. They're also useful for communicating to and from remote areas where ordinary wired or wireless communications can't reach. Calling with a traditional landline (wired phone), you need a very convoluted network of wires and exchanges to make a complete physical circuit all the way from the sender to the receiver; with a cellphone, you can communicate anywhere you can get a signal, but you and the receiver both still need to be within range of cellphone masts; however, with a satellite phone, you can be on top of Mount Everest or deep in the Amazon jungle. You're entirely free from any kind of telecommunications "infrastructure," which gives you geographic freedom and an instant ability to communicate (you don't have to wait for someone to string up telephone lines or set up cellphone masts).
The best known modern communications satellite systems are probably INMARSAT and INTELSAT. INMARSAT was originally a satellite system for ships, planes, and other travelers, though it now has many other uses as well. INTELSAT is an international consortium that owns and operates several dozen communications satellites that provide things like international broadcasting and satellite broadband Internet.
How do communications satellites work?
What do they do?
Communications satellites are "space mirrors" that can help us bounce radio, TV, Internet data, and other kinds of information from one side of Earth to the other.
Uplinks and downlinks
If you want to send something like a TV broadcast from one side of Earth to the other, there are three stages involved. First, there's the uplink, where data is beamed up to the satellite from a ground station on Earth. Next, the satellite processes the data using a number of onboard transponders (radio receivers, amplifiers, and transmitters). These boost the incoming signals and change their frequency, so incoming signals don't get confused with outgoing ones. Different transponders in the same satellite are used to handle different TV stations carried on different frequencies. Finally, there's the downlink, where data is sent back down to another ground station elsewhere on Earth. Although there's usually just a single uplink, there may be millions of downlinks, for example, if many people are receiving the same satellite TV signal at once. While a communications satellite might relay a signal between one sender and receiver (fired up into space and back down again, with one uplink and one downlink), satellite broadcasts typically involve one or more uplinks (for one or more TV channels) and multiple downlinks (to ground stations or individual satellite TV subscribers).
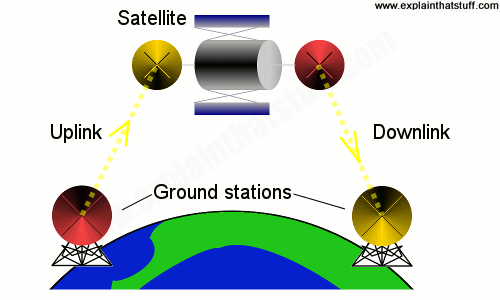
Artwork: Communications satellites bounce signals from one side of Earth to the other, a bit like giant mirrors in space. A ground-based satellite transmitter dish (red) beams a signal to the satellite's receiving dish (yellow). The satellite boosts the signal and sends it back down to Earth from its transmitter dish (red) to a receiving dish somewhere else on Earth (yellow). Since the whole process happens using radio waves, which travel at the speed of light, a "satellite relay" of this kind usually takes no more than a few seconds, at most. The various transmitters and receivers on the satellite and on Earth are examples of antennas.
Satellites are like any other vehicle inasmuch as they have two main parts: the generic vehicle itself and the specific thing it carries (the payload) to do its unique job. The "vehicle" part of a satellite is called the bus, and it includes the outer case, the solar panels and batteries that provide power, telemetry (a remote-controlled system that sends monitoring data from the satellite to Earth and operational commands back in the other direction), rocket thrusters to keep it in position, and reflective materials or other systems ("heat pipes") to protect it from solar radiation and dissipate heat. The payload might include transponders for a communications satellite, computers and atomic clocks to generate time signals for a navigation satellite, cameras and computers to images back to digital data for a photographic satellite, and so on.
What's inside a satellite?
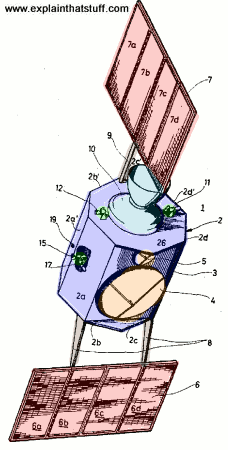
Artwork: Communications satellite. From US Patent: #3,559,919: Active communication satellite, courtesy of US Patent and Trademark Office.
These are amazingly complex and expensive machines with tons of electronic bits and pieces jammed into them, but let's not get too bogged down in the details: the basic idea is very simple. In this outside view of a typical satellite, from a patent filed in 1968 by German engineer Hans Sass (US Patent: #3,559,919: Active communication satellite), you can see all the main bits and it's easy to figure out what they do.
I've left the original numbers on the diagram and I won't bother to label them all, since some are obvious and some are duplicates of others. The most interesting bits are the fold-out solar panels that power the satellite, the sending and receiving antennas that collect signals coming up from Earth and send them back down, and the motors and engines that keep the satellite in exactly the right position at all times:
4: Large parabolic dish antenna for sending/receiving signals. (Orange)
5: Small parabolic dish antenna for sending/receiving signals. (Orange)
6: Lower solar "battery" of four solar panels. (Red)
7: Upper solar "battery" of four more solar panels. (Red)
8: Supports fold out the lower solar panels once the satellite is in orbit. (Gray-brown)
9: Supports fold out the upper solar panels. (Gray-brown)
10: Main satellite rocket motor. (Light blue)
11, 12, 15, 17: Small control engines keep the satellite in its precision position, spin, and orbit. (Green)
Photography, imaging, and scientific surveying

Photo: Satellite photography has revolutionized map-making. This is Havana, Cuba photographed by the Landsat satellite. Picture courtesy of NASA Landsat program.
Not so many years ago, newspapers used to run scare stories about spy satellites high in space that could read newspapers over your shoulder. These days, we all have access to satellite photos, albeit not quite that detailed: they're built into search engines like Google and Bing, and they feature routinely on the news (giving us an instant visual impression of things like disappearing rainforestsor tsunami destruction) and weather forecasts. Scientific satellites work in a similar way to photographic ones but, instead of capturing simple visual images, systematically gather other kinds of data over vast areas of the globe.
There have been many interesting scientific satellite missions over the last few decades. NASA's TOPEX/Poseidon and Jason satellites, for example, have routinely measured sea levels since the early 1990s. SeaWiFS (active until 2010) scanned the color of the ocean to measure plankton and nutritional activity in the sea. As its name suggests, a weather satellite called TRMM (Tropical Rainfall Measuring Mission) monitored rain near the equator from 1997 through 2015. As of 2016, NASA listed 25 ongoing satellite missions on its website, including CALIPSO (which studies how clouds and aerosols interact); Nimbus (a long-running scientific study of weather and climate using satellite data); and, the longest-running and perhaps best known scientific satellites of all-time, Landsat, a series of eight satellites that have been continuously mapping and monitoring changes in land use across Earth since 1972.
Navigation
Finally, most of us with GPS-enabled cellphones and "sat-nav" devices in our cars are familiar with the way satellites act like sky compasses; you'll find GPS, Glonass, and similar systems discussed in much more detail in our article about satellite navigation.
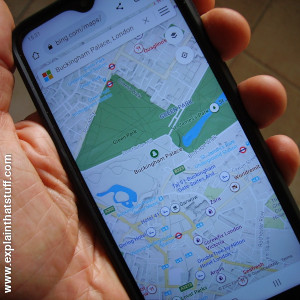
Photo: Where am I, where am I going, and how will I get there? Most of us with smartphones take satellite navigation for granted.
Satellite orbits
One of the most surprising things about satellites is the very different paths they follow at very different heights above Earth. Left to its own devices, a satellite fired into space might fall back to Earth just like a stone tossed into the air. To stop that happening, satellites have to keep moving all the time so, even though the force of gravity is pulling on them, they never actually crash back to Earth. Some turn at the same rotational rate as Earth so they're effectively fixed in one position above our heads; others go much faster. Although there are many different types of satellite orbits, they come in three basic varieties, low, medium, and high—which are short, medium, and long distances above Earth, respectively.
Low-Earth orbits
Scientific satellites tend to be quite close to Earth—often just a few hundred kilometers up—and follow an almost circular path called a low-Earth orbit (LEO). Since they have to be moving very fast to overcome Earth's gravity, and they have a relatively small orbit (because they're so close), they cover large areas of the planet quite quickly and never stay over one part of Earth for more than a few minutes. Some follow what's called a polar orbit, passing over both the North and South poles in a "loop" taking just over an hour and a half to complete.
Medium-earth orbits
The higher up a satellite is, the longer it spends over any one part of Earth. It's just the same as jet planes flying over your head: the slower they move through the sky, the higher up they are. A medium-Earth orbit (MEO) is about 10 times higher up than a LEO. GPS navstar satellites are in MEO orbits roughly 20,000 km (12,000 miles) above our heads and take 12 hours to "loop" the planet. Their orbits are semi-synchronous, which means that, while they're not always exactly in the same place above our heads, they pass above the same points on the equator at the same times each day.
High-Earth orbits
Many satellites have orbits at a carefully chosen distance of about 36,000 km (22,000 miles) from the surface. This "magic" position ensures they take exactly one day to orbit Earth and always return to the same position above it, at the same time of day. A high-Earth orbit like this is called geosynchronous (because it's synchronized with Earth's rotation) or geostationary (if the satellite stays over the same point on Earth all the time). Communications satellites—our "space mirrors"—are usually parked in geostationary orbits so their signals always reach the satellite dishes pointing up at them. Weather satellites often use geostationary orbits because they need to keep gathering cloud or rainfall images from the same broad part of Earth from hour to hour and day to day (unlike LEO scientific satellites, which gather data from many different places over a relatively short period of time, geostationary weather satellites gather their data from a smaller area over a longer period of time).
Small satellites
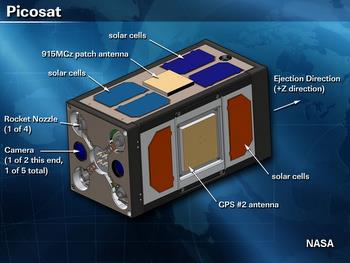
Artwork: The smallest satellites are about the same size as squared-off tennis balls. This slightly bigger one has miniaturized antennas, a camera, solar cells, and rockets packed into a box measuring 13 × 13 × 25cm (5 ×5 × 10in) and weighs 3.7kg (8lb). It was the very last satellite launched from the Space Shuttle Atlantis when it flew its final mission, STS-135, in July 2011. Photo courtesy of NASA.
Think of a space satellite and you'll probably think of a giant shiny can roughly the size of a truck. But not all satellites are so big. In the last two decades, ingenious engineers have been experimenting with tiny space-bound instruments that are smaller, simpler, cheaper, bolder, more experimental, and less risky to launch. In 1999, Bob Twiggs, then a professor at Stanford University, kicked off this downshifting trend when he proposed CubeSat, a satellite built from standardized modules in 10cm cubes, though even smaller satellites have been built since then. Today, it's quite common to read about picosats (generally weighing up to 1kg), nanosats (up to 10 kg), microsats (up to 100kg) and minisats (up to 500 kg). In 2017, NASA launched the world's smallest picosat, weighing just 64g, packed into a 3.8cm cube, and entirely manufactured using a 3D-printer. Will satellites get even smaller in future? Not so fast! There are serious concerns that picosats are too small to monitor properly and could present a major risk to other spacecraft if they turn into unpredictable space debris.
Who invented satellites?
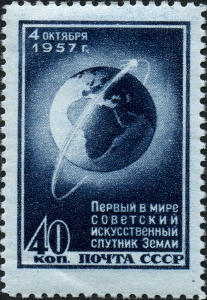
Artwork: Soviet engineers were the first to build a working satellite, Sputnik, and put it into space in 1957. Stamps like this celebrated that stunning achievement. Artwork believed to be in the public domain, courtesy of Wikimedia Commons.
The idea of using a satellite as a mirror in space—to bounce signals from one side of Earth to the other—was "launched" in 1945 by science fiction author Arthur C. Clarke (1917–2008), who wrote two hugely influential articles setting out his plan in detail (one was unpublished, the other published as "Extra-Terrestrial Relays: Can Rocket Stations Give World-Wide Radio Coverage?" in Wireless World, October 1945). His proposal was to place three satellites in a geosynchronous orbit 35,000km (23,000 miles) above Earth, spaced out evenly to cover about a third of the planet each: one would cover Africa and Europe, a second would cover China and Asia, and a third would be dedicated to the Americas. Although Clarke didn't patent the geostationary communications satellite, he is generally credited with its invention, even though other space pioneers (notably German wartime pioneer Herman Oberth) had proposed similar ideas years before.
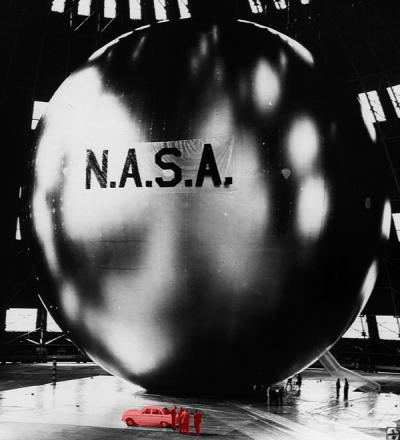
Photo: Echoes of history: Designed by NASA, the Echo communications satellite was a giant mylar balloon some 30m (100ft) in diameter designed to sit in space and bounce signals back like a mirror. You can see how big it is from the size of the car and people at the bottom, which I've colored red to help you pick them out. Picture courtesy of NASA on The Commons.
It took another decade for Clarke's bold plan to move toward reality. First, satellites themselves had to be proved viable; that happened with the launch of the Russian Sputnik 1 in October 1957. Three years later, when the Echo communications satellite was launched, engineers successfully demonstrated that radio telecommunications signals could be relayed into space and back, just as Clarke had predicted. Telstar, the first communications satellite, was launched in July 1962 and immediately revolutionized transatlantic telecommunications. During the mid-1960s, 11 nations came together to form INTELSAT (International Telecommunications Satellite Consortium), which launched the world's first commercial communications satellite INTELSAT 1 ("Early Bird"), in geosychronous orbit, in April 1965. This modest little space machine was a tiny electronic miracle: weighing just 35kg (76 lb), it could transmit 240 telephone simultaneous calls or a single black-and-white TV channel.
Block Diagram of Satellite
![Block diagram of a typical satellite [15].](https://www.researchgate.net/profile/Walter_Dos_Santos/publication/225144769/figure/fig1/AS:302635551870976@1449165346250/Block-diagram-of-a-typical-satellite-15.png)
systems are complex systems designed to perform specific functions for a specified design life. Satellite projects, for instance, demand lots of resources, from human to financial, as well accounting for the impact they play on society. This requires good planning in order to minimize errors and not jeopardize the whole mission. Therefore satellite conceptual design plays a key role in the space project lifecycle as it caters for specification, analysis, design and verification of systems without actually having a single satellite built. Conceptual design maps client needs to product use functions and is where functional architecture (and sometimes the physical architecture) is decided upon. Moreover, the lack of a clear vision of the satellite architecture hinders team understanding and communication, which in turn often increases the risk of integration issues. The conceptual satellite design phase has been lacking efficient support. By employing SysML as a satellite architecture description language, this enables information reuse between different satellite projects as well as it facilitates knowledge integration and management over systems engineering activities. One of them is requirements engineering, more specifically requirements management and tracebility. This is an important phase in the life cycle of satellite systems. This work shows the main advantages of having user requirements being graphi- cally modeled, their relationships explicitly mapped, and system decomposition considered in the early system development activities. In addition, requirements traceability is enhanced by using the SysML Requirements tables. The approach is illustrated by a list of user requirements for the ITASAT satellite. Furthermore, in order to mitigate risks, this work also proposes a software tool, named SatBudgets that supports XML Metadata Interchange (XMI) information exchange between a satellite SysML model and its initial requirements budgetings via a rule-based knowledge database captured from satellite subsystems experts. This work is organized as follows. Section 2 presents a short introduction to satellites and to SysML as an architecture description language. Section 3 shows the SysML satellite modeling. Section 4 covers the SysML satellite requirements engineering. Section 5 introduces the SatBudgets software tool to illustrate information reuse and integration in this domain and Section 6 describes further future work. Finally, Section 7 summarizes this research report. This background section presents an overview of the satellite and SysML which will be important for the paper context. A satellite has generally two main parts: (1) The bus or platform where the main supporting subsystems reside; and (2) The payload, the part that justifies the mission. A typical satellite bus has a series of supporting subsystems as depicted in Figure 1. The satellite system is built around a system bus also called the On- Board Data Handling (OBDH) bus. The bus, or platform, is the basic frame of the satellite and the components which allow it to function in space, regardless of the satellite’s mission. The control segment on the ground monitors and controls these components. The platform consists of the following components: (1) Structure of the satellite; (2) Power; (3) Propulsion; (4) Stabilization and Attitude Control; (5) Thermal Control; (6) Environmental Control; and (7) Telemetry, Tracking and Command. System modeling based on an architecture description language is a way to keep the engineering information within one information structure. Using an architecture description language is a good approach for the satellite systems engineering domain. Architectures represent the elements implementing the functional aspect of their underlying products. The physical aspect is sometimes also represented, for instance when the architecture represents how the software is deployed on a set of computing resources, like a satellite. SysML is a domain-specific modeling language for systems engineering and it supports the specification, analysis, design, verification and validation of various systems and systems-of-systems [16]. It was developed by the Object Management Group (OMG) [10] in cooperation with the International Council on Systems Engineering (INCOSE) [7] as a response to the request for proposal (RFP) issued by the OMG in March 2003. The language was developed as an extension to the actual standard for software engineering, the Unified Modeling Language (UML) [17] also developed within the OMG consortium. Basically, SysML is used for representing system architectures and linking them with their behavioral components and functionalities. By using concepts like Requirements, Blocks, Flow Ports, Parametric Diagrams and Allocations, it is simple to achieve a profitable way to model systems. A comparison between SysML1.0 to UML2.0 regarding re-use is presented in Figure 2. It summarizes the various diagrams available in SysML [16]. This work explores some of the SysML capabilities through an example, the ITASAT student satellite system [3]. The application of SysML presented in this work covers only some the diagrams available in SysML due to paper scope and page restrictions. Systems Engineering attacks the problem of design complexity of engineering products as it grows larger, more complex and are required to operate as part of a system. The approach taken is formal and systematic since the great complexity requires this rigor. Another feature of systems engineering is its holistic view and it involves a top-down synthesis, development, and operation. This suggests the decomposition of the system into subsystems and further into components [4]. Space Systems Engineering is a subclass of the previous mentioned in the sense that it is primarily concerned with space systems, e.g. satellite systems. Therefore it deals with the development of systems, including hardware, software, man-in- the-loop, facilities and services for space applications. The satellite conceptual stage follows the transformation of customer needs into product functions and use cases, and precedes the design of these functions across the space engineering disciplines (for example, mechanical, electrical, software, etc.). Model-Driven Engineering (MDE) is the systematic use of models as pri- mary engineering artifacts throughout the engineering lifecycle [13]. MDE can be applied to software, system, and data engineering. MDE technologies, with a greater focus on architecture and corresponding automation, yield higher levels of abstraction product development. This abstraction promotes simpler models with a greater focus on the problem space. Combined with executable semantics this elevates the total level of automation possible. This work argues that MDE is quite suitable for information reuse and integration as will be shown later. SysML allows incrementally refinable description of conceptual satellite design and product architecture. This helps systems engineers which are concerned with the overall performance of a system for multiple objectives (e.g. mass, cost, and power). The systems engineering process methodically balances the needs and capabilities of the various subsystems in order to improve the systems performance, deliver on schedule and on expected cost. SysML elements in the design represent abstractions of artifacts in the various engineering disciplines involved in the development of the system. The design represents how these artifacts collaborate to provide the product functionalities. The size, volume, and mass constraints often encountered in satellite development programs, combined with increasing demands from customers to get more capability into a given size, make systems engineering methods particularly important for this domain. This paper explores some of the diagrams available in SysML through the example of the ITASAT satellite system by basically, exploring the block diagram and top-level requirement diagram, both shown in short detail. SysML diagrams allow information reuse since they can be employed in other similar satellite projects by adapting and dealing with project variabilities. An exploration of these features for the on-board software design of satellites is shown in [5]. SysML allows the utilization of use case diagrams which were inherited from the UML without changes [2]. The use case diagram has been widely applied to specify system requirements. The interaction between ITASAT actors and some key use cases is shown in Figure 3. This diagram depicts five actors and how they relate to the use cases that they trigger in the high-level system view. The figure still describes schematically the composition of a series of low-level use cases hierarchically modeled by employing an include dependancy relationship between them. SysML also allows the representation of test use cases which will be further ex- plored in the validation, verification and testing project phases. Figure 3 depicts, as an example, the Test On-Board Managemente Functions use case and how its include dependancies are related to other two test use cases, Test Other On-Board Functions and, Test Power Supply Functions . The SysML block diagram is used to show features and high-level relationships. It is used to allow systems engineer to separate basically the responsibilities of the hardware team from the software team. Figure 4 shows the various ITASAT blocks and their interdependencies. The requirements diagram plays a key role into the SysML model as requirements present in this diagram can also appear in other SysML diagrams linking the problem and solution spaces. Furthermore, the requirements diagram notation provides a means to show the relationships among requirements including constraints. This topic is of high importance to this work hence it is further developed in the next section. The process of requirements engineering involves various key activities, such as elicitation, specification, prioritization and management of requirements. Model- driven requirements engineering approach has been employed in other domains [9]. By using SysML, this section applies this to the satellite conceptual design. The SysML standard identifies relationships that enable the modeler to relate requirements to other requirements as well as to other model elements [16]. Figure 5 shows a simplified view of the ITASAT requirement tree structure [3]. It also shows how a constraint is attached to a low-level requirement and how traceability may be established. After top-level requirements are ellicited, then starts the decomposition of every system requirement into progressively lower levels of design. This is done by defining the lower-level functions which determine how each function must be performed. Allocation assigns the functions and its associated performance requirements to a lower level design element. Decomposition and allocation starts at the system level, where requirements derive directly from the mission needs, and then proceeds through each segment, subsystem, and component design levels [8]. This process must also warrant closure at the next higher level meaning that satisfying lower-level requirements warrants performance at the next level. Additionally, it roundtrips all requirements tracing back to satisfying mission needs. Managing requirements is the capability of tracing all system components to output artifacts that have been resulted from their requirement specifications (forward tracing) as well as the capability of identifying which requirement has generated a specific artifact or product (backward tracing) [12]. The great difficulty on tracing requirements is responding the following questions: What to track? and How to track? . One can say that a requirement is traceable when it is possible to identify who has originated it, why it exists, mation . These information is used to identify all requirement \ elements affected by project changes. The specification of requirements can facilitate the commu- nication between the various project stakeholder groups. There are several published works on requirement engineering and the most common way they employ to requirement tracking is by posing basic questions about the underlying domain [1]. Unfortunately, such questionaire does not offer generally any classification on the sufficient elements in order to identify all model elements. By using a SysML requirements diagram, system requirements can be grouped, which contributes to enhance project organization showing explicitly the various relationship types between them [14]. These include relationships for defining requirements hierarchy or containment, deriving requirements, satisfying requirements, verifying requirements and refining requirements [11]. Moreover, the SysML requirements diagram can be employed to standardize how requirements are documented following all their possible relationships. This can provide systems specification as well as be used for requirements modeling. New requirements can be created during the requirement analysis phase and can be related to the existing requirements or complement the model. Figure 6 presents an excerpt from the ITASAT requirements diagram which utilizes the deriveReqt relationship type showing the derived Satellite State requirement from the source Telemetry Design requirement inside the Operability re- quirement SysML package. This allows, for example, a link between high-level (user oriented) and low-level (system oriented) requirements which contributes to explicitly relates the dependency of user requirements mapped into systems requirements. Similarly, Figure 7 presents another excerpt from the ITASAT power subsystem requirements diagram which utilizes three relationships. Requirements are abstract classes with no operations neither attributes. Subrequirements are related to their “father” requirement by utilizing the containment relationship type. This is shown in Figure 7 as many subrequirements from the Power Supply Requirements requirement are connected employing containment relationships. The “father” requirement can be considered a package of embedded requirements. Additionally, Figure 7 presents the satisfy relationship type which shows how a model satisfies one or more requirements. It represents a dependency relationship between a requirement and a model element, in this case the Power Supply Functions use case is satisfied by the Power Supply Requirements . Finally, it is shown the verify relationship type where the Test Power Supply Functions test use case is verified by the functionalities provided by the Power Supply Requirements . This may include standard verification methods for in- spection, analysis, demonstration or test. Lastly, SysML allows requirements traceability by using tabular notations. This allows model elements to be traced in SysML via requirements tables which may contain fields like: identifier (ID), name, which requirement is related to it, what type of relationship is held among them. One such SysML tabular notation for requirements traceability is shown in Figure 8 which is suitable for cross-relating model elements. The figure shows a requirement matrix table where cross-tracing is done between requirements, blocks defined in the ITASAT block diagram and high-level use cases. This table is quite important as it allows requirements traceability towards issues like: – Understanding of requirements origin; – Project scope management; – Requirements change management; – Impact analysis of requirement changes; – Impact analysis of requirement test failures (i.e., if a test fails then a requirement may not be met); – Verification if all system requirements are mapped into implementation and; – Validation if the final application only performs what it was previously expected. Additionally, requirements can be traced also by navegating through SysML requirement diagrams on the anchors points shown in Figure 7 by means of stand- out notes. The anchors contain information like the relationship type and with which model element the requirement is related and vice-versa, given a model element it may reference all requirements related to this element. Doing so, it allows a quick and simple way to identify, prioritize and improve requirements traceability. The resources provided by the SysML are by far beyond the capabilities here presented due to paper page constraint. After requirements analysis, starts the performance budgeting phase. As a case study, this work describes how a software tool, named SatBudgets, supports XMI information exchange between a satellite SysML model and its initial requirements budgetings. The software engineering activities for the SatBudgets tool are described hereafter. The workflow of information from the satellite SysML model to the SatBudgets tool is depicted in Figure 9 and its final report spreadsheet which is employed by systems engineers for iteractive designs. The SatBudgets tool links a SysML satellite model to activities for performance budgetings. The tool currently runs as a stand-alone Java application but it will be aggregated as a Eclipe IDE plugin [6] which already supports SysML as a plugin. From the previous short description, some main SatBudgets use cases are identified .
Satellite power supply:
- Every satellite needs a source of power
- Factors to consider are cost, durability, and effectiveness (amount of power generated)
- Satellites use up a lot of electricity
- Think! How could a power source be mounted in or on a satellite?
- Some possible power sources for satellites include:
![[Solar Panels]](http://satellites.spacesim.org/english/anatomy/power/63i.jpg)
- Solar panels must be constantly exposed to light to produce electricity
- Click here to learn how solar panels work
- Solar panels are only effective if they will be receiving lots of sunlight
- Solar panels consist of many individual solar cells
- Each individual cell does not produce large amounts of electricity by itself
- Large surface area is needed in order to produce maximum electricity
- The need for large solar panels must be balanced with the need for the entire satellite to be relatively small
- Solar panels can be mounted on the body of the satellite
- If the body is not large enough for the amount of solar panels needed, the panels may be extended in arrays off to the side of the satellite
- Solar panels will not "run down" like a battery (completely renewable)
- Solar panels can be used together with a battery, which recharges when the satellite is in the sun and provides the satellite's power when the satellite is not
- They are excellent for satellites studying the sun or the planets orbiting close to the sun
- They cannot be used easily for space exploration satellites going deep into space because they will travel too far from the sun to receive sufficient power
- They are moderately efficient and moderately expensive
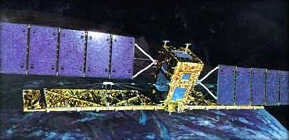
Battery
- In a battery, electricity is produced by the transfer of electrons from one strip of metal to another
- This is made possible by the fact that both metals are submerged in a solution that conducts electricity (an electrolyte)
- Electrons are carried over from one strip to another by particles in the solution, the electrolyte
- Some batteries are rechargeable, but recharging them would require some other source of power in orbit
- Batteries can work together with solar panels; the solar cells can recharge the batteries when in sunlight
- Batteries will run down eventually by using up all their power; they are non-renewable
- Batteries are extremely heavy, so they are often used in conjunction with a lighter source of power such as solar panels
- They are not very efficient nor very durable, but they are inexpensive
Nuclear power
- Since fusion has not yet been perfected, all nuclear power would produce energy by the process of nuclear fission
- In nuclear fission, the heavy nucleus of an atom is made to split into two fragments of roughly equivalent masses; this process is accompanied by large releases of energy - it is this process that takes place in nuclear power reactors and in atomic bombs
- In satellites, nuclear power is created in Radioisotope Thermoelectric Generators (RTG's)
- Nuclear power requires more volume then a normal battery; it doesn't require as much surface area as solar cells
- Power from a nuclear reactor is, for our purposes, limitless; it won't run out before the satellite becomes useless for other reasons
- Nuclear power cannot be used for Earth-orbiting satellites because when its orbit decays, the satellite will fall back to Earth and burn up in the atmosphere, spreading radioactive particles over the Earth
- One danger of nuclear power sources is that if the rocket used to launch the satellite explodes before escaping the atmosphere, radioactive particles would be spread over the Earth
- This happened in the early days of satellites when a Russian satellite with a nuclear power source crashed in northern Canada, exposing the area to radioactive particles
- Nuclear power is effective in space exploration satellites going deep into space because they may travel too far from the sun to use solar panels; since a nuclear power source will continue to generate power for an extremely long time, the satellite will have power for all of its long journey in space
- Nuclear power sources are very efficient, very durable, and very expensive
Heat Generator
- This source of power is very large and very heavy, so it is only appropriate for large satellites
- A parabolic dish of mirrors reflects the heat of the sun through a boiler and then through a generator which converts the solar power into electricity
- This type of power is completely renewable and efficient if the satellite will be in the sun
- It could be used in conjunction with batteries
- This source of power is currently in the testing phase
- NASA is experimenting with using this source of power for the International Space Station
Challenges for Electronic Circuits in Space Applications
To set the stage for this discussion let me propose this scenario: imagine yourself as an astronaut sitting in the crew module of the NASA Orion spacecraft. You are stepping through your final equipment checklist for a voyage to Mars while sitting on top of a rocket, anticipating the final countdown to ignition of the largest rocket ever designed—the NASA Space Launch System. You are sitting 384 feet in the air on a massive, 130 metric ton configuration, the most capable and powerful launch vehicle in history. When you hear those famous words “gentlemen, we have ignition,” you will have 9.2 million pounds of thrust propelling you into outer space. The Orion spacecraft is being designed to take humans to Mars and into deep space where the temperature can approach over 2000°C, the radiation is deadly, and you will be travelling at speeds up to 20,000 mph.

Now ask yourself, what quality grade of electronic components were selected for the control systems of your spacecraft? High reliability and devices with space heritage are key factors in the selection of components for space level applications. NASA generally specifies Level 1, qualified manufacturer list Class V (QMLV) devices, and they will always ask if there is a higher quality level available. Knowing the extensive selection process NASA uses for identifying electronic components for space flight applications, one should be confident sitting on top of that rocket.
The Harsh Environmental Conditions of a Spacecraft and the Hazards Posed to the Electronics
The first hurdle for space electronics to overcome is the vibration imposed by the launch vehicle. The demands placed on a rocket and its payload during launch are severe. Rocket launchers generate extreme noise and vibration. There are literally thousands of things that can go wrong and result in a ball of flame. When a satellite separates from the rocket in space, large shocks occur in the satellite’s body structure. Pyrotechnic shock is the dynamic structural shock that occurs when an explosion occurs on a structure. Pyroshock is the response of the structure to high frequency, high magnitude stress waves that propagate throughout the structure as a result of an explosive charge, like the ones used in a satellite ejection or the separation of two stages of a multistage rocket. Pyroshock exposure can damage circuit boards, short electrical components, or cause all sorts of other issues. Understanding the launch environment provides a greater appreciation for the shock and vibration requirements, and inspections imposed on electronic components designed for use in space level applications.
Outgassing is another major concern. Plastics, glues, and adhesives can and do outgas. Vapor coming off of plastic devices can deposit material on optical devices, thereby degrading their performance. For instance, an automobile plastic dashboard can emit vapor that deposits a film on the windshield. This is a practical example I can attest to from personal experience. Using ceramic rather than plastic components eliminates this problem in electronics. Outgassing of volatile silicones in low Earth orbit (LEO) cause a cloud of contaminants around the spacecraft. Contamination from outgassing, venting, leaks, and thruster firing can degrade and modify the external surfaces of the spacecraft.
High levels of contamination on surfaces can contribute to electrostatic discharge. Satellites are vulnerable to charging and discharging. For that reason, space applications require components with no floating metal. Satellite charging is a variation in the electrostatic potential of a satellite, with respect to the surrounding low density plasma around the satellite. The extent of the charging depends on the design of the satellite and the orbit. The two primary mechanisms responsible for charging are plasma bombardment and photoelectric effects. Discharges as high as 20,000 V have been known to occur on satellites in geosynchronous orbits. If protective design measures are not taken, electrostatic discharge, a buildup of energy from the space environment, can damage the devices. A design solution used in geosynchronous Earth orbit (GEO) is to coat all the outside surfaces of the satellite with a conducting material. The atmosphere in LEO is comprised of about 96% atomic oxygen. Oxygen exists in different forms. The oxygen that we breathe is O2. O3 occurs in Earth’s upper atmosphere, and O (one atom) is atomic oxygen. Atomic oxygen can react with organic materials on spacecraft exteriors and gradually damage them. Material erosion by atomic oxygen was noted on NASA’s first space shuttle missions, where the presence of atomic oxygen caused problems. Space shuttle materials looked frosty because they were actually being eroded and textured by the presence of atomic oxygen. NASA addressed this problem by developing a thin film coating that is immune to the reaction with atomic oxygen. Plastics are considerably sensitive to atomic oxygen and ionizing radiation. Coatings resistant to atomic oxygen are a common protection method for plastics. Another obstacle is the very high temperature fluctuations encountered by a spacecraft. A satellite orbiting around Earth can be divided into two phases; a sunlit phase and an eclipse phase. In the sunlit phase, the satellite is heated by the Sun and as the satellite moves around the back side or shadow side of the Earth, the temperature can change by as much as 300°C. Because it is closer to the Sun, the temperature fluctuations on a satellite in GEO stationary orbit will be much greater than the temperature variations on a satellite in LEO.
It is interesting to note that during lunar day and night, the temperature on the surface of the Moon can vary from around –200°C to +200°C. It makes you wonder how it was even possible for a man to walk on the Moon. Here again, ceramic packages can withstand repeated temperature fluctuations, provide a greater level of hermeticity, and remain functional at higher power levels and temperatures. Ceramic packages provide higher reliability in harsh environments. So how do you dissipate the heat generated by the electronics? The accuracy and life expectancy of electronic devices can be degraded by sustained high temperatures. There are three ways of transferring heat: convective, diffusive, and radiative. In the vacuum of space there is no thermal convection or conduction taking place. Radiative heat transfer is the primary method of transferring heat in a vacuum, so satellites are cooled by radiating heat out into space.
The vacuum of space is a favorable environment for tin whiskers, so prohibited materials are a concern. Pure tin, zinc, and cadmium plating are prohibited on IEEE parts and associated hardware in space. These materials are subject to the spontaneous growth of whiskers that can cause electrical shorts. Tin whiskers are electrically conductive, crystalline structures of tin that sometimes grow from surfaces where tin is used as a final finish. Devices with pure tin leads can suffer from the tin whiskers phenomenon that can cause electrical shorts. Using lead-based solder eliminates the risk of shorts occurring when devices are used in high stress applications. Finally, the space radiation environment can have damaging effects on spacecraft electronics. There are large variations in the levels of and types of radiation a spacecraft may encounter. Missions flying at low Earth orbits, highly elliptical orbits, geostationary orbits, and interplanetary missions have vastly different environments. In addition, those environments are changing. Radiation sources are affected by the activity of the Sun. The solar cycle is divided into two activity phases: the solar minimum and the solar maximum. Will your spacecraft mission occur during a solar minimum, a solar maximum period, or both? The key point here is that there are vastly different environments in space. The requirements for a launch vehicle are much different from that of a geostationary satellite or a Mars rover. Each space program has to be evaluated in terms of reliability, radiation tolerance, environmental stresses, the launch date, and the expected life cycle of the mission.
Analog Devices has been supporting the aerospace and defense markets for over 40 years with high reliability devices. Areas of focus are electronic warfare, radar, communications, avionics, unmanned systems, and missile and smart munitions applications. Today’s focus is on the space market. Analog Devices has the depth and breadth of technologies that spans the complete signal chain from sensors, amplifiers, RF and microwave devices, ADCs, DACs, and output devices that provide solutions to the challenging requirements of the aerospace and defense industry.

The satellite industry’s revenue was $208 billion in 2015. There are four segments to the satellite industry: satellite manufacturing, satellite launch equipment, ground-based equipment, and satellite services. Satellite services is by far the largest segment and continues to be a key driver for the overall satellite industry. So, what has a satellite done for you lately? I believe most people would be surprised at just how much modern life depends on satellites services. If the 1381 satellites currently in operation happen to shut down, modern life would be significantly disrupted. Global finance, telecommunications, transportation, weather, national defense, aviation, and many other sectors rely heavily on satellite services. There are three primary segments in the satellite services market: satellite navigation, satellite communications, and Earth observation. Navigation satellites are used for the global distribution of navigation signals and data in order to provide positioning, location, and timing services. Examples of available services are traffic management, surveying and mapping, fleet and asset management, and autonomous driving technology—driverless cars and trucks are expected to be the next big thing. Telecommunication satellites or SATCOM examples are television, telephone, broadband internet, and satellite radio. These systems can provide uninterrupted communications services in the event of disasters that damage ground-based telecommunication networks. Both business and commercial aircraft in-flight internet and mobile entertainment are growing segments of the market. Earth observation satellites are used for the transmission of environmental data. Space-based observations of the Earth promote sustainable agriculture and aid in the response to climate change, land and wildlife management, and energy resources management. Earth observation satellites aid in the safeguard of water resources and improve weather forecasts, so there is a very wide and growing range of satellite services.
So what types of electronic systems are used on satellites? The basic elements of a spacecraft are divided into two sections: the platform or bus and the payload. The platform consists of the five basic subsystems that support the payload: the structural subsystem, the telemetry subsystem, tracking and command subsystems, the electric power and distribution subsystem, the thermal control subsystem, and the attitude and velocity control subsystem. The structural subsystem is the mechanical structure and provides stiffness to withstand stress and vibration. It also provides shielding from radiation for the electronic devices. The telemetry, tracking, and command subsystems include receivers, transmitters, antennas, sensors for temperature, current, voltage, and tank pressure. It also provides the status of various spacecraft subsystems. The electric power and distribution subsystems convert solar into electrical power and charge the spacecraft batteries. The thermal control subsystem helps to protect electronic equipment from extreme temperatures. And finally, the attitude and velocity control subsystem is the orbit control system that consists of sensors to measure vehicle orientation and actuators (reaction wheels, thrusters), and to apply the torques and forces needed to orient the vehicle in the correct orbital position. Typical components of the attitude and control system include Sun and Earth sensors, star sensors, momentum wheels, inertial measurement units (IMUs), and the electronics required to process the signals and control the satellites position.
The payload is the equipment in support of the primary mission. For GPS navigation satellites, this would include atomic clocks, navigation signal generators, and high power RF amplifiers and antennas. For telecommunications systems, the payload would include antennas, transmitters and receivers, low noise amplifiers, mixers and local oscillators, demodulator and modulators, and power amplifiers. Earth observation payloads would include microwave and infrared sounding instruments for weather forecasting, visible infrared imaging radiometers, ozone mapping instruments, visible and infrared cameras, and sensors.
The integration of Analog Devices and Hittite Microwave a few years ago now allows us to cover the dc to 110 GHz spectrum. ADI solutions range from navigation, radar, communication systems below 6 GHz, satellite communications, electronic warfare, radar systems in the microwave spectrum, radar systems, and satellite imaging in the millimeter wave spectrum. Analog Devices offers more than 1000 components covering all RF and microwave signal chains and applications. The combination of Hittite’s full spectrum of RF function blocks, attenuators, LNAs, PAs, and RF switches, in conjunction with Analog Devices portfolio of high performance linear products, high speed ADCs, DACs, active mixers, and PLLs can provide end-to-end system solutions.
The Natural Space Radiation Environment Effects on Electronic Devices
The radiation effects on electronic devices are a primary concern for space level applications. Outside the protective cover of the Earth’s atmosphere, the solar system is filled with radiation. The natural space radiation environment can damage electronic devices and the effects range from a degradation in parametric performance to a complete functional failure. These effects can result in reduced mission lifetimes and major satellite system failures. The radiation environment close to Earth is divided into two categories: particles trapped in the Van Allen belts and transient radiation. The particles trapped in the Van Allen belts are composed of energetic protons, electrons, and heavy ions. The transient radiation consists of galactic cosmic ray particles and particles from solar events (coronal mass ejections and solar flares). There are two primary ways that radiation can effect satellite electronics: total ionizing dose (TID) and single event effects (SEEs). TID is a long-term failure mechanism vs. SEE, which is an instantaneous failure mechanism. SEE is expressed in terms of a random failure rate, whereas TID is a failure rate that can be described by a mean time to failure.

Sources of ionizing radiation in interplanetary space (Image: NASA).
TID is a time dependent, accumulated charge in a device over the lifetime of a mission. A particle passing through a transistor generates electron hole pairs in the thermal oxide. The accumulated charges can create leakage currents, degrade the gain of a device, affect timing characteristics, and, in some cases, result in complete functional failure. The total accumulated dose depends on the orbit and time. In LEO, the main source of radiation is from electrons and protons (inner belt) and in GEO, the primary source is from electrons (outer belt) and solar protons. It is worth noting that device shielding can be used to effectively reduce the accumulation of TID radiation.
SEEs are caused by a single, high energy particle passing through a device and injecting a charge in the circuit. Typically, SEEs are divided into soft errors and hard errors.
The Joint Electron Device Engineering Council (JEDEC) defines soft errors as nondestructive, functional errors induced by energetic ion strikes. Soft errors are a subset of SEEs and includes single event upsets (SEUs), multiple-bit upsets (MBUs), single event functional interrupts (SEFIs), single event transients (SETs), and single event latch-up (SEL). A SEL is where the formation of parasitic bipolar action in CMOS wells induces a low impedance path between power and ground, producing a high current condition. Therefore, a SEL can cause latent and hard errors.
Examples of soft errors would be bit flips or changes in the state of memory cells or registers. A SET is a transient voltage pulse generated by a charge injected into the device from a high energy particle. These transient pulses can cause SEFIs. SEFIs are soft errors that cause the component to reset, lock-up, or otherwise malfunction in a detectable way, but does not require power cycling of the device to restore operability. A SEFI is often associated with an upset in a control bit or register.
JEDEC defines a hard error as an irreversible change in operation that is typically associated with permanent damage to one or more elements of a device or circuit (for example, gate oxide rupture, or destructive latch-up events). The error is hard because the data is lost and the component or device no longer functions properly, even with a power reset. SEE hard errors are potentially destructive. Examples of hard errors are single event latch-up (SEL), single event gate rupture (SEGR), and single event burnout
(SEB). SEEs hard errors can destroy the device, drag down the bus voltage, or even damage the system power supply.
(SEB). SEEs hard errors can destroy the device, drag down the bus voltage, or even damage the system power supply.
Technology Trends and Radiation Effects
In terms of the satellite payload, instruments are becoming more complex. At one time communication satellites were basically bent pipe repeater architectures that would relay signals. Today they are multibeam and have on-board processing (OBP) architectures. More complex electronics translate into greater risk from radiation effects. High volume, small satellite constellations are using more commercial grade plastic components. Commercial off-the-shelf (COTS) devices generally tend to be more sensitive to radiation effects. Also with small satellite, there is less structural mass shielding the electronics. With finer IC geometries and thinner oxides, the sensitivity to TID radiation effects is reduced, and the TID tolerance is improved. On the other hand, SEEs increase with reduced IC scaling. Less energy is required to produce SET and SEU.
With higher frequency devices, SETs can turn into more SEUs, increasing the number of SEFIs. Mitigation techniques used to address higher speed transient signals can be more challenging.
Analog Devices’ Efforts in Support of Space Level Applications
The space products group leverages Analog Devices’ portfolio of devices in the support of the space industry. We have proprietary silicon on insulator (SOI) processes that provide radiation tolerance for space level applications. In some cases we modify core silicon to enhance the radiation tolerance of devices. We also have the ability to port designs over to radiation hardened SOI processes. We integrate the die into hermetic, ceramic packages and characterize the device over the extended military temperature range. We target the development and release of fully qualified, Class S QMLV products using the defense logistics agency (DLA) MIL-PRF 38535 system for monolithic devices, and MIL-PRF 38534 for Class K hybrid and multichip modules. For radiation inspection we currently offer high dose rate (HDR) and low dose rate (LDR) tested models and for new product releases we offer single event effects test data.
Analog Devices offers commercial, industrial, enhance products (EPs), automotive, military, and space qualified devices. EP devices are designed to meet mission critical and high reliability applications, primarily in the aerospace and defence market. Other product grades include military grade monolithic devices, multichip modules, QMLQ and QMLH devices, space qualified monolithic devices, and multichip modules designed under military specifications as QMLV and QMLK devices. Analog Devices also offers space qualified Class K die for customers who are developing hybrid or multichip modules solutions. Class K qualified die are offered against standard aerospace data sheets and customer source control drawings.
We offer EPs, plastic encapsulated devices designed to meet mission critical requirements, and high reliability application requirements. With customer input, we are initiating a new device product category for space applications that we have defined as enhanced products plus (EP+) devices. Our customers are requiring improvements in size, weight, power, higher performance, wider bandwidths, increased operational frequencies, payload flexibility, and optimized reliability. Spacecraft designers are being pressed to use commercial devices in order to meet high levels of performance in increasingly smaller, lower power, and lower cost spacecraft. The internet in the sky is a good example. It is estimated that 60% of the world’s population does not have access to the internet. To address this market, companies are planning to deploy large constellations of small, low cost satellites circling the Earth that will enable access to a worldwide communication network. Analog Devices is working with customers to define EP+ to address this evolving new market. EPs provide COTS solutions for high reliability applications with no additional cost of custom upscreening. EPs are plastic encapsulated devices released with a military temperature range of –55°C to +125°C. In addition to requiring an extended temperature range, EP customers require devices to be lead free and whisker free. They require devices with a controlled manufacturing baseline, a standalone data sheet, and an EP change notification process. These devices also have an associated V62 vendor item drawing under the defense logistics agency documentation system. Currently released EPs are identified by a special EP suffix and have a separate standalone data sheet.
As noted, Analog Devices is also developing a new device concept for space level applications EPs, plus for LEO systems and high altitude applications. We currently support EP+ against source control drawings. ADI would like to offer a standard COTS grade device for space level applications. With the EP+ approach we envision a device somewhere between standard EP devices and military 883-grade devices, providing COTS solutions for space level applications without additional cost of custom upscreening. With the EP+ approach, we can generate COTS devices and provide wafer lot traceability and lot specific radiation inspection data.
The key issue is determining the proper balance between reliability and cost as depicted in the curve in Figure 1. The more screening required, the higher the unit cost. In defining this new product category, the current challenge for the satellite industry and for Analog Devices is to define the optimum screening level vs. cost point for commercial devices used in space level applications.

Figure 1. Reliability test and inspections drive electronic component cost.
To summarize—Analog Devices’ goal is to deliver a complete product for space level applications and not just a component.
- We offer the industry’s most comprehensive portfolio with industry-leading device reliability
- We provide single lot date code procurement
- Advanced packaging and characterization to meet harsh environmental challenges
- Gold and tin lead hot solder dip lead finishes to address tin whiskers
- We provide no prohibited materials certification
- Comprehensive certificates of conformance with material traceability
- Comprehensive QMLV flight unit test reports
- Electrical performance is production tested over the extended temperature ranges –55°C to +125°C
- We offer fully qualified QMLV devices with 100% screening and quality conformance inspection
- We provide radiation qualified devices … HDR, LDR, SEE
- Long product life cycles are a cornerstone of ADI’s business strategy
- We have a dedicated aerospace and defense team for product support and applications support
Analog Devices currently offers over 90 standard generic space qualified devices with greater than 350 models in different grades and packages. A few of the new featured space qualified products are the ADA4084-2S, ADA4610-2S, and ADuM7442S devices.
The 5962R1324501VXA (ADA4084AF/QMLR) is a new low noise, low power, space qualified precision amplifier offered as QMLV space qualified device available against a SMD drawing. The device has 10 MHz unity-gain bandwidth and rail-to-rail inputs and outputs. These amplifiers are excellent for single-supply applications requiring both ac and precision dc performance.
The 5962R1420701VXA (ADA4610-2BF/QMLR) are space qualified, dual-channel, precision, very low noise, low input bias current wide bandwidth JFET devices. The amplifiers are especially suited for high impedance sensor amplification and precise current measurements.
The ADuM7442R703F is a space qualified 25 Mbps, quad-channel digital isolator with three forward and one reverse channel. The devices offer bidirectional communications. The space qualified devices offer galvanic isolation, which means that the input and output circuits have no direct electrical connection. They offer advantages in size, weight, power, and reliability over competing solutions.
digital electronics study how networks of semiconductor devices such as transistors perform signal-processing tasks. Examples of such tasks include generating and amplifying speech or music, TV broadcasting and displaying, cell phone and satellite communications. Students learn how to design sophisticated electronic microchips to perform these tasks in a variety of electronic systems.
The digital nature of electronic signals offers a convenient, compact and noise-free representation of information. Digital signals can be easily stored in an electronic memory and can be easily understood by digital microprocessors. Examples of engineering problems in digital electronics are: how to efficiently perform arithmetic operations with digital signals on a microprocessor, how to communicate data without losing information, and how to design a reusable reconfigurable digital processor.
Commonly advertised positions include: digital electronics engineer, digital circuit design engineer and digital integrated circuit design engineer. Some major employers are Intel, AMD, Xilinx and Altera.
The analog nature of electronic signals is of importance as the real world is analog, and because in modern microchips even digital circuits exhibit analog behaviour. Examples of engineering problems in analog electronics are: how to efficiently represent an analog signal such as an image recorded by a digital camera in a digital format so that it can be stored in a digital memory or processed by a microprocessor; how to send large amounts of information such as high-definition video data from one microchip to another quickly; how to send data such as a text message to a cell phone wirelessly in the presence of interference; and how to design a pacemaker or neural implant to function inside a human body.
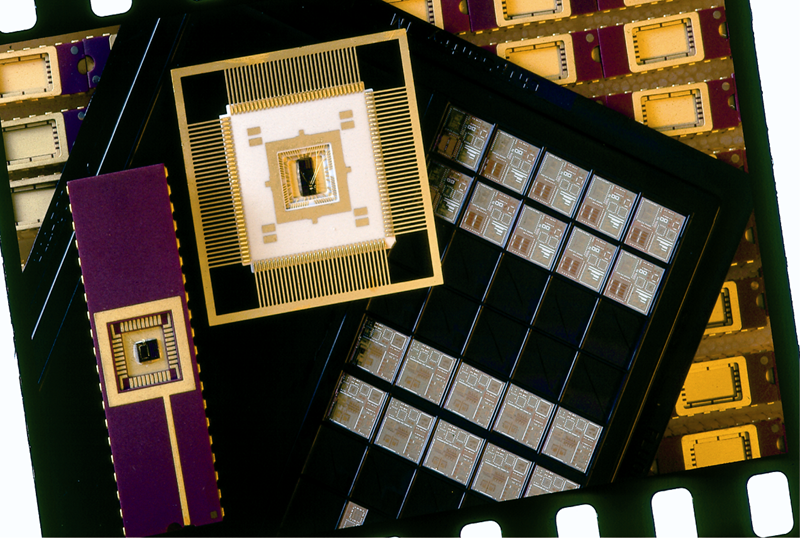
Applications of Multiplexers
Multiplexers are used in various applications wherein multiple-data need to be transmitted by using single line.
- Communication System
A communication system has both a communication network and a transmission system. By using a multiplexer, the efficiency of the communication system can be increased by allowing the transmission of data, such as audio and video data from different channels through single lines or cables.
- Computer Memory
Multiplexers are used in computer memory to maintain a huge amount of memory in the computers, and also to reduce the number of copper lines required to connect the memory to other parts of the computer.
- Telephone Network
In telephone networks, multiple audio signals are integrated on a single line of transmission with the help of a multiplexer.
- Transmission from the Computer System of a Satellite
Multiplexer is used to transmit the data signals from the computer system of a spacecraft or a satellite to the ground system by using a GSM satellite.
De-multiplexer
De-multiplexer is also a device with one input and multiple output lines. It is used to send a signal to one of the many devices. The main difference between a multiplexer and a de-multiplexer is that a multiplexer takes two or more signals and encodes them on a wire, whereas a de-multiplexer does reverse to what the multiplexer does.

Types of De multiplexer
De-multiplexers are classified into four types
- 1-2 demultiplexer (1 select line)
- 1-4 demultiplexer (2 select lines)
- 1-8 demultiplexer (3 select lines)
- 1-16 demultiplexer (4 select lines)
1-8 De-multiplexers
The demultiplexer is also called as data distributors as it requires one input, 3 selected lines and 8 outputs. De-multiplexer takes one single input data line, and then switches it to any one of the output line. 1-to-8 demultiplexer circuit diagram is shown below; it uses 8 AND gates for achieving the operation. The input bit is considered as data D and it is transmitted to the output lines. This depends on the control input value of the AB. When AB = 01, the upper second gate F1 is enabled, while the remaining AND gates are disabled, and the data bit is transmitted to the output giving F1= data. If D is low, the F1 is low, and if D is high, the F1 is high. So the value of the F1 depends on the value of D, and the remaining outputs are in low state.
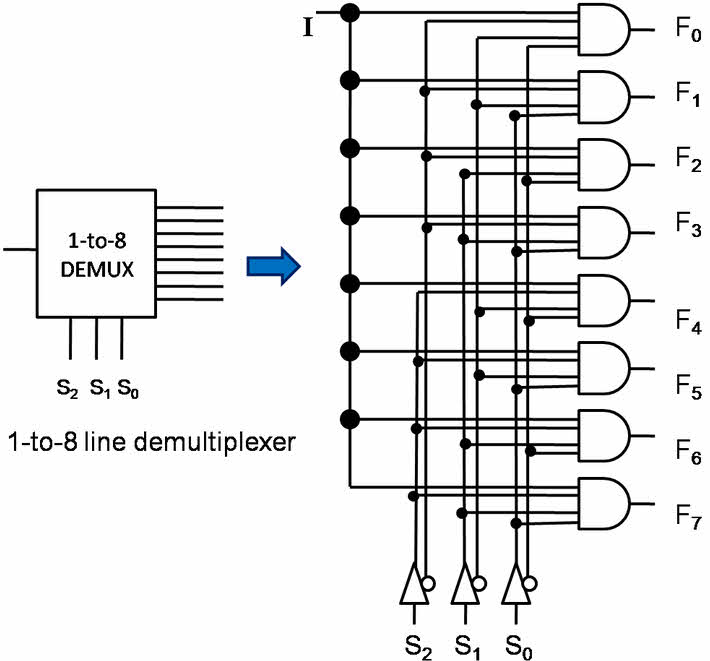
Applications of De multiplexer
De multiplexers are used to connect a single source to multiple destinations. These applications include the following:
- Communication System
Mux and demux both are used in communication system to carry out the process of data transmission. A De-multiplexer receives the output signals from the multiplexer and at the receiver end it converts them back to the original form.
- Arithmetic Logic Unit
The output of the ALU is fed as an input to the De-multiplexer, and the output of the demultiplexer is connected to a multiple register. The output of the ALU can be stored in multiple registers.
- Serial to Parallel Converter
This converter is used to reconstruct parallel data. In this technique, serial data is given as an input to the De-multiplexer at a regular interval, and a counter is attached to the demultiplexer at the control input to detect the data signal at the output of the demultiplexer. When all data signals are stored, the output of the demux can be read out in parallel.
Multiplexer Types
Multiplexers are classified into four types:
- 2-1 multiplexer ( 1select line)
- 4-1 multiplexer (2 select lines)
- 8-1 multiplexer(3 select lines)
- 16-1 multiplexer (4 select lines)
8-to-1 Multiplexer
The 8-to-1 multiplexer consists of 8 input lines, one output line and 3 selection lines.
Multiplexer Circuit
For the combination of selection input, the data line is connected to the output line. The circuit shown below is an 8*1 multiplexer. The 8-to-1 multiplexer requires 8 AND gates, one OR gate and 3 selection lines. As an input, the combination of selection inputs are giving to the AND gate with the corresponding input data lines.
In a similar fashion, all the AND gates are given connection. In this 8*1 multiplexer, for any selection line input, one AND gate gives a value of 1 and the remaining all AND gates give 0. And, finally, by using OR gate, all the AND gates are added; and, this will be equal to the selected value.
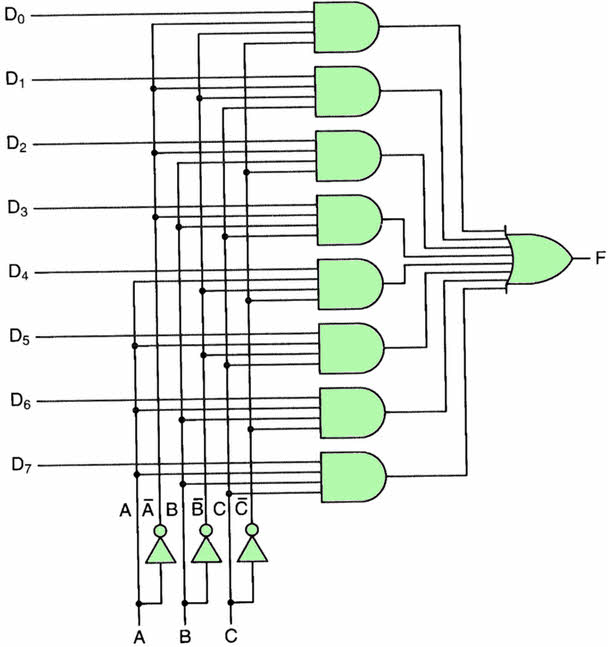
Attitude control
Attitude control is controlling the orientation of an object with respect to an inertial frame of reference or another entity like the celestial sphere, certain fields, and nearby objects, etc.
Controlling vehicle attitude requires sensors to measure vehicle orientation, actuators to apply the torques needed to re-orient the vehicle to a desired attitude, and algorithms to command the actuators based on sensor measurements of the current attitude and specification of a desired attitude. The integrated field that studies the combination of sensors, actuators and algorithms is called "Guidance, Navigation and Control" (GNC).
A spacecraft's attitude must typically be stabilized and controlled for a variety of reasons. It is oftentimes needed so that the spacecraft high-gain antenna may be accurately pointed to Earth for communications, so that onboard experiments may accomplish precise pointing for accurate collection and subsequent interpretation of data, so that the heating and cooling effects of sunlight and shadow may be used intelligently for thermal control, and also for guidance: short propulsive maneuvers must be executed in the right direction.
Types of stabilization
There are two principal approaches to stabilizing attitude control on spacecraft:
- Spin stabilization is accomplished by setting the spacecraft spinning, using the gyroscopic action of the rotating spacecraft mass as the stabilizing mechanism. Propulsion system thrusters are fired only occasionally to make desired changes in spin rate, or in the spin-stabilized attitude. If desired, the spinning may be stopped through the use of thrusters or by yo-yo de-spin. The Pioneer 10 and Pioneer 11 probes in the outer solar system are examples of spin-stabilized spacecraft.
- Three-axis stabilization is an alternative method of spacecraft attitude control in which the spacecraft is held fixed in the desired orientation without any rotation.
- One method is to use small thrusters to continually nudge the spacecraft back and forth within a deadband of allowed attitude error. Thrusters may also be referred to as mass-expulsion control (MEC)[1] systems, or reaction control systems (RCS). The space probes Voyager 1 and Voyager 2 employ this method, and have used up about three quarters[2] of their 100 kg of propellant as of July 2015.
- Another method for achieving three-axis stabilization is to use electrically powered reaction wheels, also called momentum wheels, which are mounted on three orthogonal axes aboard the spacecraft. They provide a means to trade angular momentum back and forth between spacecraft and wheels. To rotate the vehicle on a given axis, the reaction wheel on that axis is accelerated in the opposite direction. To rotate the vehicle back, the wheel is slowed. Excess momentum that builds up in the system due to external torques from, for example, solar photon pressure or gravity gradients, must be occasionally removed from the system by applying controlled torque to the spacecraft to allowing the wheels to return to a desired speed under computer control. This is done during maneuvers called momentum desaturation or momentum unload maneuvers. Most spacecraft use a system of thrusters to apply the torque for desaturation maneuvers. A different approach was used by the Hubble Space Telescope, which had sensitive optics that could be contaminated by thruster exhaust, and instead used magnetic torquers for desaturation maneuvers.
There are advantages and disadvantages to both spin stabilization and three-axis stabilization. Spin-stabilized craft provide a continuous sweeping motion that is desirable for fields and particles instruments, as well as some optical scanning instruments, but they may require complicated systems to de-spin antennas or optical instruments that must be pointed at targets for science observations or communications with Earth. Three-axis controlled craft can point optical instruments and antennas without having to de-spin them, but they may have to carry out special rotating maneuvers to best utilize their fields and particle instruments. If thrusters are used for routine stabilization, optical observations such as imaging must be designed knowing that the spacecraft is always slowly rocking back and forth, and not always exactly predictably. Reaction wheels provide a much steadier spacecraft from which to make observations, but they add mass to the spacecraft, they have a limited mechanical lifetime, and they require frequent momentum desaturation maneuvers, which can perturb navigation solutions because of accelerations imparted by the use of thrusters .
Articulation
Many spacecraft have components that require articulation. Voyager and Galileo, for example, were designed with scan platforms for pointing optical instruments at their targets largely independently of spacecraft orientation. Many spacecraft, such as Mars orbiters, have solar panels that must track the Sun so they can provide electrical power to the spacecraft. Cassini's main engine nozzles were steerable. Knowing where to point a solar panel, or scan platform, or a nozzle — that is, how to articulate it — requires knowledge of the spacecraft's attitude. Because AACS keeps track of the spacecraft's attitude, the Sun's location, and Earth's location, it can compute the proper direction to point the appendages. It logically falls to one subsystem, then, to manage both attitude and articulation. The name AACS may even be carried over to a spacecraft even if it has no appendages to articulate
Sensors
Relative attitude sensors
Many sensors generate outputs that reflect the rate of change in attitude. These require a known initial attitude, or external information to use them to determine attitude. Many of this class of sensor have some noise, leading to inaccuracies if not corrected by absolute attitude sensors.
Gyroscopes
Gyroscopes are devices that sense rotation in three-dimensional space without reliance on the observation of external objects. Classically, a gyroscope consists of a spinning mass, but there are also "ring laser gyros" utilizing coherent light reflected around a closed path. Another type of "gyro" is a hemispherical resonator gyro where a crystal cup shaped like a wine glass can be driven into oscillation just as a wine glass "sings" as a finger is rubbed around its rim. The orientation of the oscillation is fixed in inertial space, so measuring the orientation of the oscillation relative to the spacecraft can be used to sense the motion of the spacecraft with respect to inertial space.[3]
Motion reference units
Motion reference units are a kind of inertial measurement unit with single- or multi-axis motion sensors. They utilize MEMS gyroscopes. Some multi-axis MRUs are capable of measuring roll, pitch, yaw and heave. They have applications outside the aeronautical field, such as:[4]
- Antenna motion compensation and stabilization
- Dynamic positioning
- Heave compensation of offshore cranes
- High speed craft motion control and damping systems
- Hydro acoustic positioning
- Motion compensation of single and multibeam echosounders
- Ocean wave measurements
- Offshore structure motion monitoring
- Orientation and attitude measurements on Autonomous underwater vehicles and Remotely operated underwater vehicles
- Ship motion monitoring
Absolute attitude sensors
This class of sensors sense the position or orientation of fields, objects or other phenomena outside the spacecraft.
Horizon sensor
A horizon sensor is an optical instrument that detects light from the 'limb' of Earth's atmosphere, i.e., at the horizon. Thermal infrared sensing is often used, which senses the comparative warmth of the atmosphere, compared to the much colder cosmic background. This sensor provides orientation with respect to Earth about two orthogonal axes. It tends to be less precise than sensors based on stellar observation. Sometimes referred to as an Earth sensor.
Orbital gyrocompass
Similar to the way that a terrestrial gyrocompass uses a pendulum to sense local gravity and force its gyro into alignment with Earth's spin vector, and therefore point north, an orbital gyrocompass uses a horizon sensor to sense the direction to Earth's center, and a gyro to sense rotation about an axis normal to the orbit plane. Thus, the horizon sensor provides pitch and roll measurements, and the gyro provides yaw.
Sun sensor
A sun sensor is a device that senses the direction to the Sun. This can be as simple as some solar cells and shades, or as complex as a steerable telescope, depending on mission requirements.
Earth sensor
An Earth sensor is a device that senses the direction to Earth. It is usually an infrared camera; nowadays the main method to detect attitude is the star tracker, but Earth sensors are still integrated in satellites for their low cost and reliability.
Star tracker

A star tracker is an optical device that measures the position(s) of star(s) using photocell(s) or a camera.[5] It uses magnitude of brightness and spectral type to identify and then calculate the relative position of stars around it.
Magnetometer
A magnetometer is a device that senses magnetic field strength and, when used in a three-axis triad, magnetic field direction. As a spacecraft navigational aid, sensed field strength and direction is compared to a map of Earth's magnetic field stored in the memory of an on-board or ground-based guidance computer .
Algorithms
Control algorithms are computer programs that receive data from vehicle sensors and derive the appropriate commands to the actuators to rotate the vehicle to the desired attitude. The algorithms range from very simple, e.g. proportional control, to complex nonlinear estimators or many in-between types, depending on mission requirements. Typically, the attitude control algorithms are part of the software running on the hardware, which receives commands from the ground and formats vehicle data telemetry for transmission to a ground station.
The attitude control algorithms are written and implemented based on requirement for a particular attitude maneuver. Asides the implementation of passive attitude control such as the gravity-gradient stabilization, most spacecrafts make use of active control which exhibits a typical attitude control loop. The design of the control algorithm depends on the actuator to be used for the specific attitude maneuver although using a simple proportional–integral–derivative controller (PID controller) satisfies most control needs.
The appropriate commands to the actuators are obtained based on error signals described as the difference between the measured and desired attitude. The error signals are commonly measured as euler angles (Φ, θ, Ψ), however an alternative to this could be described in terms of direction cosine matrix or error quaternions. The PID controller which is most common reacts to an error signal (deviation) based on attitude as follows

where is the control torque, is the attitude deviation signal, and are the PID controller parameters.


A simple implementation of this can be the application of the proportional control for nadir pointing making use of either momentum or reaction wheels as actuators. Based on the change in momentum of the wheels, the control law can be defined in 3-axes x, y, z as


This control algorithm also affects momentum dumping.
Another important and common control algorithm involves the concept of detumbling, which is attenuating the angular momentum of the spacecraft. The need to detumble the spacecraft arises from the uncontrollable state after release from the launch vehicle. Most spacecraft in low earth orbit (LEO) makes use of magnetic detumbling concept which utilizes the effect of the earth's magnetic field. The control algorithm is called the B-Dot controller and relies on magnetic coils or torque rods as control actuators. The control law is based on the measurement of the rate of change of body-fixed magnetometer signals.

where is the commanded magnetic dipole moment of the magnetic torquer and is the proportional gain and is the rate of change of the Earth's magnetic field.


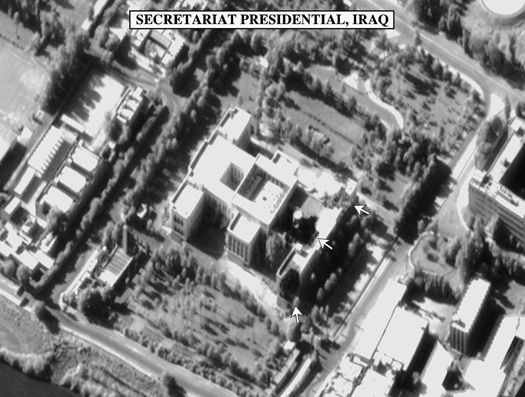
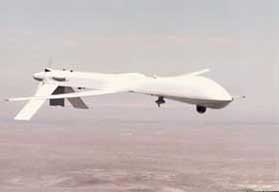
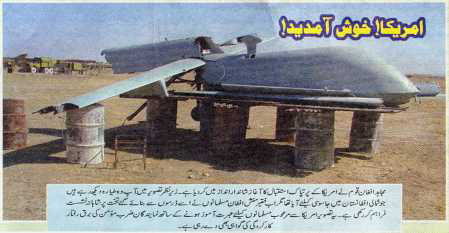
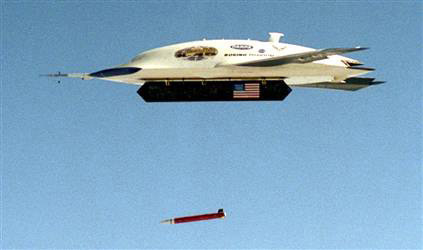
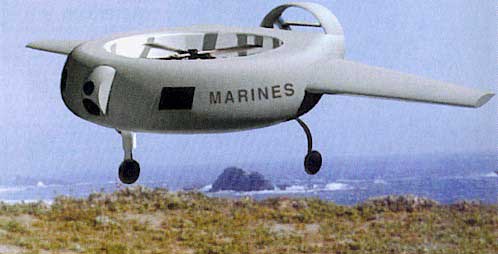
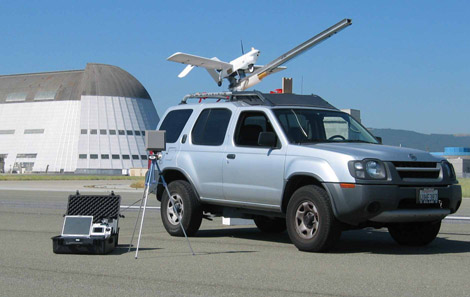
Actuators
Attitude control can be obtained by several mechanisms, specifically:
Thrusters
Vernier thrusters are the most common actuators, as they may be used for station keeping as well. Thrusters must be organized as a system to provide stabilization about all three axes, and at least two thrusters are generally used in each axis to provide torque as a couple in order to prevent imparting a translation to the vehicle. Their limitations are fuel usage, engine wear, and cycles of the control valves. The fuel efficiency of an attitude control system is determined by its specific impulse (proportional to exhaust velocity) and the smallest torque impulse it can provide (which determines how often the thrusters must fire to provide precise control). Thrusters must be fired in one direction to start rotation, and again in the opposing direction if a new orientation is to be held. Thruster systems have been used on most manned space vehicles, including Vostok, Mercury, Gemini, Apollo, Soyuz, and the Space Shuttle.
To minimize the fuel limitation on mission duration, auxiliary attitude control systems may be used to reduce vehicle rotation to lower levels, such as small ion thrusters that accelerate ionized gases electrically to extreme velocities, using power from solar cells.
Spin stabilization
The entire space vehicle itself can be spun up to stabilize the orientation of a single vehicle axis. This method is widely used to stabilize the final stage of a launch vehicle. The entire spacecraft and an attached solid rocket motor are spun up about the rocket's thrust axis, on a "spin table" oriented by the attitude control system of the lower stage on which the spin table is mounted. When final orbit is achieved, the satellite may be de-spun by various means, or left spinning. Spin stabilization of satellites is only applicable to those missions with a primary axis of orientation that need not change dramatically over the lifetime of the satellite and no need for extremely high precision pointing. It is also useful for missions with instruments that must scan the star field or Earth's surface or atmosphere.
Momentum wheels
These are electric motor driven rotors made to spin in the direction opposite to that required to re-orient the vehicle. Because momentum wheels make up a small fraction of the spacecraft's mass and are computer controlled, they give precise control. Momentum wheels are generally suspended on magnetic bearings to avoid bearing friction and breakdown problems. To maintain orientation in three dimensional space a minimum of three must be used,[6] with additional units providing single failure protection.
Control moment gyros
These are rotors spun at constant speed, mounted on gimbals to provide attitude control. Although a CMG provides control about the two axes orthogonal to the gyro spin axis, triaxial control still requires two units. A CMG is a bit more expensive in terms of cost and mass, because gimbals and their drive motors must be provided. The maximum torque (but not the maximum angular momentum change) exerted by a CMG is greater than for a momentum wheel, making it better suited to large spacecraft. A major drawback is the additional complexity, which increases the number of failure points. For this reason, the International Space Station uses a set of four CMGs to provide dual failure tolerance.
Solar sails
Small solar sails (devices that produce thrust as a reaction force induced by reflecting incident light) may be used to make small attitude control and velocity adjustments. This application can save large amounts of fuel on a long-duration mission by producing control moments without fuel expenditure. For example, Mariner 10 adjusted its attitude using its solar cells and antennas as small solar sails.
Gravity-gradient stabilization
In orbit, a spacecraft with one axis much longer than the other two will spontaneously orient so that its long axis points at the planet's center of mass. This system has the virtue of needing no active control system or expenditure of fuel. The effect is caused by a tidal force. The upper end of the vehicle feels less gravitational pull than the lower end. This provides a restoring torque whenever the long axis is not co-linear with the direction of gravity. Unless some means of damping is provided, the spacecraft will oscillate about the local vertical. Sometimes tethers are used to connect two parts of a satellite, to increase the stabilizing torque. A problem with such tethers is that meteoroids as small as a grain of sand can part them.
Magnetic torquers
Coils or (on very small satellites) permanent magnets exert a moment against the local magnetic field. This method works only where there is a magnetic field against which to react. One classic field "coil" is actually in the form of a conductive tether in a planetary magnetic field. Such a conductive tether can also generate electrical power, at the expense of orbital decay. Conversely, by inducing a counter-current, using solar cell power, the orbit may be raised. Due to massive variability in Earth's magnetic field from an ideal radial field, control laws based on torques coupling to this field will be highly non-linear. Moreover, only two-axis control is available at any given time meaning that a vehicle reorient may be necessary to null all rates.
Pure passive attitude control
There exist two main passive control types for satellites. The first one uses gravity gradient, and it leads to four stable states with the long axis (axis with smallest moment of inertia) pointing towards Earth. As this system has four stable states, if the satellite has a preferred orientation, e.g. a camera pointed at the planet, some way to flip the satellite and its tether end-for-end is needed. The other passive system orients the satellite along Earth's magnetic field thanks to a magnet.[7] These purely passive attitude control systems have limited pointing accuracy, because the spacecraft will oscillate around energy minima. This drawback is overcome by adding damper, which can be hysteretic materials or a viscous damper. The viscous damper is a small can or tank of fluid mounted in the spacecraft, possibly with internal baffles to increase internal friction. Friction within the damper will gradually convert oscillation energy into heat dissipated within the viscous damper.
XO___XO DW SWWS The satellite and the scientific instruments
The scientific payload
The configuration of the scientific payload and the energy bands covered by the different instruments are presented in Fig. 1 (click here) and Fig. 2 (click here) respectively. The wide band capability is provided by a set of instruments co-aligned with the Z axis of the satellite (Fig. 1 (click here)), Narrow Field Instruments (hereafter NFI) and consisting of (Table 1 (click here)):- MECS (Medium Energy Concentrator Spectrometers): a medium energy (1.3-10 keV) set of three identical grazing incidence telescopes with double cone geometry (Citterio et al. 1985; Conti et al. 1994), with position sensitive gas scintillation proportional counters in their focal planes (Boella et al. 1996 and references therein).
- LECS (Low Energy Concentrator Spectrometer): a low energy (0.1-10 keV) telescope, identical to the other three, but with a thin window position sensitive gas scintillation proportional counter in its focal plane (Parmar et al. 1996 and references therein).
- HPGSPC, a collimated High Pressure Gas Scintillation Proportional Counter (4-120 keV, Manzo et al. 1996 and references therein).
- PDS, a collimated Phoswich Detector System (15-300 keV, Frontera et al. 1996 and references therein).
Finally, the four lateral active shields of the PDS will be used as monitor of gamma-ray bursts with a fluence greater than about
Each instrument (the four NFI and the two WFC's) is controlled by a dedicated computer which has, in particular, the task of performing on board pre-processing of the scientific data according to the acquisition mode required by the specific observation. The basic mode is the Direct mode, in which each single event is transmitted with the full information. For sources fainter than about 0.3 Crab (

Figure 1: BeppoSAX scientific payload accommodation
The spacecraft and the other subsystems
The main characteristics of the spacecraft are presented in Table 2 (click here). BeppoSAX is a three axes stabilized satellite, with a pointing accuracy of 1'. The main attitude constraint derives from the need to maintain the normal to the solar arrays withinWith the solar panels closed, the spacecraft is 3.6 m in height and 2.7 m in diameter. The total mass amounts to 1400 kg, with a payload of 480 kg. The structure of the satellite consists of three basic functional subassemblies:
- the Service Module, in the lower part of the spacecraft, which houses all the subsystems and the electronic boxes of the scientific instruments;
- the Payload Module, which houses the scientific instruments and the Star trackers;
- the Thermal Shade Structure, that encloses the Payload Module.
- The Attitude Orbital Control System (AOCS), that performs attitude determination and manoeuvres and operates the Reaction Control Subsystem in charge of orbit recovering. It includes redundant magnetomers, Sun acquisition sensors, three star trackers, six gyroscopes (three of which are for redundancy), three magnetic torquers and four reaction wheels, all controlled by a dedicated computer. The AOCS ensures a pointing accuracy of 1' during source observations and manoeuvres with a slew rate of
 per min.
 - The On Board Data Handler (OBDH) is the core for data management and system control on the satellite and it also manages the communication interfaces between the satellite and the ground station. Its computer supervises all subsystem processor activities, such as those of each instrument, and the communication busses.
- Other subsystems are devoted to managing the power generated by the solar panels and battery energy storage (Electric Power and Solar Array Subsystem), to raising the orbit in case of decay below 450 km (Reaction Control Subsystem), to controlling the temperature of the satellite (Thermal Control Subsystem) and to ensure communication with the Ground Station (Telemetry Tracking and Command Subsystem).

Figure 2: Energy coverage of BeppoSAX instrument

Table 2: BeppoSAX: spacecraft main characteristics

Table 3: BeppoSAX: launch, orbit
Ground operations
BeppoSAX was launched on April 30 1996 by an Atlas-Centaur directly into a 600 km, 96 min orbit atThe satellite is operated directly from the Operation Control Center (OCC) in Rome, through a bidirectional (command transmission and telemetry data collection) Intelsat link between the OCC and the Telemetry and Telecommand (TT&C) station located on the equator at the Italian base near Malindi (Kenya). The satellite passes over the TT&C station every orbit for a contact period of 10 minutes. During each pass the Ground Station performs the following activities: telecommand up-linking; mass memory downloading; spacecraft doppler and ranging; spacecraft time sinchronization.
The OCC is the core of the satellite operational management with the following activities: telecommand generation and validation, orbit and attitude determination; short-term telemetry archiving; health monitoring of satellite and its sub-systems.
As part of the OCC, the Scientific Operation Center (SOC) will deal specifically with scientific operations: monitoring of payload parameters; quick-look analysis of scientific data in real time, aimed in particular to bright X-ray transients discovery and Target of Opportunity (TOO) alert; short and long term scheduling.
The Scientific Data Center (SDC) is located in Rome, at the same site as the OCC. Along with the Mission Scientist it is the main interface of the scientific community to the BeppoSAX project. Its main tasks are: collection and archiving of the proposals from the scientific community (Sect. 5.2); production of the list of observations from the approved proposals to be processed by the OCC for schedule generation; archiving of telemetry on optical disks; production and distribution of data (FOT= Final Observing Tape) to the observers; off-line analysis of quick look data for TOO follow up program's assessment; integration, development and maintainance of scientific software and calibrations along with the Institutes of the BeppoSAX Consortium; distribution of calibration data, software and general information about the mission; support to guest observers for data analysis and proposal preparation; set up of the results data base.
The Mission Scientist overviews all the scientific activities of the program, and in tight contact with the other scientific components, takes care in particular of: schedule of observations and TOO; calibrations of instruments; issue of Announcement of Opportunities and the technical description of the mission .
Scientific capabilities of BeppoSAXinstruments
In Fig. 3 () we show the effective area of the BeppoSAX instruments. Note that the effective area of the NFI is increasing with energy following a power law with positive slope. This will partially compensate for the spectral shape of the celestial objects, though not quite completely, because the HPGSPC and PDS are generally background dominated whereas MECS and LECS are source dominated (Fig. 4 ()). A relevant property of the BeppoSAX scientific payload is the broad overlapping energy response of the various instruments, that will allow cross-calibration of the instruments.
Figure 3: Effective area of BeppoSAX instruments

Figure 4: Five sigma BeppoSAX NFI instrument sensitivity for a 100 ksec exposure. For the HPGSPC and PDS it was assumed to point for half of the time off-source to measure the background. Spectra of representative galactic and extragalactic sources are shown
4.1. Scientific capabilities of the LECS and MECS
The four X-ray optics with GSPC's detector in the focal plane have been designed to deliver:- an effective area around 7 keV sufficient to detect in
- an energy resolution of 8% @ 6 keV and 25% @ 0.6 keV, that below 0.6 keV becomes comparable with that of a CCD ;
- spectral coverage below the carbon edge (0.3 keV), where the LECS detector will provide 2-3 independent energy bins;
- reasonable imaging capabilities (1.5 arcmin @ 6 keV). Combined with their energy resolution, they will perform spatially resolved spectroscopy of extended sources such as clusters of galaxies and supernova remnants. Furthermore they will do spectral measurements on weak point-like sources (
In Fig. 5 () we show the capability of the combined LECS and MECS to perform spectral measurements of thin plasma spectra. Taking as reference a 30% error on the relevant parameters we see that the temperature can be determined down to
In case of sources with power law spectra, such as AGN, spectral index measurements can be carried out down to fluxes
An example of the capability of studying narrow features is shown in Fig. 8 (), where an OVII edge at 0.8 keV and a broad iron line at 6.4 keV (FWHM = 0.7 keV) in a typical Seyfert 1 galaxy are well resolved by the LECS and MECS respectively.

Figure 5: Capability of LECS and MECS in measuring spectral parameters of thin plasma spectra. The relative error on the temperature (continuous lines), iron abundance (dotted lines) and lighter elements abundance (dashed lines) are shown as a function of the source flux for exposure times of

Figure 6: Spectral index determination by the combined NFI. The relative error on the spectral index is given as a function of the flux for three values of the index (

Figure 7: Simulation of a spectrum of an AGN with

Figure 8: Simulation of an observation by BeppoSAX-NFI (40000 s) of a Seyfert 1 galaxy (MCG-6-30-15) with several of the features observed in the last 10 years by different satellites: a soft excess below 1 keV (EXOSAT), an edge of ionized oxygen at 0.8 keV (ROSAT, ASCA), a broad iron line (
4.2. Scientific capabilities of the HPGSPC and PDS
The high energy instruments aboard BeppoSAX are respectively a high pressure (5 atm. Xe) GSPC and a scintillator (NaI/CsI) phoswich detector system. Several solutions have been implemented to minimize systematic effects and the background in these collimated detectors:- the background is monitored continuosly rocking the collimators on and off source with a typical period of one minute;
- the environmental background due to high energy particles is much lower than that of other current and near future missions, thanks to the low inclination orbit;
- the HPGSPC will be the first detector ever flown on a satellite to implement the technique of the fluorescence gate (Manzo et al. 1980) that will allow to decrease the background substantially above the Xenon edge (34 keV);
- both detectors have an active equalization system that will keep the gain within 0.5-0.25%.
The PDS was specifically designed in order to minimize background so as to increase its sensitivity to background dominated sources (basically below 200 mCrab). From this point of view the expected performance should be comparable or better than that of the HEXTE detector aboard XTE (Bradt et al. 1993). XTE, on the other hand, remains superior for bright sources, given its larger area aimed to priviledge the timing information. The PDS sensitivity allows spectral measurements up to 200 keV for sources of about 1 mCrab (
The main scientific motivation that lead to the design of the HPGSPC and its inclusion in the payload is its unprecedented energy resolution, 4% @60 keV, that will allow detailed line spectroscopy in hard X-rays. The spectroscopic capabilities of HPGSPC and PDS are illustrated in Fig. 9 (), that represents a simulation of a possible cyclotron absorption spectrum of a bright transient,

Figure 9: Cyclotron lines in the transient
4.3. Narrow field instrument combined scientificcapabilities
The sensitivity curves of BeppoSAX NFI are given in Fig. 4 (click here) along with spectra of some typical galactic and extragalactic sources. Basically for AGN-like spectra it is possible to determine the spectrum up to 200 keV for sources down to about 1 mCrab. As an example in Fig. 8 ) we show the simulation of the combined BeppoSAX-NFI spectrum of a Seyfert 1 galaxy, namely MCG-6-30-15, with all the spectral component and features detected by several satellites in the past. Starting from the low energy part there is: a soft excess observed by EXOSAT (Pounds et al. 1986), an OVII edge around 0.8 keV observed by ROSAT (Nandra & Pounds 1992) and ASCA (Fabian et al. 1994), an iron line at 6.4 keV and a high energy bump above 10 keV detected by GINGA (Matsuoka et al. 1990). All these components can be measured with good accuracy with BeppoSAX in a single shot for the first time.4.4. Scientific capabilities of WFC
The sensitivity of the WFC depends on the pointing direction in the sky, because each source in the field of view contributes to the overall background. Towards high-galactic latitude the Cosmic Diffuse X-Ray Background is the main contributor to the background. In this case the sensitivity is at the order of a few mCrab inOn the basis of the

Figure 10: Five sigma sensitivity of one WFC

Figure 11: The spectrum of a AGN (2.5 mCrab) observed by one WFC in 40000 s
Scientific program
Scientific objectives
Given the instrument capabilities over the wide energy range described in the previous sections, BeppoSAX can provide an important contribution in several areas of X-ray astronomy (Perola 1990) such as:- Compact galactic sources: Shape and variability of the various continuum components and of the narrow spectral features (e.g. iron line, cyclotron lines); phase resolved spectroscopy. Discovery and study of X-ray transients.
- Active Galactic Nuclei: spectral shape and variability of the continuum and of the narrow and broad features from 0.1 to 200 keV in bright objects (soft excess, warm and cold absorption and related O and Fe edges, iron line and high energy bump, high energy cut-off); spectral shape and variability of different classes of AGN down to 1/20 of 3C 273 up to 100-200 keV; spectra of weak AGN (e.g. high redshift objects) up to 10 keV.
- Clusters of galaxies: spatially resolved spectra of nearby objects and the study of temperature gradients; chemical composition and temperature of more distant clusters.
- Supernova remnants: spatially resolved spectra of extended remnants; spectra of Magellanic Cloud remnants.
- Normal Galaxies: spectra from 0.1 to 10 keV of the extended emission.
- Stars: multi-temperature spectra of stellar coronae from 0.1 to 10 keV; temperature/spatial structure of coronae by observation of eclipsing binary systems; evolution of flares.
- Gamma-ray bursts: temporal profile with 1 msec resolution from 60 to 600 keV. X-ray counterparts of a subset with positional accuracy of 5'.
Strategy and operations
Due to the constraint on the solar panel orientation (Sect. 2.2), the sky region accessible to the NFI at any time is a bandWith a lifetime of two - four years, BeppoSAX will be able to perform 1000-2000 pointings with durations from
Spacecraft & Instruments
Spacecraft Subsystems
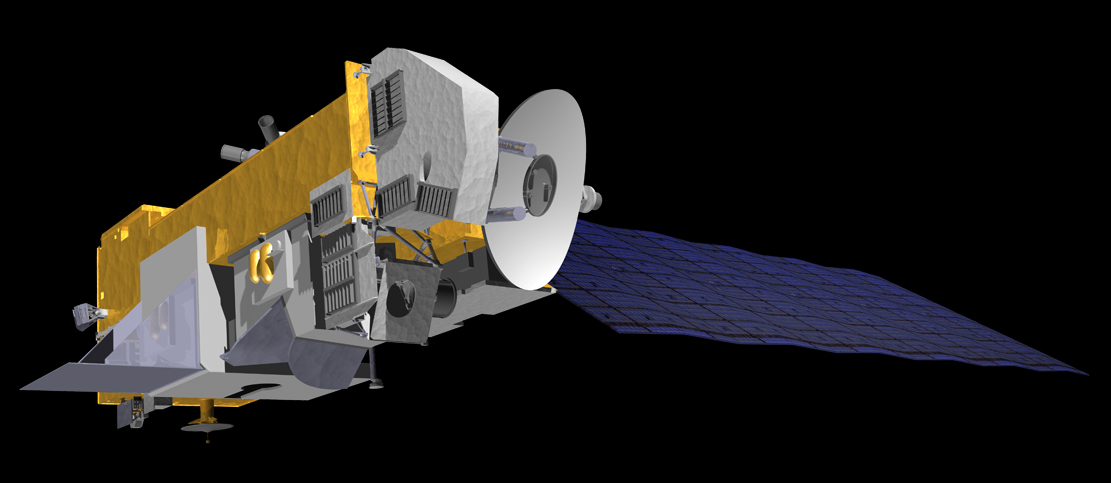
The spacecraft structure is a lightweight 'eggcrate' compartment construction made of graphite epoxy composite over honeycomb core, providing a strong but light base for the science instruments. The weight of the structure is approximately 700 kg., significantly lighter than a comparable aluminium structure, leaving more of the launcher weight-lift capability for science measurements.
A deployable flat-panel solar array with over 20,000 silicon solar cells provides 4600 watts of power in sunlight. While in sunlight, a portion of the solar array power, driven to always face the sun, charges a 24 cell nickel-hydrogen battery which powers the spacecraft and the instruments when the spacecraft is in night phase of the orbit.
The data system can handle over 100 gigabits of scientific data stored on-board. All spacecraft data are then relayed via an X-band communication system to one of two polar region ground stations each orbit. The spacecraft can also broadcast scientific data directly to ground stations over which it is passing. The ground stations also have an S-band uplink capability for spacecraft and science instrument operations.
The S-band communication subsystem also can communicate through NASA's TDRSS synchronous satellites in order to periodically track the spacecraft, calculate the orbit precisely, and issue commands to adjust the orbit to maintain it within defined limits.
Spacecraft attitude is maintained by stellar-inertial, and momentum wheel-based attitude controls with magnetic momentum unloading, through interaction with the magnetic field of the Earth that provide accurate pointing for the instruments. Typical pointing knowledge of the line of sight of the instruments to the Earth is on the order of one arc minute (about 0.02 degrees)
Electronic components are housed on panels internally, leaving the spacecraft 'deck' available for the four science instruments, and providing them a wide field of view. The side of the spacecraft away from the Sun is devoted to thermal radiators, which radiate excess heat to space and provide the proper thermal balance for the entire spacecraft.
A propulsion system of four small one-pound thrust hydrazine monopropellant rockets gives the spacecraft a capability to adjust its orbit periodically to compensate for the effects of atmospheric drag, so that the orbit can be precisely controlled to maintain altitude and the assigned ground track.
Satellite Equipment
The following figures illustrate the various systems and configurations of the spacecraft.
Spacecraft Configuration
Spacecraft Equipment Configuration
Launch Vehicle Interfaces
Instrument Field of View Accommodation
Instrument synergy
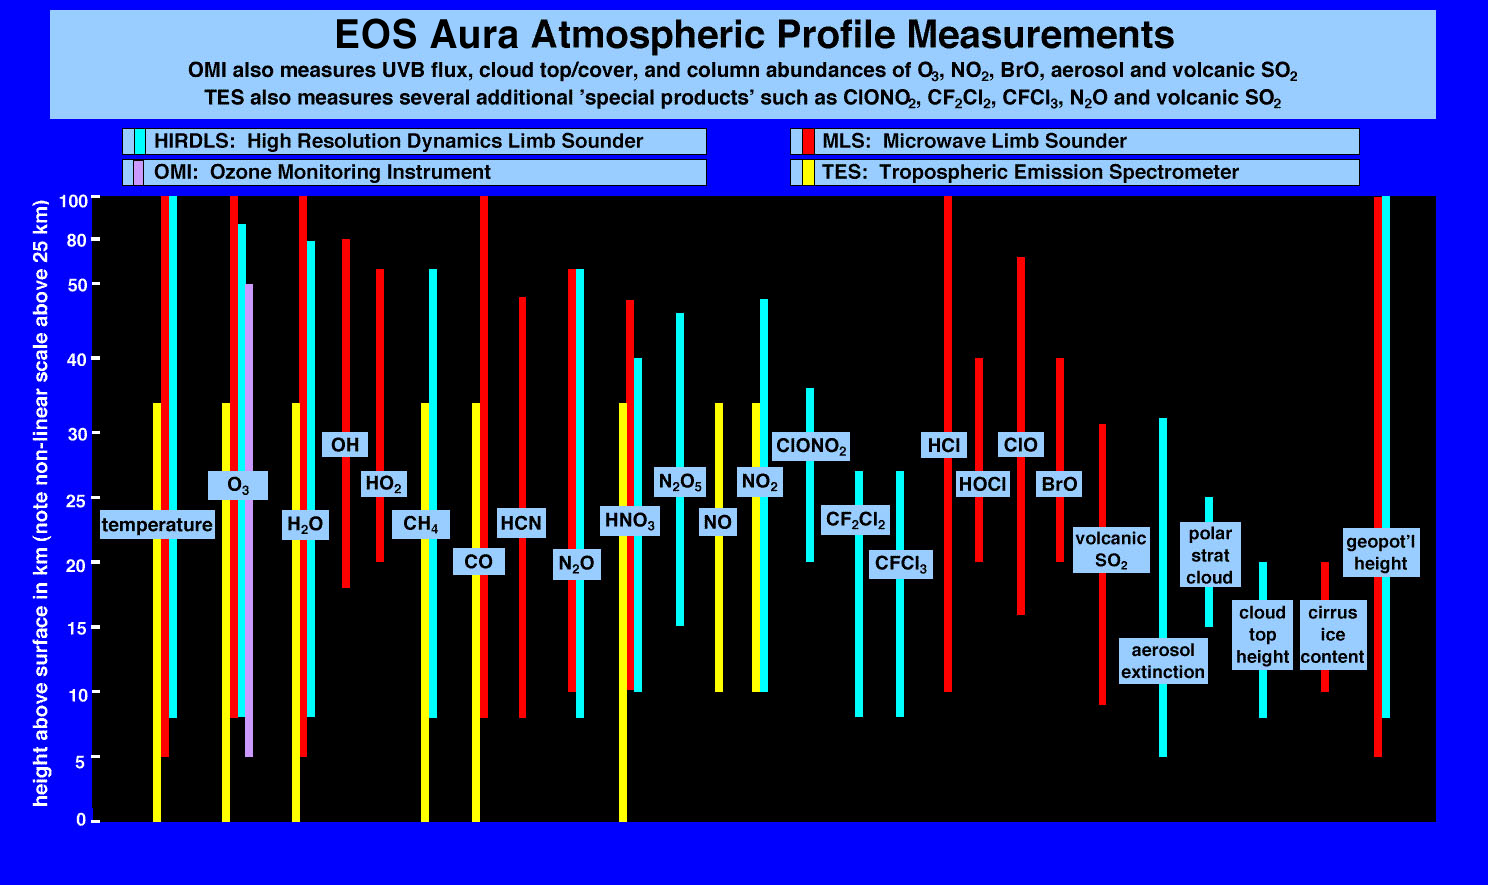
MLS will provide high vertical resolution profiles which are nearly simultaneous with the OMI observations, and which extend down to and below the tropopause. Thus it will be possible to combine observations from these three instruments with meteorological data to produce effective separation of the stratospheric component of the total column ozone and thus provide an estimate of the tropospheric ozone column (sometimes called the residual). The residual can be compared with TES tropospheric profiles of NO2 and O3. The combination of instruments will make it possible to understand the stratospheric and tropospheric contributions to O3 as well as the transport, physical and chemical processes which effect their distributions.
This table summarizes the atmospheric parameters measured by HIRDLS , MLS , OMI , and TES . The altitude range where these parameters are measured are shown as the vertical scale. In several cases the measurements overlap which provides independent perspectives and cross calibration of the measurements.

Figure 1: Artist's rendition of the Aura spacecraft )image credit: NGST)
Spacecraft:
The Aura spacecraft, like Aqua, is based on TRW's modular, standardized AB1200 bus design with common subsystems. [Note: As of Dec. 2002, TRW was purchased by NGST (Northrop Grumman Space Technology) of Redondo Beach, CA]. The S/C dimensions are: 2.68 m x 2.34 m x 6.85 m (stowed) and 4.71 m x 17.03 m x 6.85 m (deployed). Aura is three-axis stabilized, with a total mass of 2,967 kg at launch, S/C mass of 1,767 kg, payload mass =1,200 kg. The S/C design life is six years. 7)

Figure 2: Illustration of the Aura spacecraft (image credit: NGST)
The spacecraft structure is a lightweight 'eggcrate' compartment construction made of graphite epoxy composite over honeycomb core, providing a strong but light base for the science instruments (referred to as T330 EOS common spacecraft design). A deployable flat-panel solar array with over 20,000 silicon solar cells provides 4.6 kW of power.
Spacecraft attitude is maintained by stellar-inertial, and momentum wheel-based attitude controls with magnetic momentum unloading, through interaction with the magnetic field of the Earth that provide accurate pointing for the instruments. Typical pointing knowledge of the line of sight of the instruments to the Earth is on the order of one arcminute (about 0.02º).
A propulsion system of four small-thrust hydrazine monopropellant thrusters gives the spacecraft a capability to adjust its orbit periodically to compensate for the effects of atmospheric drag, so that the orbit can be precisely controlled to maintain altitude and the assigned ground track.

Figure 3: Alternate view of the Aura spacecraft (image credit: NASA)
Launch: A launch of Aura on a Delta-2 7920 vehicle from VAFB, CA, took place on July 15, 2004.
Orbit: Sun-synchronous circular orbit, altitude = 705 km, inclination = 98.7º, with a local equator crossing time of 13.45 (1:45 PM) on the ascending node. Repeat cycle of 16 days.
RF communications: Onboard storage capacity of 100 Gbit of payload data. The payload data are downlinked in X-band. The spacecraft can also broadcast scientific data directly to ground stations over which it is passing. The ground stations also have an S-band uplink capability for spacecraft and science instrument operations. The S-band communication subsystem also can communicate through NASA's TDRSS synchronous satellites in order to periodically track the spacecraft, calculate the orbit precisely, and issue commands to adjust the orbit to maintain it within defined limits.
Formation flight:
The Aura spacecraft is part of the so-called "A-train" (Aqua in the lead and Aura at the tail, the nominal separation between Aqua and Aura is about 15 minutes) or "afternoon constellation" (formation flight starting sometime after the Aura launch). The objective is to coordinate observations and to provide a coincident set of data on aerosol and cloud properties, radiative fluxes and atmospheric state essential for accurate quantification of aerosol and cloud radiative effects. The orbits of Aqua and CALIPSO are tied to WRS (Worldwide Reference System) and have error boxes associated with their orbits. The overall mission requirements are written such that CALIPSO is required to be no greater than 2 minutes behind Aqua. The OCO mission of NASA is a late entry into the A-train sequence. The satellites are required to control their along-track motions and remain within designated "control boxes." Member satellites will exchange orbital position information to maintain their orbital separations. 8) 9) 10) 11)12)
The A-train is part of GOS (Global Observing System), an international network of platforms and instruments, to support environmental studies of global concern. A draft implementation plan for GOS, also referred to as GEOSS ((Global Earth Observation System of Systems), was approved at the fourth Earth Observation summit in Tokyo in April 28, 2004.

Figure 4: Illustration of Aura spacecraft in the A-train (image credit: NASA)
The PARASOL spacecraft of CNES (launch on Dec. 18, 2004) is part of the A-train as of February 2005. The OCO mission (launch in 2009) will be the newest member of the A-train. Once completed, the A-train will be led by OCO, followed by Aqua, then CloudSat, CALIPSO, PARASOL, and, in the rear, Aura. 13)
Note: The OCO (Orbiting Carbon Observatory) spacecraft experienced a launch failure on Feb. 24, 2009 - hence, it is not part of the A-train.
Note: The OCO (Orbiting Carbon Observatory) spacecraft experienced a launch failure on Feb. 24, 2009 - hence, it is not part of the A-train.
Mission status:
• June 6, 2018: OMI 14 years in space. OMI was novel in that it was the first UV-Vis Earth remote-sensing instrument to employ a two-dimensional CCD detector. OMI revolutionized the study of trace gas pollutants from space, allowing for accurate emissions to be mapped globally. Until the recent launch of its descendent, TROPOMI (TROPOspheric Monitoring Instrument) on the European Space Agency (ESA) Sentinel 5 precursor satellite, OMI had the highest spatial resolution of any instrument of its kind. Many satellite instruments now use a similar design including the Ozone Mapping Profiler Suite (OMPS) nadir mapper on the NASA/NOAA Suomi National Polar Partnership (NPP) satellite and Joint Polar Satellite System (JPSS) series. The NASA Earth Ventures Instrument 1 (EVI-1) TEMPO (Tropospheric Emissions: Monitoring of Pollution) that will be launched into geostationary orbit will also employ a similar detector, sweeping across North America hourly. 14) — This paper documents the many scientific areas where OMI has made significant contributions. 15)
Topics Covered:
- air quality monitoring, air quality forecasting, pollution events, and trends
- top-down emission estimates
- monitoring of volcanoes
- monitoring of the spectral solar irradiance
- Montreal Protocol, total ozone, and UV-radiation
- tropospheric ozone
- research data products, such as glyoxal (CHO-CHO) columns and absorbing aerosol above cloud
- multi-platform products and analyses including A-train synergy
- complementary aircraft and field campaigns.
The trace-gas and radiation products from OMI include criteria pollutants, sulfur dioxide (SO2), nitrogen dioxide (NO2), and ozone (O3), as well as formaldehyde, an O3 precursor and UV-B radiation at the surface (image credit: Measurements and data products are from the Aura Ozone Monitoring Instrument (OMI). We acknowledge greatly the Aura OMI instrument and algorithm teams for their extensive satellite data products that have enabled hundreds of refereed studies in the scientific literature with thousands of citations. OMI is a Dutch–Finnish contribution to the NASA Aura mission)
These products can be used on their own or together for scientific studies. Studies of the trends of the trace gases over OMI's lifetime have been particularly interesting as often the human emissions of these gases has changed faster than was predicted. For example, a recent study by Li et al. (2017) showed that India is surpassing China as the leading emitted of SO2. The dramatic decline in SO2 emissions from China as their fuel consumption actually increased is due to emissions controls. This decline was more rapid than even the most optimistic projections.

Figure 5: OMI mission averages (2004–2016) for NO2 (a), absorbing aerosol index (AAI; b), HCHO (c), and SO2 (d). Total ozone column (O3; e) and surface UVB amount (f) are shown for 24 September 2006, the day with a record size ozone hole (image credit: OMI study team, Ref. 15)
• February 2018: NASA ended the operation of the TES (Tropospheric Emission Spectrometer) instrument on 31 January 2018, after almost 14 years of discovery. TES was the first instrument designed to monitor ozone in the lowest layers of the atmosphere directly from space. Its high-resolution observations led to new measurements of atmospheric gases that have altered our understanding of the Earth system. 16)
- TES was planned for a five-year mission but far outlasted that term. A mechanical arm on the instrument began stalling intermittently in 2010, affecting TES's ability to collect data continuously. The TES operations team adapted by operating the instrument to maximize science operations over time, attempting to extend the data set as long as possible. However, the stalling increased to the point that TES lost operations about half of last year. The data gaps hampered the use of TES data for research, leading to NASA's decision to decommission the instrument. It will remain on the Aura satellite, receiving enough power to keep it from getting so cold it might break and affect the two remaining functioning instruments.
- "The fact that the instrument lasted as long as it did is a testament to the tenacity of the instrument teams responsible for designing, building and operating the instrument," said Kevin Bowman of NASA/JPL (Jet Propulsion Laboratory) in Pasadena, CA, the TES principal investigator.
- A True Earth System Sounder: TES was originally conceived to measure ozone in the troposphere, the layer of atmosphere between the surface and the altitude where intercontinental jets fly, using high-spectral-resolution observations of thermal infrared radiation. However, TES cast a wider net, capturing signatures of a broad array of other atmospheric gases as well as ozone. That flexibility allowed the instrument to contribute to a wide range of studies — not only atmospheric chemistry and the impacts of climate change, but studies of the cycles of water, nitrogen and carbon.
- One of the surprises of the mission was the measurement of heavy water: water molecules composed of deuterium, an isotope of hydrogen that has more neutrons than normal hydrogen. The ratio of deuterium to "normal" water in water vapor gives clues to the vapor's history — how it evaporated and fell as precipitation in the past — which in turns helps scientists discern what controls the amount in the atmosphere.
- Heavy water data have led to fundamental advances in our understanding of the water cycle that were not possible before, such as how tropical thunderstorms keep the troposphere hydrated, how much water in the atmosphere is evaporated from plants and soil as compared to surface water, and how water "exhaled" from southern Amazon vegetation jump-starts the rainforest's rainy season. JPL scientist John Worden, the pioneer of this measurement, said, "It's become one of the most important applications of TES. It gives us a unique window into Earth's hydrological cycle."
- While the nitrogen cycle isn't as well measured or understood as the water cycle, nitrogen makes up 78 percent of the atmosphere, and its conversion to other chemical compounds is essential to life. TES demonstrated the first space measurement of a key nitrogen compound, ammonia. This compound is a widely used fertilizer for agriculture in solid form, but as a gas, it reacts with other compounds in the atmosphere to form harmful pollutants.
- Another nitrogen compound, peroxyacetyl nitrate (PAN), can be lofted into the troposphere from fires and human emissions. Largely invisible in data collected at ground level, this pollutant can travel great distances before it settles back to the surface, where it can form ozone. TES showed how PAN varied globally, including how fires influenced its distribution. "TES really paved the way in our global understanding of both PAN and [ammonia], two keystone species in the atmospheric nitrogen cycle," said Emily Fischer, an assistant professor in the department of atmospheric science at Colorado State University, Fort Collins.

Figure 6: TES collected spectral "signatures," illustrated here, of ozone and other gases in the lower atmosphere (image credit: NASA)
- The Three Faces of Ozone: Ozone, a gas with both natural and human sources, is known for its multiple "personalities." In the stratosphere ozone is benign, protecting Earth from incoming ultraviolet radiation. In the troposphere, it has two distinct harmful functions, depending on altitude. At ground level it's a pollutant that hurts living plants and animals, including humans. Higher in the troposphere, it's the third most important human-produced greenhouse gas, trapping outgoing thermal radiation and warming the atmosphere.
- TES data, in conjunction with data from other instruments on Aura, were used to disentangle these personalities, leading to a significantly better understanding of ozone and its impact on human health, climate and other parts of the Earth system.
- Air currents in the mid- to upper troposphere carry ozone not only across continents but across oceans to other continents. A 2015 study using TES measurements found that the U.S. West Coast's tropospheric ozone levels were higher than expected, given decreased U.S. emissions, partly because of ozone that blew in across the Pacific Ocean from China. The rapid growth in Asian emissions of precursor gases — gases that interact to create ozone, including carbon monoxide and nitrogen dioxide — changed the global landscape of ozone.
- "TES has borne witness to dramatic changes in which the gases that create ozone are produced. TES's remarkably stable measurements and ability to resolve the layers of the troposphere allowed us to separate natural changes from those driven by human activities," said JPL scientist Jessica Neu, a coauthor of the study.
- Regional changes in emissions of ozone precursor gases alter not only the amount of ozone in the troposphere, but its efficiency as a greenhouse gas. Scientists used TES measurements of ozone's greenhouse effect, combined with chemical weather models, to quantify how the global patterns of these emissions have altered climate. "In order to both improve air quality and mitigate climate change, we need to understand how human pollutant emissions affect climate at the scales in which policies are enacted [that is, at the scale of a city, state or country]. TES data paved the way for how satellites could play a central role," said Daven Henze, an associate professor in the department of mechanical engineering at the University of Colorado at Boulder.
- A Pathfinder Mission: "TES was a pioneer, collecting a whole new set of measurements with new techniques, which are now being used by a new generation of instruments," Bowman said. Its successor instruments are used for both atmospheric monitoring and weather forecasting. Among them are the National Oceanic and Atmospheric Administration's Cross-track Infrared Sounder (CrIS) instrument on the NOAA-NASA Suomi-NPP satellite and the IASI (Infrared Atmospheric Sounding Interferometer) series, developed by the French space agency in partnership with EUMETSAT, the European meteorological satellite organization.
- Cathy Clerbaux, a senior scientist with CNES (Centre National de la Recherche Scientifique) who is the leading scientist on the IASI series, said, "TES's influence on later missions like ours was very important. TES demonstrated the possibility of deriving the concentration of atmospheric gases by using interferometry to observe their molecular properties. Although similar instruments existed to sound the upper atmosphere, TES was special in allowing measurements nearer the surface, where pollution lies. The scientific results obtained with IASI greatly benefited from the close collaboration we developed with the TES scientists."
- TES scientists have been pioneers in another way: by combining the instrument's measurements with those of other instruments to produce enhanced data sets, revealing more than either original set of observations. For example, combining OMI (Ozone Monitoring Instrument) on Aura's measurements in ultraviolet wavelengths with TES's thermal infrared measurements gives a data set with enhanced sensitivity to air pollutants near the surface.
- The team is now applying that capability to measurements by other instrument pairs - for example, enhanced carbon monoxide (CO) from CrIS with CO and other measurements from TROPOMI (TROPOspheric Monitoring Instrument) on the European Space Agency's Copernicus Sentinel-5 Precursor satellite. "The application of the TES algorithms to CrIS and TROPOMI data will continue the 18-year record of unique near-surface carbon monoxide measurements from MOPITT (Measurement of Pollution in the Troposphere instrument) on NASA's Terra' satellite into the next decade," said Helen Worden, a scientist at the National Center for Atmospheric Research in Boulder, Colorado, who is both the principal investigator of MOPITT and a TES science team member.
- These new techniques developed for TES along with broad applications throughout the Earth System assure that the mission's legacy will continue long after TES's final farewell.
• January 2018: Using Aura's OMI (Ozone Monitoring Instrument) sulfur dioxide data collected between 2005-2015, a multi-decade record was produced using prior SO2 emission data from 1980 to the present. 17) (see also Ref. 26)
- This study uses satellite measurements of vertical column densities (VCD: the total number of molecules per unit area) of sulfur dioxide (SO2), a criteria air pollutant, to establish a link between reported SO2 emissions, OMI SO2VCDs measured by satellites, and surface SO2 concentration measurements.
- The results highlight the value of long-term, consistent satellite observations in detecting changes on both global and regional scales. It has been demonstrated that the PCA (Principal Component Analysis) algorithm is capable of producing highly consistent SO2 data between Aura/OMI and the new generation operational NASA-NOAA polar partnership Suomi-NPP/OMPS UV spectrometer. The algorithm can also be implemented with the NASA/NOAA JPSS-1/OMPS and ESA Sentinel 5 Precursor TROPOMI UV spectrometer, as well as future geostationary sensors such as NASA/TEMPO and Korean GEMS.

Figure 7: These animated gif maps (1980 - 2015) show annual mean SO2 VCD (DU) calculated using the plume model applied to the reported bottom-up emission data. Annual emission data from ~380 SO2 sources (black dots) that emitted 1 kt yr-1 at least once in 2005-2015 were included in the calculations (image credit: NASA)
• January 4, 2018: For the first time, scientists have shown through direct satellite observations of the ozone hole that levels of ozone-destroying chlorine are declining, resulting in less ozone depletion. Measurements show that the decline in chlorine, resulting from an international ban on chlorine-containing manmade chemicals called chlorofluorocarbons (CFCs), has resulted in about 20 percent less ozone depletion during the Antarctic winter than there was in 2005 — the first year that measurements of chlorine and ozone during the Antarctic winter were made by NASA's Aura satellite. 18) 19)
- "We see very clearly that chlorine from CFCs is going down in the ozone hole, and that less ozone depletion is occurring because of it," said lead author Susan Strahan, an atmospheric scientist from NASA's Goddard Space Flight Center in Greenbelt, Maryland.
- CFCs are long-lived chemical compounds that eventually rise into the stratosphere, where they are broken apart by the Sun's ultraviolet radiation, releasing chlorine atoms that go on to destroy ozone molecules. Stratospheric ozone protects life on the planet by absorbing potentially harmful ultraviolet radiation that can cause skin cancer and cataracts, suppress immune systems and damage plant life.
- Two years after the discovery of the Antarctic ozone hole in 1985, nations of the world signed the Montreal Protocol on Substances that Deplete the Ozone Layer, which regulated ozone-depleting compounds. Later amendments to the Montreal Protocol completely phased out production of CFCs.
- Past studies have used statistical analyses of changes in the ozone hole's size to argue that ozone depletion is decreasing. This study is the first to use measurements of the chemical composition inside the ozone hole to confirm that not only is ozone depletion decreasing, but that the decrease is caused by the decline in CFCs. The study was published Jan. 4 in the journal Geophysical Research Letters. 20)
- The Antarctic ozone hole forms during September in the Southern Hemisphere's winter as the returning sun's rays catalyze ozone destruction cycles involving chlorine and bromine that come primarily from CFCs. To determine how ozone and other chemicals have changed year to year, scientists used data from the MLS (Microwave Limb Sounder) aboard the Aura satellite, which has been making measurements continuously around the globe since mid-2004. While many satellite instruments require sunlight to measure atmospheric trace gases, MLS measures microwave emissions and, as a result, can measure trace gases over Antarctica during the key time of year: the dark southern winter, when the stratospheric weather is quiet and temperatures are low and stable.
- The change in ozone levels above Antarctica from the beginning to the end of southern winter — early July to mid-September — was computed daily from MLS measurements every year from 2005 to 2016. "During this period, Antarctic temperatures are always very low, so the rate of ozone destruction depends mostly on how much chlorine there is," Strahan said. "This is when we want to measure ozone loss."
- They found that ozone loss is decreasing, but they needed to know whether a decrease in CFCs was responsible. When ozone destruction is ongoing, chlorine is found in many molecular forms, most of which are not measured. But after chlorine has destroyed nearly all the available ozone, it reacts instead with methane to form hydrochloric acid, a gas measured by MLS. "By around mid-October, all the chlorine compounds are conveniently converted into one gas, so by measuring hydrochloric acid we have a good measurement of the total chlorine," Strahan said.
- Nitrous oxide is a long-lived gas that behaves just like CFCs in much of the stratosphere. The CFCs are declining at the surface but nitrous oxide is not. If CFCs in the stratosphere are decreasing, then over time, less chlorine should be measured for a given value of nitrous oxide. By comparing MLS measurements of hydrochloric acid and nitrous oxide each year, they determined that the total chlorine levels were declining on average by about 0.8 percent annually.
- The 20 percent decrease in ozone depletion during the winter months from 2005 to 2016 as determined from MLS ozone measurements was expected. "This is very close to what our model predicts we should see for this amount of chlorine decline," Strahan said. "This gives us confidence that the decrease in ozone depletion through mid-September shown by MLS data is due to declining levels of chlorine coming from CFCs. But we're not yet seeing a clear decrease in the size of the ozone hole because that's controlled mainly by temperature after mid-September, which varies a lot from year to year."
- Looking forward, the Antarctic ozone hole should continue to recover gradually as CFCs leave the atmosphere, but complete recovery will take decades. "CFCs have lifetimes from 50 to 100 years, so they linger in the atmosphere for a very long time," said Anne Douglass, a fellow atmospheric scientist at Goddard and the study's co-author. "As far as the ozone hole being gone, we're looking at 2060 or 2080. And even then there might still be a small hole."
• November 14, 2017: A new study by researchers from the University of Maryland and NASA indicates that China has greatly reduced its emissions of sulfur dioxide, while India's emissions have risen dramatically. Sulfur dioxide (SO2) is an air pollutant that leads to acid rain, haze, and many health-related problems. It is primarily produced today through the burning of coal to generate electricity. 21)
- Although China and India remain the world's largest consumers of coal, the new research found that China's sulfur dioxide emissions have fallen by 75 percent since 2007, while India's emissions have increased by 50 percent. The results suggest that India may soon become, if it is not already, the world's top emitter of sulfur dioxide. Previous research has shown that sulfur dioxide emissions in the United States have been steadily dropping.
- "The rapid decrease of sulfur dioxide emissions in China far exceeds expectations and projections," said Can Li, an atmospheric chemist in the University of Maryland's Earth System Science Interdisciplinary Center and at NASA's Goddard Space Flight Center. "This suggests that China is implementing sulfur dioxide controls beyond what climate modelers have taken into account."
- The maps of Figures 8 and 9 show regional views of sulfur dioxide emissions as observed by the Dutch-Finnish OMI (Ozone Monitoring Instrument ) on NASA's Aura spacecraft. The values are yearly averages of sulfur dioxide concentrations over India and China in 2005 and 2016. The data come from the study that was published on November 9, 2017, in the journal Scientific Reports. 22)
- China and India are now the world's top consumers of coal, which typically contains up to 3 percent sulfur. Most of the sulfur dioxide emissions come from coal-fired power plants and coal-burning factories. In particular, Beijing suffers from severe haze problems because of the factories and power plants located nearby and upwind.
- Starting in the early 2000s, China began implementing policies such as fining polluters, setting emission reduction goals, and lowering emissions limits. According to the new study, these efforts are paying off. "Sulfur dioxide levels in China declined dramatically even though coal usage increased by approximately 50 percent and electricity generation grew by over 100 percent," explained Li. "This suggests that much of the reduction is coming from controlling emissions." Previous studies, which relied on ground-based inventories and published policies, projected that China's sulfur dioxide emissions would not fall to current levels until 2030 at the earliest.
- Despite the 75 percent drop in sulfur dioxide emissions, recent work by other scientists has shown that the country's air quality remains poor and still causes significant health problems. This may be because sulfur dioxide contributes just 10 to 20 percent of the particles that cause haze. "If China wants to bring blue skies back to Beijing," Li said, "the country needs to also control other air pollutants."
- By contrast, India's sulfur dioxide emissions increased by 50 percent over the past decade. The country opened its largest coal-fired power plant in 2012 and has yet to implement emission controls like China. "Right now, India's increased sulfur dioxide emissions are not causing as many health or haze problems as they do in China, because the largest emission sources are not in the most densely populated area of India," Li said. "However, as demand for electricity grows in India, the impact may worsen."

Figure 8: Changes in SO2 observations over China between 2005 and 2016 with OMI on Aura of NASA, expressed in Dobson Units (1 DU = 2.69 x 10¹⁶ molecules cm-2). The values are yearly averages of SO2concentrations [image credit: NASA Earth Observatory, images by Jesse Allen, using OMI data courtesy of Chris McLinden (Environment Canada), story by Irene Ying (University of Maryland), with Mike Carlowicz (NASA Earth Observatory)]

Figure 9: Changes in SO2 observations over India between 2005 and 2016 with OMI on Aura of NASA, expressed in Dobson Units (1 DU = 2.69 x 10¹⁶ molecules cm-2). The values are yearly averages of SO2concentrations [image credit: NASA Earth Observatory, images by Jesse Allen, using OMI data courtesy of Chris McLinden (Environment Canada), story by Irene Ying (University of Maryland), with Mike Carlowicz (NASA Earth Observatory)]
• November 7, 2017: Ozone pollution near Earth's surface is one of the main ingredients of summertime smog and a primary cause of poor air quality. Yet it is not directly measurable from space because of the abundance of ozone higher in the atmosphere, which obscures measurements of surface ozone. Now NASA-funded researchers have devised a way to use satellites to measure the precursor gases that contribute to ozone formation. By differentiating among three possible conditions that lead to ground-level ozone production, the observations may assist air quality managers in assessing the most effective approaches to emission reduction and air quality improvements. 23)
- At high altitude, ozone acts as Earth's sunscreen from harmful ultraviolet radiation. At low altitudes, ozone is a health hazard contributing to respiratory problems like asthma and bronchitis. Near the ground, the gas is formed through complex chemical reactions initiated by sunlight and involving VOCs (Volatile Organic Compounds) and NOx (Nitrogen Oxides). It turns out that formaldehyde (a VOC) and nitrogen dioxide (NO2), are measurable from space by the Dutch-Finnish OMI (Ozone Monitoring Instrument) aboard NASA's Aura satellite.
- We are using satellite data to analyze the chemistry of ozone from space," said lead author Xiaomeng Jin of the Lamont-Doherty Earth Observatory, Columbia University. The research was published in the Journal of Geophysical Research: Atmospheres. 24)
- Through a combination of computer models and space-based observations, Jin and colleagues used the concentrations of the precursor molecules to infer whether ozone production at a given location increases more in the presence of NOx, VOCs, or a mix of the two. Their study regions focused on North America, Europe, and East Asia during the summer, when abundant sunlight triggers the highest rates of ozone formation. To understand their impact on ozone formation, the team investigated whether VOC or NOx was the ingredient that most limited ozone formation. If emissions of that molecule can be reduced, then ozone formation will be reduced—critical information for air quality managers.
- "We are asking: ‘If I could reduce either VOCs or NOx, which one is going to get me the biggest bang for my buck in terms of the amount of ozone that we can prevent from being formed in the lower atmosphere?'" said co-author and atmospheric chemist Arlene Fiore of Lamont-Doherty, who is also a member of NASA's Health and Air Quality Applied Sciences Team.
- The researchers found that the urban regions that they studied (shown in Figure 10) are more often VOC-limited or in a transitional state between VOC and NOx-limited. Looking at 12 years of Aura measurements, they also found that circumstances can change. For instance, New York City's ozone production in the summer of 2005 was limited by VOCs; by 2015, it had transitioned to a NOx-limited system thanks to pollution controls put into place at regional and national levels. This transition means future NOx reductions will likely further decrease ozone production, Jin said.
- Volatile organic compounds occur naturally; they are most often emitted by trees in the form of formaldehyde. They can also arise from paint fumes, cleaning products, and pesticides, and they are a by-product of burning fossil fuels in factories and automobiles. Nitrogen oxides are a byproduct of burning fossil fuels and are abundant in cities, where they are emitted by power plants, factories, and cars. Because VOCs have a large natural source (trees) in the eastern United States, for example, emission reduction plans have focused on NOx, which is overwhelmingly produced by human activities and therefore more controllable.

Figure 10: OMI on NASA's Aura satellite acquired these data in the timeframe 2005-2015 (image credit: NASA Earth Observatory, image by Joshua Stevens, using data from Xiaomeng Jin, et al. (2017). Story by Ellen Gray, NASA's Earth Science News Team, with Mike Carlowicz, Earth Observatory)
Legend to Figure 10: The top row shows OMI HCHO/NO2 for 3 world regions in 2005, while the bottom row shows the same ratio for 2015. In the U.S. and Europe, major decreases in NOx emissions have caused this ratio to increase, indicating that ozone production is more sensitive now vs. a decade ago to further reductions in NOx emissions. The changes in the ratios over East Asia indicate a patchwork of emission changes and concomitant changes in ozone production sensitivities. 25)
• October 24, 2017: Reported sulfur dioxide (SO2/ emissions from US and Canadian sources have declined dramatically since the 1990s as a result of emission control measures. Observations from OMI (Ozone Monitoring Instrument) on NASA's Aura satellite and ground-based in situ measurements are examined to verify whether the observed changes from SO2 abundance measurements are quantitatively consistent with the reported changes in emissions. To make this connection, a new method to link SO2 emissions and satellite SO2 measurements was developed. The method is based on fitting satellite SO2 VCDs (Vertical Column Densities) to a set of functions of OMI pixel coordinates and wind speeds, where each function represents a statistical model of a plume from a single point source. 26)
- The concept is first demonstrated using sources in North America and then applied to Europe. The correlation coefficient between OMI-measured VCDs (with a local bias removed) and SO2 VCDs derived here using reported emissions for 1º by 1º gridded data is 0.91 and the best-fit line has a slope near unity, confirming a very good agreement between observed SO2 VCDs and reported emissions. Having demonstrated their consistency, seasonal and annual mean SO2 VCD distributions are calculated, based on reported point-source emissions for the period 1980–2015, as would have been seen by OMI. This consistency is further substantiated as the emission-derived VCDs also show a high correlation with annual mean SO2 surface concentrations at 50 regional monitoring stations.

Figure 11: Annual mean OMI SO2 VCDs from the PCA (Principal Component Analysis) algorithm (column I), mean OMI SO2 VCDs with a large-scale bias removed (column II), results of the fitting of OMI data by the set of functions that represent VCDs near emission sources using estimated emissions (see text) (column III), and SO2 VCDs calculated using the same set of functions but using reported emission values (column IV). Point sources that emitted 20 kt yr-1 at least once in the period 2005–2015 were included in the fit (they are shown as the black dots). Results of the fitting of OMI data by the set of functions that represent "sources" as 0.5º by 0.5º grid cells (shown as the black dots) using estimated emissions (see text) are shown in column V. The maps are smoothed by the pixel averaging technique with a 30 km radius (Fioletov et al., 2011). Averages for four multi-year periods – 2005–2006, 2007–2009, 2010–2012, and 2013–2015 – over the area 32.5º to 43º N and 75º to 89ºW are shown (image credit: collaborative Aura/OMI team)

Figure 12: The same as Figure 11, columns I–IV, but for the part of Europe where the majority of SO2 point sources are located. Point sources that emitted 10 kt yr-1 at least once in the period 2005–2014 were included in the fit (they are shown as the black dots). High SO2 values related to the Mt. Etna volcano in Sicily are excluded from the OMI plots. The area 35.6º to 56.6º N and 10ºW to 28.4º E is shown (image credit: collaborative Aura/OMI team)
• May 26, 2017: For more than a decade, the OMI (Ozone Monitoring Instrument) on NASA's Aura satellite has observed changes in a critical air pollutant: sulfur dioxide (SO2). In addition to harming human health, the gas reacts with water vapor to produce acid rain. Sulfur dioxide also can react in the atmosphere to form aerosol particles, which can contribute to outbreaks of haze and influence the climate. 27)
- Natural sources (volcanoes, fires, phytoplankton) produce sulfur dioxide, but burning sulfur-rich fossil fuels—primarily coal, oil, and petroleum—is the main source of the gas. Smelter ovens, which are used to concentrate metals found in ore, also produce it.
- Since Aura launched in 2004, scientists at Environment and Climate Change Canada, NASA Goddard Space Flight Center, University of Maryland, Michigan Technological University, and other research centers have been refining their analytical techniques and developing increasingly accurate ways of identifying and monitoring major sources of sulfur dioxide. This has produced an increasingly clear picture of where the gas comes from and how the amount entering the atmosphere has changed over time.
- The story of change that OMI has witnessed over North America is particularly varied and interesting. In some areas, emissions have dropped significantly; in others, they rose. In many areas, human activities played the dominant role; in others, natural processes did.
- In 2016, scientists published a global catalog of large sulfur dioxide sources as observed by OMI. Of the 92 major "hot spots" of sulfur dioxide in North America, 9 of them are volcanoes, 71 are power plants, 4 are smelters, and 8 are oil refineries. Note that some of the hot spots may represent multiple sources. The bulk of emissions in North America come from human activity; volcanoes represent about 30 percent of the total emissions.
- As seen in the maps of Figures 13 and 14, one of the most noticeable changes occurred in the Ohio Valley of the eastern United States. Sulfur dioxide in that region comes mainly from coal-fired power plants. According to OMI, emissions dropped by more than 80 percent between 2005 and 2016, mainly because of new technologies, laws, and regulations that promoted cleaner burning.
- Major sulfur dioxide sources in Mexico include several power plants in western Mexico, oil infrastructure in and along the Bay of Campeche, and active volcanoes. In particular, Popocatépetl, which is just 70 km from Mexico City, is near several power plants and oil refineries. "There are very few places in the world where such strong anthropogenic and volcanic sulfur dioxide sources are so close together," noted Simon Carn of Michigan Tech.
- OMI detected more sulfur dioxide over Mexico in 2016 than in 2005, according to the researchers. However, the mix of sources in Mexico makes it more difficult to understand the change. In 2017, Carn authored a study indicating that degassing at Popocatépetl had roughly doubled the volcano's emissions. (Note: Degassing is a constant process that occurs even when a volcano is not actively erupting).
- Meanwhile, other research based on OMI observations suggests that emissions from gas and oil facilities in and around the Gulf of Campeche also increased. The 10 to 15 percent increase OMI observed from industrial sources in Mexico, the researchers pointed out in a 2016 study, is not reflected in ground-based emissions inventories, which report a significant decline in emissions. The hotspots from power plants in western Mexico show more mixed trends. Some have shown decreases, while others have stayed roughly the same.
- There are fewer sulfur dioxide sources in the Caribbean, but OMI has observed a subtle increase over some smelters and power plants. A much more notable shift occurred around the volcanic island of Montserrat. Though the volcano was a significant source of the gas in 2005, its emissions have declined significantly since 2010.

Figure 13: Sulfur Dioxide emissions in North America observed by OMI on NASA's Aura satellite in 2005 (image credit: NASA Earth Observatory, image by Jesse Allen, story by Adam Voiland)

Figure 14: Sulfur Dioxide emissions in North America observed by OMI on NASA's Aura satellite in 2016 (image credit: NASA Earth Observatory, image by Jesse Allen, story by Adam Voiland)
• March 22, 2017: When the oil refinery in San Nicolas, Aruba, shut its doors in 2009, a silent change took place. Above the azure seas and chimney stacks, the air began to clear as sulfur dioxide (SO2) emissions plummeted (Figure 15). 28)
Note: Aruba is a small island (179 km2), a constituent country of the Kingdom of the Netherlands, located in the southern Caribbean Sea, 29 km north of the coast of Venezuela.
Note: Aruba is a small island (179 km2), a constituent country of the Kingdom of the Netherlands, located in the southern Caribbean Sea, 29 km north of the coast of Venezuela.
- Invisible to the human eye, SO2 can disrupt human breathing and harm the environment when it combines with water vapor to make acid rain. It tends to concentrate in the air above power plants, volcanoes, and oil and gas infrastructure, such as the refinery in Aruba. Using data collected by OMI (Ozone Monitoring Instrument) on the Aura satellite, the researchers mapped the noxious gas as observed over a decade.
- "Previous papers focused on particular regions; this is the first real global view," said Nickolay Krotkov of NASA/GSFC (Goddard Space Flight Center), an author of the study published in Atmospheric Chemistry and Physics. The data gives a mixed outlook across the planet, with emissions rising in some places (India) and falling in others (China and the United States).
- As a regional example of the changes, the researchers examined the fluctuations in SO2 levels around Aruba. The prevailing winds, or trade winds, naturally blow air to the west of the refineries. Light purple patches over the ocean indicate areas where SO2 has decreased over time.
- After the San Nicolas refinery halted operations in late 2009, its SO2 output dropped. But by mid-2011, the refinery was reopened and SO2 emissions were back to their previous levels of roughly 350 kilotons per year. When low oil prices caused the refinery to cut back production, emissions follow a downward curve until mid-2013, when the San Nicolas plant was converted to a product terminal. The graph of Figure 16 plots its emissions over the years.
- The same downturns in the global oil market that have put the fate of the San Nicolas operation in limbo have also affected the nearby Paraguaná Refinery Complex, which is the largest of its kind in Latin America. The 2010 and 2011 images show dark spots in the Gulf of Venezuela—likely, emissions from Paraguaná (Figure 15).

Figure 15: Plots of SO2 emissions acquired with OMI on Aura in various time slots over Aruba and Venezuela (image credit: NASA Earth Observatory, images by Joshua Stevens, using emissions data courtesy of Fioletov, Vitali E., et al. (2017))

Figure 16: SO2 emission history at San Nicolas Refinery, Aruba, acquired by OMI in the timeframe 2004-2014 (image credit: NASA Earth Observatory, images by Joshua Stevens, using emissions data courtesy of Fioletov, Vitali E., et al. (2017))
• March 10, 2017: Volcanoes erupt, spewing ash and rock. Their scarred flanks sometimes run with both lava and landslides. Such eruptions are dramatic, but sporadic. - A less dramatic but important volcanic process is the continuous, mostly quiet emission of gas. A number of volcanoes around the world continuously exhale water vapor laced with heavy metals, carbon dioxide, hydrogen, sulfide and sulfur dioxide, among many other gases. Of these, sulfur dioxide (SO2) is the easiest to detect from space. 29)
- In a new study published in Scientific Reports this week, a team of researchers reported on a new global inventory of sulfur dioxide emissions from volcanoes. They compiled emissions data gathered by the Dutch-Finnish OMI (Ozone Monitoring Instrument) on NASA's Aura satellite, and then produced annual emissions estimates for 91 active volcanoes worldwide. The maps of Figures 17 and 18 depict the emissions from volcanoes in the Aleutian Island chain off Alaska and in the islands of Indonesia. 30)
- "Many people may not realize that volcanoes are continuously releasing quite large amounts of gas, and may do so for decades or even centuries," said Michigan Technological University volcanologist Simon Carn, the lead author of the study. "Because the daily emissions are smaller than a big eruption, the effect of a single plume may not seem noticeable. But the cumulative effect of all volcanoes can be significant. In fact, on average, volcanoes release most of their gas when they are not erupting."
- Carn and his team found that volcanoes collectively emit 20 to 25 million tons of sulfur dioxide (SO2) into the atmosphere each year. This number is higher than the previous estimate (made from ground measurements in the 1990s) because the new research includes data on more volcanoes, including some that scientists have never visited.
- The sulfur dioxide released by volcanoes is half as much as the amount released by human activities, according to co-author Vitali Fioletov, an atmospheric scientist at Environment and Climate Change Canada. He has been working with satellite observations and wind data to catalog SO2 emissions sources (human and volcanic) and trace them back to their sources.
- Manmade emissions of sulfur dioxide have been declining in many countries due to stricter pollution and technological advances. As those emissions decrease, the relative importance of persistent volcanic emissions rises. These new data will help refine climate and atmospheric chemistry models and provide more insight into human and environmental health risks. Atmospheric processes convert SO2 into sulfate aerosols—small suspended particles in the atmosphere that reflect sunlight back into space and can cause a cooling effect on climate. Sulfate aerosols near the land surface are harmful to breathe. Higher in the atmosphere, they become the primary source of acid rain.
- Tracking sulfur dioxide emissions via satellite also could help with eruption forecasting, as noticeable increases in SO2 gas releases may precede eruptions. "It is complementary to ground-based monitoring," Carn said. "Ground-based measurements are crucial, but the satellite data could allow us to target new measurements at unmonitored volcanoes more effectively, leading to better estimates of volcanic carbon dioxide emissions."
- Field measurements of SO2 emissions are improving, but they are still too sparse for a cohesive global picture. That's where the new inventory is handy: it gathers data from remote volcanoes and provides consistent measurements over time from the world's biggest emitters, including Ambrym in Vanuatu and Kilauea in Hawaii.
- "Satellites provide us with a unique big-picture view of volcanic emissions that is difficult to obtain using other techniques," Carn said. "We can use this to look at trends in sulfur dioxide emissions on the scale of an entire volcanic arc."

Figure 17: Mean SO2 columns (in Dobson Units [DU]; 1 DU = 2.69 x 10¹⁶ molecules cm-2) acquired with OMI (Ozone Monitoring Instrument) on NASA's Aura satellite during the period 2014-2016 over the Aleutian Islands (image credit: NASA Earth Observatory, maps created by Jesse Allen using OMI data provided by Chris McLinden, caption by Allison Mills)

Figure 18: Mean SO2 columns acquired with OMI (Ozone Monitoring Instrument) on NASA's Aura satellite during the period 2014-2016 over the Indonesian Islands (image credit: NASA Earth Observatory, maps created by Jesse Allen using OMI data provided by Chris McLinden, caption by Allison Mills)
• Instrument status after more than 12 years on orbit in December 2016: Three of Aura's four original instruments continue to function nominally; however, TES (Tropospheric Emissions Spectrometer) is about to reach the end of its expected life. Aura data are being widely used by the science and applications community, and in many instances Aura data are being applied in conjunction with data from other instruments that fly onboard satellites that make up the A-Train (Afternoon Constellation). 31)
- OMI (Ozone Monitoring Instrument) of KNMI has been extremely stable, making it highly suitable for ozone and solar irradiance trend analysis. OMI data have been used to study global and regional air-quality trends. 32)
- OMI and TES continue to yield significant science results that are being applied by operational environmental protection agencies for air quality assessments, regulations, and forecasts, both in the U.S. (EPA) and Europe. Although Aura does not measure carbon directly, it is making substantial contributions to understanding climate change by measurements of other climate forcing factors, such as, water vapor, solar irradiance, and aerosols. OMI and MLS (Microwave Limb Sounder) continue their crucial observations in the stratosphere that are needed for monitoring compliance of the Montreal Protocol.
• October 27, 2016: The size and depth of the ozone hole over Antarctica was not remarkable in 2016. As expected, ozone levels have stabilized, but full recovery is still decades away. What is remarkable is that the same international agreement that successfully put the ozone layer on the road to recovery is now being used to address climate change. 33)
- The stratospheric ozone layer protects life on Earth by absorbing ultraviolet light, which damages DNA in plants and animals (including humans) and leads to health issues like skin cancer. Prior to 1979, scientists had never observed ozone concentrations below 220 Dobson Units. But in the early 1980s, through a combination of ground-based and satellite measurements, scientists began to realize that Earth's natural sunscreen was thinning dramatically over the South Pole. This large, thin spot in the ozone layer each southern spring came to be known as the ozone hole.
- The image of Figure 19 shows the Antarctic ozone hole on October 1, 2016, as observed by the OMI (Ozone Monitoring Instrument) on NASA's Aura satellite. On that day, the ozone layer reached its average annual minimum concentration, which measured 114 Dobson Units. For comparison, the ozone layer in 2015 reached a minimum of 101 Dobson Units. During the 1960s, long before the Antarctic ozone hole occurred, average ozone concentrations above the South Pole ranged from 260 to 320 Dobson Units.
- The area of the ozone hole in 2016 peaked on September 28, 2016, at about 23 million km2. "This year we saw an ozone hole that was just below average size," said Paul Newman, ozone expert and chief scientist for Earth Science at NASA's Goddard Space Flight Center. "What we're seeing is consistent with our expectation and our understanding of ozone depletion chemistry and stratospheric weather."
- The image of Figure 20 was acquired on October 2 by the OMPS (Ozone Mapping Profiler Suite) instrumentation during a single orbit of the Suomi-NPP satellite. It reveals the density of ozone at various altitudes, with dark orange areas having more ozone and light orange areas having less. Notice that the word hole isn't literal; ozone is still present over Antarctica, but it is thinner and less dense in some areas.
- In 2014, an assessment by 282 scientists from 36 countries found that the ozone layer is on track for recovery within the next few decades. Ozone-depleting chemicals such as chlorofluorocarbons (CFCs) — which were once used for refrigerants, aerosol spray cans, insulation foam, and fire suppression — were phased out years ago. The existing CFCs in the stratosphere will take many years to decay, but if nations continue to follow the guidelines of the Montreal Protocol, global ozone levels should recover to 1980 levels by 2050 and the ozone hole over Antarctica should recover by 2070.
- The replacement of CFCs with hydrofluorocarbons (HFCs) during the past decade has saved the ozone layer but created a new problem for climate change. HFCs are potent greenhouse gases, and their use — particularly in refrigeration and air conditioning — has been quickly increasing around the world. The HFC problem was recently on the agenda at a United Nations meeting in Kigali, Rwanda. On October 15, 2016, a new amendment greatly expanded the Montreal Protocol by targeting HFCs, the so-called "grandchildren" of the Montreal Protocol.
- "The Montreal Protocol is written so that we can control ozone-depleting substances and their replacements," said Newman, who participated in the meeting in Kigali. "This agreement is a huge step forward because it is essentially the first real climate mitigation treaty that has bite to it. It has strict obligations for bringing down HFCs, and is forcing scientists and engineers to look for alternatives."

Figure 19: Image of the Antarctic Ozone Hole acquired with OMI on Aura on October 1, 2016 (image credit: NASA Earth Observatory, Aura OMI science team)

Figure 20: An edge-on (limb) view of Earth's ozone layer, acquired with OMPS on the Suomi-NPP on October 2, 2016 (image credit: NASA Earth Observatory, image by Jesse Allen, using Suomi-NPP OMPS data)
• June 1, 2016: Using a new satellite-based method, scientists at NASA, Environment and Climate Change Canada, and two universities have located 39 unreported and major human-made sources of toxic sulfur dioxide emissions. Data from NASA's Aura spacecraft were analyzed by scientists to produce improved estimates of sulfur dioxide sources and concentrations worldwide between 2005 and 2014. 34)
- A known health hazard and contributor to acid rain, sulfur dioxide (SO2) is one of six air pollutants regulated by the U.S. Environmental Protection Agency. Current, sulfur dioxide monitoring activities include the use of emission inventories that are derived from ground-based measurements and factors, such as fuel usage. The inventories are used to evaluate regulatory policies for air quality improvements and to anticipate future emission scenarios that may occur with economic and population growth.
- But, to develop comprehensive and accurate inventories, industries, government agencies and scientists first must know the location of pollution sources.
- "We now have an independent measurement of these emission sources that does not rely on what was known or thought known," said Chris McLinden, an atmospheric scientist with Environment and Climate Change Canada in Toronto and lead author of the study published this week in Nature Geosciences. "When you look at a satellite picture of sulfur dioxide, you end up with it appearing as hotspots – bull's-eyes, in effect — which makes the estimates of emissions easier." 35)
- The 39 unreported emission sources, found in the analysis of satellite data from 2005 to 2014, are clusters of coal-burning power plants, smelters, oil and gas operations found notably in the Middle East, but also in Mexico and parts of Russia. In addition, reported emissions from known sources in these regions were — in some cases — two to three times lower than satellite-based estimates.
- Altogether, the unreported and underreported sources account for about 12 percent of all human-made emissions of sulfur dioxide – a discrepancy that can have a large impact on regional air quality, said McLinden.
- The research team also located 75 natural sources of sulfur dioxide — non-erupting volcanoes slowly leaking the toxic gas throughout the year. While not necessarily unknown, many volcanoes are in remote locations and not monitored, so this satellite-based data set is the first to provide regular annual information on these passive volcanic emissions.
- "Quantifying the sulfur dioxide bull's-eyes is a two-step process that would not have been possible without two innovations in working with the satellite data," said co-author Nickolay Krotkov, an atmospheric scientist at NASA's Goddard Space Flight Center in Greenbelt, Maryland.
- First was an improvement in the computer processing that transforms raw satellite observations from the Dutch-Finnish Ozone Monitoring Instrument aboard NASA's Aura spacecraft into precise estimates of sulfur dioxide concentrations. Krotkov and his team now are able to more accurately detect smaller sulfur dioxide concentrations, including those emitted by human-made sources such as oil-related activities and medium-size power plants.
- Being able to detect smaller concentrations led to the second innovation. McLinden and his colleagues used a new computer program to more precisely detect sulfur dioxide that had been dispersed and diluted by winds. They then used accurate estimates of wind strength and direction derived from a satellite data-driven model to trace the pollutant back to the location of the source, and also to estimate how much sulfur dioxide was emitted from the smoke stack.
- "The unique advantage of satellite data is spatial coverage," said Bryan Duncan, an atmospheric scientist at Goddard. "This paper is the perfect demonstration of how new and improved satellite datasets, coupled with new and improved data analysis techniques, allow us to identify even smaller pollutant sources and to quantify these emissions over the globe." - The University of Maryland, College Park, and Dalhousie University in Halifax, Nova Scotia, contributed to this study.
• June 2015: The Aura satellite was launched in July 2004 as part of the A-Train. The three operating instruments on-board Aura MLS (Microwave Limb Sounder), OMI (Ozone Monitoring Instrument), and TES (Tropospheric Emissions Spectrometer) provide profiles and column measurements of atmospheric composition in the troposphere, stratosphere, and mesosphere. OMI is contributed from the Netherlands Space Office and the Finnish Meteorological Institute. The suite of observations from MLS, OMI and TES is very rich, with nearly 30 individual chemical species relevant for stratospheric chemistry (O3, HCl, HOCl, ClO, OClO, BrO, NO2, N2O, HNO3, etc.), tropospheric pollutants (O3, NO2, CO, PAN, NH3, SO2, aerosols), and climate-related quantities (CO2, H2O, CH4, clouds, aerosol optical properties). The Aura spacecraft is healthy and is expected to operate until at least 2022, likely beyond. There is great value in continuing the mission to: 36)
1) extend the unique 10-year record of stratospheric composition, variability, and trends as well as the chemical and dynamical processes affecting ozone recovery and polar ozone chemistry
2) continue to map-out rapidly changing anthropogenic emissions of NO2, SO2, and aerosol products influencing air quality
3) continue to develop greater vertical sensitivity by combining radiances from separate sensors
4) use Aura data to further evaluate global chemistry-climate, climate, and air quality models
5) extend observations of short-term solar variability overlapping with SORCE and providing a bridge to future measurements (GOME-2 TROPOMI)
6) continue the development of new synergetic products combining multiple Aura instruments and instruments from the A-Train
7) provide continuity and comparison to current and future satellite missions (Suomi-NPP, SAGE-III, TROPOMI)
8) deliver operational products: volcanic monitoring, aviation safety, operational ozone assimilation at NOAA for weather and UV index forecasting, OMI Aerosol Index and NO2 products for air quality forecasting. As such, the Panel concludes that Aura mission be continued as currently baselined.
The Aura spacecraft flight systems are operating on primary hardware with redundant systems intact and are expected to continue to perform very well through the proposed mission extension period. Aura Mission Operations have been very successful (Ref. 36).
• April 29, 2015: Late on April 22, 2015, the Calbuco volcano in southern Chile awoke from four decades of slumber with an explosive eruption. Ash and pumice particles were lofted high into the atmosphere, and the debris has been darkening skies and burying parts of Chile, Argentina, and South America for nearly a week. Along with 210 million cubic meters of ash and rock, the volcano has been spewing sulfur dioxide (SO2) and other gases. 37)
- Near the land surface, sulfur dioxide is a acrid-smelling gas that can cause respiratory problems in humans and animals. Higher in the atmosphere, it can have an effect on climate. When SO2 reacts with water vapor, it creates sulfate aerosols that can linger for months or years. Those small particles can have a cooling effect by reflecting incoming sunlight.
- The images of Figure 21 show the average concentration of sulfur dioxide over South America and surrounding waters between April 23–26, 2015. The maps were made with data from OMI (Ozone Monitoring Instrument) on NASA's Aura satellite. Like ozone, atmospheric sulfur dioxide is sometimes measured in Dobson Units. If you could compress all the sulfur dioxide in a column of atmosphere into a single layer at the Earth's surface at 0º Celsius, one Dobson Unit would be 0.01 mm thick and would contain 0.0285 grams of sulfur dioxide/m2.
- "Satellite sulfur dioxide data are critical for understanding the impacts of volcanic eruptions on climate," said Simon Carn, a part of the OMI team and professor at the Michigan Technological University. "Climate modelers need estimates of SO2 mass and altitude to run their models and accurately predict the atmospheric and climate impacts of volcanic eruptions. The SO2 plume images also provide unique insights into the atmospheric transport and dispersion of trace gases in the atmosphere, and on upper atmospheric winds."
- So far, Calbuco has released an estimated 0.3 to 0.4 teragrams (0.3 to 0.4 million tons) of SO2 into the atmosphere. The gas was injected into the stratosphere (as high as 21 km), where it will last much longer and travel much farther than if released closer to the surface. The SO2 will gradually convert to sulfate aerosol particles. However, it is not clear yet if there will be a cooling effect from this event.

Figure 21: The OLI measurements were acquired on four days in April 2015. On the maps, data appear in stripes or swaths, revealing the areas observed (colored) or not observed (clear) by the Aura spacecraft on a given day. Note how the plume moves north and east with the winds. By April 28, the plume of SO2 had reached the Indian Ocean (image credit: NASA Earth Observatory, Jesse Allen)

Figure 22: The natural color image, acquired on April 25, 2015 by the ALI (Advanced Land Imager) instrument on NASA's EO-1 (Earth Observing-1) satellite, shows Calbuco's plume rising above the cloud deck over Chile (image credit: NASA, EO-1 team)
• In early 2015, Aura is operating "nominally" in its extended mission phase. Although HIRDLS is no longer operational and the TES instrument shows signs of wear that have limited its operations, OMI and MLS continue to operate well. OMI's highly successful advanced technology has been and will continue to be employed by new NASA satellite instruments, such as OMPS (Ozone Mapper Profiling Suite) on the Suomi-NPP (Suomi National Polar-orbiting Partnership) and on the TEMPO (Tropospheric Emissions: Monitoring of Pollution) missions. Overall, the Aura mission continues to operate satisfactorily and there is enough fuel reserve for Aura to operate safely in the A-Train until 2023. 38)
- To date, the mission has met or surpassed nearly all mission success criteria. Aura data are being used by the U.S. GCRP (Global Change Research Program) and for three international assessments, including the AR5 (Fifth Assessment Report) of the IPCC (Intergovernmental Panel on Climate Change), the WMO (World Meteorological Organization) and UNEP/SAOD (United Nations' Environmental Program/Scientific Assessments of Ozone Depletion), and the TF HTAP (Task Force on Hemispheric Transport of Air Pollution).
- Aura's data have proven to be valuable for air quality applications such as identifying the trends that result from regulation of emissions on decadal time scales, and shorter time scale applications are being assessed. The original Aura science questions have surely been addressed or answered and serendipitous discoveries have been realized.
• On July 15, 2014, the Aura Spacecraft of NASA was 10 years on orbit. Aura has provided vital data about the cause, concentrations and impact of major air pollutants. With its four instruments measuring various gas concentrations, Aura gives a comprehensive view of one of the most important parts of Earth - the atmosphere. 39)

Figure 23: Nitrogen dioxide pollution, averaged yearly from 2005-2011, has decreased across the United States (image credit: NASA Goddard's Scientific Visualization Studio, T. Schindler)
Legend to Figure 23: The OMI (Ozone Monitoring Instrument) on the Aura satellite began monitoring levels of nitrogen dioxide worldwide shortly after its launch. OMI data show that nitrogen dioxide levels in the United States have decreased at a rate of 4% per year from 2005 to 2010 — a time period when stricter government policies on power plant and vehicle emissions came into effect. As a result, ground-level ozone concentrations also decreased. OMI data also showed a 2.5% decrease of nitrogen dioxide per year during the same time period in Europe, which had enacted similar legislation.
While air quality in the United States has improved, the issue still persists nationwide. Since bright sunlight is needed to produce unhealthy levels of ozone, ozone pollution is largely a summertime issue. As recent as 2012, about 142 million people in America— 47 % of the population— lived in counties with pollution levels above the National Ambient Air Quality Standards, according to the EPA (Environmental Protection Agency). The highest levels of ozone tend to occur on hot, sunny, windless days.
Air pollution also remains an issue worldwide. The WHO (World Health Organization) reported that air pollution still caused one in eight deaths worldwide in 2012. Outside of the United States and Europe, OMI showed an increase in nitrogen dioxide levels. Data from 2005 to 2010 showed China's nitrogen dioxide levels increased at about 6 % and South East Asia increased levels at 2% per year. Globally, nitrogen dioxide levels increased a little over half a percent per year during that time period (Ref. 39).
• Figure 24, released on June 8, 2014 in NASA's Earth Observatory program, was assembled from observations made by the OMI (Ozone Monitoring Instrument) on the Aura satellite. The map shows the concentration of stratospheric ozone over the Arctic—63º to 90º North—on April 1, 2014. Ozone is typically measured in Dobson Units, the number of molecules required to create a layer of pure ozone 0.01 mm thick at a temperature of 0º Celsius and an air pressure of 1 atmosphere (the pressure at the surface of the Earth). Reaching 470 Dobson Units, April 1 marked the highest average concentration of ozone over the region so far this year. The average amount of ozone in Earth's atmosphere is 300 Dobson Units, equivalent to a layer 3 mm in thickness. 40)

Figure 24: OMI map of Arctic ozone in spring acquired on April 1, 2014 (image credit: NASA Earth Observatory)
• The Aura spacecraft and three of its four instruments are operating nominally in 2014.
• December 2013: Introduction of a new algorithm for the OMI instrument to improve measurements of SO2 from space. 41) 42)
Sulfur dioxide (SO2), emitted from both man-made and volcanic activities, significantly impact air quality and climate. Advanced sensors including OMI (Ozone Monitoring Instrument) flying on NASA's Aura spacecraft have been employed to measure SO2 pollution. This however, remains a challenging problem owing to relatively weak signals from most anthropogenic sources and various interferences such as ozone absorption and stray light.
The project has developed a fundamentally different approach for retrieving SO2 from satellites. Unlike existing methods that attempt to model different interferences, we directly extract characteristic features from satellite radiance data to account for them, using a principal component analysis technique. This proves to be a computationally efficient way to use hundreds of wavelengths available from OMI, and greatly decreases modeling errors.
The new approach has the following features:
- 50% noise reduction compared with the operational OMI algorithm.
- Reduction of unrealistic features in the operational product.
- Computation efficiency (10 times faster than comparable methods relying on online radiative transfer calculation).
- Applicability to many instruments such as GOME-2 and the Suomi National Polar Partnership (NPP) Ozone Mapping and Profiler Suite (OMPS).
This new algorithm will significantly improve the SO2 data quality from the OMI mission. Once applied to other sensors, it will enable the production of consistent long-term global SO2 records essential for climate and air quality studies.

Figure 25: Monthly mean SO2 maps over the Eastern U.S. for August 2006 generated using (a) the new algorithm and (b) the operational algorithm (image credit: NASA/GSFC)
Legend to Figure 25: The circles represent large SO2 sources (e.g., coal-fired power plants) that emit more than 70,000 tons of SO2 annually. The colors represent the amount of SO2 in the atmospheric column above the surface in Dobson Unit (DU). 1 DU means 2.69 x 10¹⁶ SO2 molecules above a surface of 1 cm2 . Because the SO2 signals from anthropogenic sources are relatively weak, small errors in the estimated interferences (e.g., ozone absorption) may lead to substantial biases in the retrieved SO2. Negative values can arise when, for example, the contribution from ozone absorption in the SO2 spectral window is only slightly overestimated. As shown above, the negative retrieval biases become much smaller in the new algorithm.
Relevance for future science and NASA missions: The new algorithm has been proposed to reprocess data from the Aura OMI mission. It can be applied to Suomi-NPP and future JPSS OMPS instruments to ensure SO2 data continuity from the EOS era. It can also help extend satellite SO2 data records if applied to other current and future NASA and European missions such as TEMPO, GEO-CAPE, TROPOMI and GOME-2. TEMPO is the first selected NASA EVI (Earth Venture Instrument) and will be launched on a geostationary platform near the end of the decade (Ref. 41).
• June 2013: The 2013 Senior Review evaluated 13 NASA satellite missions in extended operations: ACRIMSAT, Aqua, Aura, CALIPSO, CloudSat, EO-1, GRACE, Jason-1, OSTM, QuikSCAT, SORCE, Terra, and TRMM. The Senior Review was tasked with reviewing proposals submitted by each mission team for extended operations and funding for FY14-FY15, and FY16-FY17. Since CloudSat, GRACE, QuikSCAT and SORCE have shown evidence of aging issues, they received baseline funding for extension through 2015. 43)
- The satellite is in excellent health. The Aura MLS, OMI and TES instruments are showing signs of aging, but are still producing science data of excellent quality, and there is an excellent chance of extending measurements beyond the current proposal cycle. The data are highly utilized in the research and operational communities.
- The reasons for extending the Aura mission include: (1) to allow current scientific and applied benefits to continue; (2) to increase the value of the Aura data for climate studies through increasing the length of the Aura data sets; (3) to allow continued collection of data that are unique since the loss of the European Envisat satellite; and (4) to continue to generate synergistic products by combining different Aura and measurements from other A-Train satellite missions.
• The Aura spacecraft and two of its four instruments (MLS and OMI) are operating nominally in 2013. The TES (Tropospheric Emission Spectrometer) instrument continues to make special observations in targeted regions, but no longer makes global measurements. A moving part of TES is suffering from lubricant degradation. 44)
• The Aura spacecraft and three of its four instruments are operating nominally in 2011.
• The Aura spacecraft and three of its four instruments are operating nominally in 2010. Aura entered its extended mission phase in October 2010 (extension until the end of 2012).
• The Aura spacecraft and three of its four instruments are operating nominally in 2009 (MLS, OMI and TES Operations are nominal while HIRDLS is collecting limited science data). 45)
• The spacecraft has been declared "operational" by NASA as of Oct. 14, 2004 (ending the commissioning phase). 46)
• Shortly after launch, the HIRDLS science team discovered, that a piece of plastic was blocking 80% of the optical instrument aperture. Engineers concluded that the plastic was torn from the inside of the instrument during the explosive outgassing on spacecraft ascent at launch. This plastic remains caught on the scan mirror despite efforts to free it. In spite of these setbacks, the HIRDLS team has shown that it can use the remaining 20% of the aperture to produce their promised data products at high vertical resolution. Unfortunately, the instrument no longer has its azimuthal scanning capability. 47) 48) 49)
Sensor complement: (HIRDLS, MLS, OMI, TES)
The Aura instrument package provides complementary observations from the UV to the microwave region of the EMS (Electromagnetic Spectrum) with unprecedented sensitivity and depth of coverage to the study of the Earth's atmospheric chemistry from its surface to the stratosphere. MLS is on the front of the spacecraft (the forward velocity direction) while HIRDLS, TES, and OMI are mounted on the nadir side. 50)

Figure 26: Auro atmospheric profile measurements (image credit: NASA)
Legend to Figure 26: OMI also measures UVB flux, cloud top/cover, and column abundances of O3, NO2, BrO, aerosol and volcanic SO2. TES also measures several additional 'spectral products' such as ClONO2, CF2Cl2, CFCl3, NO2, and volcanic SO2.

Figure 27: Instrument field-of-view accommodation (image credit: NASA)
HIRDLS (High-Resolution Dynamics Limb Sounder):
HIRDLS is a joint instrument between the University of Colorado at Boulder and Oxford University, Oxford, UK. PIs: J. Gille of the University of Colorado and J. Barnett, Oxford University; prime contractors are Lockheed Martin and Astrium Ltd., UK. The instrument is a mid-infrared limb-scanning spectroradiometer designed to sound the upper troposphere, stratosphere, and mesosphere emissions within the spectral range of 6 - 18 µm (21 channels). The instrument measures infrared thermal emissions from the atmosphere which are used to determine vertical profiles as functions of pressure of the temperature and concentrations of several trace species in the 8-100 km height range. The HIRDLS design is of LRIR (Nimbus-6), LIMS and SAMS (Nimbus-7), ISAMS and CLAES (UARS) heritage.
HIRDLS observes global distributions of temperature and trace gas concentrations of O3, H2O, CH4, N2O, HNO3, NO2, N2O5, CFC11, CFC12 ClONO2, and aerosols in the upper troposphere, stratosphere, and mesosphere plus water vapor, aerosol, and cloud tops. The swath width is 2000-3000 km (typically six profiles across swath). Complete Earth coverage (including polar night) can be obtained in 12 hours. High horizontal resolution is obtained with a commandable azimuth scan which, in conjunction with a rapid elevation scan, provides profiles up to 3,000 km apart in an across-track swath. Spatial resolution: standard profile spacing is 500 x 500 km horizontally (equivalent to 5º longitude x 5º latitude) x 1 km vertically; averaging volume for each data sample 1 km vertical x 10 km across x 300 km along line-of-sight. 51) 52)

Figure 28: Illustration of the HIRDLS instrument (image credit: Oxford University)
HIRDLS performs limb scans in the vertical at multiple azimuth angles, measuring infrared emissions in 21 channels (temperature distribution) ranging from 6.12 - 17.76 µm. Four channels measure the emission of CO2. Taking advantage of the known mixing ratio of CO2, the transmittance is calculated, and the equation of radiative transfer is inverted to determine the vertical distribution of the Planck black body function, from which the temperature is derived as a function of pressure. Winds and potential vorticity are determined from spatial variations of the height of geopotential surfaces. These are determined at upper levels by integrating the temperature profiles vertically from a known reference base. The HIRDLS instrument will improve knowledge in data-sparse regions by measuring the height variations of the reference surface with the aid of a gyro package. This level (near the base of the stratosphere) can also be integrated downward using nadir temperature soundings to improve tropospheric analyses. 53)
FOV (scan range): elevation from 22.1º to 27.3º below horizontal, azimuth: -21º (sun side) to +43º (anti-sun side). The instrument has 21 photoconductive HgCdTe detectors cooled to 65 K; each detector has a separate bandpass interference filter. Thermal control by paired Stirling cycle coolers, heaters, sun baffle, radiator panel; the thermal operating range is 20-30º C.
Parameter
|
Value
|
Parameter
|
Value
|
Spectral range
|
6-18 µm
|
Swath width
|
2000-3000 km
|
Scan range in elevation
|
22.1-27.3º below horizon
|
Pointing stability
|
30 arcsec/sec per axis
|
Scan range in azimuth
|
-21º (sun side) to +43º (anti-sun side)
|
Detector IFOV
|
1 km vertical x 10 km horizontal
|
Instrument mass
|
220 kg
|
Instrument size
|
154.5 x 113.5 x 130 cm
|
Data rate
|
65 kbit/s
|
Duty cycle
|
100%
|
Instrument power
|
220-239 W (av. to peak)
|
Table 1: Overview of some HIRDLS parameters
Status 2005: The instrument is performing correctly except for a problem with radiometric views out from the main aperture. A series of tests using the (i) the in-orbit instrument, (iii) the Engineering Model, (iii) purpose-built ground rigs, has led to the conclusion that the optical beam is obstructed between the scan mirror and the entrance aperture by what is believed to be a piece of Kapton film that became detached during the ascent to orbit. This film was intended to prevent movement of contamination, but itself moved from behind the scan mirror to in front. The lines along which that film tore can only be deduced from the in-orbit behavior.
Extensive tests have been performed on the HIRDLS instrument to understand the form of the optical blockage and how it occurred. A clear picture has emerged of the geometry, and this adds to the confidence in the approach to extracting atmospheric profiles which appears to be giving good results. All other aspects of the instrument are performing as well as or better than expected and there is every reason to expect that a long series of valuable atmospheric data will be obtained. 54) 55) 56) 57)

Figure 29: Illustration of the HIRDLS instrument and its components (image credit: UCAR, Ref. 53)

Figure 30: Internal view of the HIRDLS instrument (image credit: UCAR)
MLS (Microwave Limb Sounder):
The MLS instrument is of UARS MLS heritage; PI: J. W. Waters, NASA/JPL. The instrument measures thermal emissions from the atmospheric limb in submillimeter and millimeter wavelength spectral bands and is intended for studies of the following processes and parameters: 58) 59) 60) 61) 62) 63)
• Chemistry of the lower stratosphere and upper troposphere. Measurement of lower stratospheric temperature and concentrations of: H2O, O3, ClO, BrO, HCl, OH, HO2, HNO3, and HCN, and N2O. Measurement of upper tropospheric H2O and O3 (radiative forcing on climate change).
• Chemistry of the middle and upper stratosphere. Monitoring of ozone chemistry by measuring radicals, reservoirs, and source gases in chemical cycles which destroy ozone
• The effects of volcanoes on global change. MLS measures SO2 and other gases in volcanic plumes.
Measurements are performed continuously, at all times of day and night, altitude range from the upper troposphere to the lower thermosphere. The vertical scan is chosen to emphasize the lower stratosphere and upper troposphere. Complete latitude coverage is obtained each orbit. Pressure (from O2 lines) and height (from a gyroscope measuring small changes in the FOV direction) are measured to provide accurate vertical information for the composition measurements. 64) 65) 66)
The MLS instrument consists of three modules (Figure 32):
9) GHz module: This module contains the GHz antenna system, calibration targets, switching mirror, optical multiplexer, and 118, 190, 240, and 640 GHz radiometers
10) THz module: contains the THz scan and switching mirror, calibration target, telescope, and 2.5 THz radiometers at both polarizations. Measurement of the OH emissions near 2.5 THz (119 µm).
11) Spectrometer module: that contains spectrometers, command and data handling systems, and power distribution systems.
Measurement approach: passive limb sounder; thermal emission spectra collected by offset Cassegrain scanning antenna system; Limb scan = 0 - 120 km; spatial resolution = 3 x 300 km horizontal x 1.2 km vertical. MLS contains heterodyne radiometers in five spectral bands.
Spectral bands
|
At millimeter and submillimeter wavelengths
|
Spatial resolution
|
Measurements are performed along the sub-orbital track, and resolution varies for different parameters; 5 km cross-track x 500 km along-track x 3 km vertical are typical values
|
Instrument mass, power
|
490 kg, 550 W (peak)
|
Duty cycle
|
100%
|
Data rate
|
100 kbit/s
|
Thermal control
|
Via radiators and louvers to space as well as heaters
|
Thermal operating range
|
10-35ºC
|
FOV
|
Boresight 60-70º relative to nadir
1.5 km vertical x 3 km cross-track x 300 km along-track at the limb tangent point (IFOV at 640 GHz) |
Table 2: MLS instrument parameters

Figure 31: Schematic view of the MLS instrument (image credit: NASA)
FOV: boresight 60-70º relative to nadir; IFOV = ±2.5º (half-cone, along-track); spatial resolution: measurements are performed along the suborbital track; the resolution varies for different bands, at 640 GHz the spatial resolution is: 1.5 km vertical x 3 km cross-track x 300 km along-track at the limb tangent point; a typical resolution is: 3 km vertical x 5 km cross-track x 500 km along-track. Spectral bands at millimeter and submillimeter wavelengths. Instrument mass = 490 kg, power = 550 W; duty cycle = 100%; data rate = 100 kbit/s; thermal control via radiators and louvres to space as well as heaters; thermal operating range is 10-35ºC.
Spectral band center
|
Measurement objective
|
118 GHz
|
Primarily for temperature and pressure
|
190 GHz
|
Primarily for H2O, HNO3, and continuity with UARS MLS measurements
|
240 GHz
|
Primarily for O3 and CO
|
640 GHz
|
Primarily for N2O, HCl, ClO, HOCl, BrO, HO2, and SO2
|
2.5 THz
|
Primarily for OH
|
Table 3: MLS instrument frequency bands

Figure 32: Line drawing of the MLS instrument (image credit: NASA)

Figure 33: Signal flow block diagram of the MLS instrument (image credit: NASA)

Figure 34: The MLS GHz module antenna concept, showing Cassegrain configuration, edge tapers, and surface tolerances of the reflectors (image credit: NASA)

Figure 35: The MLS THz module optical scheme (image credit: NASA)
OMI (Ozone Monitoring Instrument):
The OMI instrument is a contribution of NIVR (Netherlands Institute for Air and Space Development) of Delft in collaboration with FMI (Finnish Meteorological Institute), Helsinki, Finland, to the EOS Aura mission. The PI is Pieternel F. Levelt of KNMI; co-PIs are: Gilbert W. Leppelmeier of FMI and Ernest Hilsenrath of NASA/GSFC. OMI was manufactured by Dutch Space/TNO-TPD in The Netherlands, in cooperation with Finnish subcontractors VTT and Patria Finavitec. 67) 68) 69) 70) 71) 72) 73) 74) 75) 76)
OMI is a nadir-viewing UV/VIS imaging spectrograph which measures the solar radiation backscattered by the Earth's atmosphere and surface over the entire wavelength range from 270 to 500 nm, with a spectral resolution of about 0.5 nm. The design is of GOME heritage, flown on ERS-2, as well as of SCIAMACHY and GOMOS heritage, flown on Envisat. The overall objective is to monitor ozone and other trace gases (continuation of the TOMS measurement series) and to monitor tropospheric pollutants worldwide. The OMI measurements are highly synergistic with the HIRDLS and MLS instruments on the Aura platform. The OMI observations provide the following capabilities and features:
• Mapping of ozone columns at 13 km x 24 km and profiles at 36 km x 48 km (continuation of TOMS and GOME ozone column data records and the ozone profile records of SBUV and GOME)
• Measurement of key air quality components: NO2, SO2, BrO, OClO, and aerosol (continuation of GOME measurements)
• Distinguish between aerosol types, such as smoke, dust, and sulfates
• Measurement of cloud pressure and coverage
• Mapping of the global distribution and trends in UV-B radiation
• A combination of processing algorithms is employed including TOMS version 7, DOAS (Differential Optical Absorption Spectroscopy), Hyperspectral BUV retrievals and forward modeling to extract the various OMI data products
• Near real-time production of ozone and other trace gases.

Figure 36: The OMI instrument (image credit: KNMI)
OMI is the first of a new generation of UV-Visible spaceborne spectrometers that use two-dimensional detectors (CCD arrays). These detectors enable OMI to daily observe the entire Earth with small ground pixel size (13x24 km2 at nadir), which makes this instrument suitable for tropospheric composition research and detection of air pollution at urban scales. OMI is a wide-angle, non-scanning and nadir-viewing instrument measuring the solar backscattered irradiance in a swath of 2600 km. The telescope has a FOV of 114º. The instrument is designed as a compact UV/VIS imaging spectrograph, using a two-dimensional CCD array for simultaneous spatial and spectral registration (hyperspectral imaging in frame-transfer mode). The instrument has two channels measuring in the spectral range of 270-500 nm.
The Earth is viewed in 1500 bands in the along-track direction providing daily global coverage. OMI employs a polarization scrambler to depolarize the incoming radiance. The radiation is then focussed by the secondary telescope mirror. A dichroic element separates the radiation into a UV and a VIS channel. The UV channel is split again into two subchannels UV1 (270-314 nm) and UV2 (306-380 nm). In the UV1 subchannel, the spatial sampling distance per pixel is a factor two larger than in the UV2 subchannel. The idea is to increase the ratio between the useful signal and the dark current signal, hence, to increase SNR in UV1. The resulting IFOV values of a pixel in the cross-track direction are 6 km for UV1 and 3 km for UV2 and VIS. The corresponding spatial resolution is twice as good as the sampling distances. Groups of 4 or 8 CCD detector pixels are binned in the cross-track direction. The basic detector exposure time is 0.4 s, corresponding to an along-track distance of 2.7 km. In OMI, five subsequent CCD images are electronically co-added, resulting in a FOV of 13 km in the along-track direction. In addition, one column (wavelength) of each CCD data is downlinked without co-adding (monitoring of clouds, ground albedo). The pixel binning and image co-adding techniques are used to increase SNR and to reduce the data rate.

Figure 37: Conceptual design of the OMI instrument (image credit: KNMI)
Instrument type
|
Pushbroom type imaging grating spectrometer
|
Two UV bands, 1 visible band
|
UV-1: 270-314 nm
UV-2: 306-380 nm VIS: 350-500 nm |
Spectral resolution (average)
|
UV1: 0.42 FWHM (Full Width Half Maximum)
UV2: 0.45 nm FWHM VIS: 0.63 nm FWHM |
Spectral sampling
|
2-3 for FWHM
|
Telescope FOV
|
114º (providing a surface swath width of 2600 km)
|
IFOV (spatial resolution)
|
1.0º (providing 12 km x 24 km; or 36 km x 48 km (depending on the product)
Two zoom modes: 13 km x 13 km (detection of urban pollution) |
Detector
|
CCD 2-D frame-transfer type with 780 x 576 (spectral x spatial) pixels
|
Instrument mass, power, data rate
|
65 kg, 66 W, 0.8 Mbit/s (average)
|
Instrument size
|
50 cm x 40 cm x 35 cm
|
Duty cycle
|
60 minutes on the daylight side of the orbit
|
Thermal control
|
Stirling cycle cooler, heaters, sun baffle, and radiator panel
|
Thermal operating range
|
20-30º C
|
Table 4: OMI instrument parameters
The CCD detector arrays are of the back-illuminated and frame-transfer type, each with 576 (rows) x 780 (columns) pixels in the image section and the same amount in the storage or readout section. The frame transfer layout allows simultaneous exposure and readout of the previous exposure. This in turn permits fair pixel readout rates (130 kHz) and good data integrity. There are two zoom modes, besides the global observation mode, for regional studies with a spatial resolution of 13 km x 13 km. In one zoom mode, the swath width is reduced to 725 km; in the other zoom mode, the spectrum is reduced to 306 - 432 nm. Cloud coverage information is retrieved with a high spatial resolution, independent of the operational mode. 77)
Instrument calibration: Daily measurements of the sun are taken with a set of reflective quartz volume diffusers (QVD) for absolute radiometric calibration. Relative radiometric calibration is performed using a WLS (White Light Source) and two LEDs per spectral (sub-) channel. The two LEDs fairly uniformly illuminate the CCD's. Spectral calibration is being performed using Fraunhofer features in the sun and nadir spectra. This is supported by a dedicated spectral correction algorithm in the level 0-1 b software. Dark signal calibration is performed at the dark side of the orbit using long-exposure time dark measurements. Straylight is always monitored at dedicated rows at the side of the images; there are also covered CCD pixels measuring dark current and, at the top and bottom of the image, exposure smear. 78) 79) 80) 81)
Observation
Mode |
Spectral Range
(nm)
|
Swath Width
|
Ground Pixel Size
(along x cross-track) |
Application
|
Global mode
|
270-310 (UV-1)
306-500 (UV-2+VIS) |
2600 km
2600 km |
13 km x 48 km
13 km x 24 km |
Global observation of all products
|
Spatial zoom-in mode
|
270-310 (UV-1)
306-500 (UV-2+VIS) |
2600 km
725 km |
13 km x 24 km
13 km x 12 km |
Regional studies of all products
|
Spatial zoom-in mode
|
306-342 (UV)
350-500 (VIS) |
2600 km
2600 km |
13 km x 12 km
13 km x 12 km |
Global observation of some products
|
Table 5: Characteristics of the main observation modes of OMI

Figure 38: The optical bench of OMI (image credit: KNMI)

Figure 39: Schematic layout of the OMI optical bench (image credit: SRON, KNMI)
Channel
|
Spectral range
Full performance range |
Average spectral resolution (FWHM)
|
Average spectral sampling distance
|
Data products
|
UV-1
|
270 - 314 nm
270 - 310 nm |
0.42 nm
|
0.32 nm
|
O3 profile
|
UV-2
|
306 - 380 nm
310 - 365 nm |
0.45 nm
|
0.15 nm
|
O3 profile, O3 column (TOMS & DOAS), BrO, OClO, SO2, HCHO, aerosol, surface UV-B, surface reflectance, cloud top pressure, cloud cover
|
VIS
|
350 - 500 nm
365 - 500 nm |
0.63 nm
|
0.21 nm
|
NO2, aerosol, OClO, surface UV-B, surface reflectance, cloud top pressure, cloud cover
|
Table 6: Performance parameters of OMI

Figure 40: Schematic of measurement principle of the OMI instrument (image credit: Dutch Space)

Figure 41: Photo of the OMI instrument (image credit: SRON, Ref. 81)
TES (Tropospheric Emission Spectrometer):
The TES instrument is of ATMOS (ATLAS), and AES (Airborne Emission Spectrometer) heritage (PI: Reinhard Beer, NASA/JPL). TES has been developed for NASA by JPL. TES is a high-resolution infrared imaging Connes-type FTS (Fourier Transform Spectrometer), with spectral coverage from 3.2 - 15.4 µm (spectral resolution of 0.03 cm-1). TES has the capability to make both limb and nadir observations. Limb mode: height resolution = 2.3 km, height coverage = 0 - 34 km. In the nadir modes, TES has a spatial resolution of 0.53 km x 5.3 km with a swath of 5.3 km x 8.5 km. TES is a pointable instrument; it can access any target within 45º of the local vertical, or produce regional transects up to 885 km in length without any gaps in coverage. TES employs both, the natural thermal emission of the surface and atmosphere, and reflected sunlight, thereby providing day and night coverage anywhere on the globe. 82) 83) 84)

Figure 42: Schematic layout of the TES optics (image credit: NASA/JPL)
Observations from TES will further understanding of long-term variations in the quantity, distribution, and mixing of minor gases in the troposphere, including sources, sinks, troposphere-stratosphere exchange, and the resulting effects on climate and the biosphere. TES will provide 3-D global maps of tropospheric ozone (primary objective) and its photochemical precursors (chemical species involved in ozone formation and destruction). Other objectives: 85) 86)
- Simultaneous measurements of NOy, CO, O3, and H2O, determination of the global distribution of OH.
- Measurements of SO2 and NOy as precursors to the strong acids H2SO4 and HNO3
- Measurements of gradients of many tropospheric species
- Determination of long-term trends in radiatively active minor constituents in the lower atmosphere.
The following key features are part of the TES instrument design:
• Back-to-back cube corner reflectors to provide the change in optical path difference
• Use of KBr (potassium bromide) material for the beam splitter-recombiner and the compensator
• Only one of two input ports for actual atmospheric measurements. The other input views an internal, grooved, clod reference target
• A diode-pumped solid-state Nd:YAG laser for interferogram sampling control
• Cassegrain telescopes for condensing and collimating wherever possible to minimize the number of transmissive elements in the system.
• A passive space-viewing radiator to maintain the interferometer and optics at 180 K.
• A two-axis gimbaled pointing mirror operating at ambient temperature to permit observation of the full field of regard (a 45º cone about nadir plus the trailing limb).
• Two independent focal plane assemblies maintained at 65 K with active pulse-tube coolers. 87)
The TES instrument operates in a step-and stare configuration when in downlooking mode. At the limb the instrument points to a constant tangent height. Thus, the footprint is smeared along the line-of-sight by about 110 km during the 16 s limb scan (this is comparable to the effective size of the footprint itself). Hence, atmospheric inhomogeneity in the atmosphere becomes an issue; it must be dealt with in data processing (usually through a simplified form of tomography).
The routine operating procedure for TES is to make continual sets of nadir and limb observations (plus calibrations) on a one-day on, one-day off cycle. During the off-days, extensive calibrations and spectral product observations are made.
Parameter
|
Specification
|
Comments
|
Spectrometer type
|
Connes-type four-port FTS (Fourier Transform Spectrometer)
|
Both limb and nadir viewing capability essential
|
Spectral sampling distance
|
Interchangeably 0.0592 cm-1downlooking and 0.0148 cm-1 at the limb
|
Unapodized
|
Optical path difference
|
Interchangeably±8.45 cm-1downlooking and ± 33.8 cm at the limb
|
Double-sided interferograms
|
Overall spectral coverage
|
650-3050 cm-1 (3.2-15.4 µm)
|
Continuous, but with multiple subranges typically 200-300 cm-1 wide
|
Individual detector array coverage
|
1A, 1900-3050 cm-1
1B, 820-150 cm-1 2A, 1100-1950 cm-1 2B, 650 -900 cm-1 |
All MCT photo voltaic (PV) detectors at 65 K.
|
Array configuration
|
1 x 16
|
All four arrays optically conjugated
|
Aperture diameter
|
5 cm
|
Unit magnification system
|
System étendue (per pixel)
|
9.45 x 10⁻⁵ cm2 sr
|
Not allowing for small central obscuration from the Cassegrain secondaries
|
Modulation index
|
>0.7; 650-3050 cm-1
|
>0.5 at 1.06 µm (control laser)
|
Spectral accuracy
|
±0.00025 cm-1
|
After correction for finite FOV, off-axis effects, Doppler shifts, etc.
|
Channeling
|
<10% peak to peak; <1% after calibration
|
All planar transmissive elements wedged
|
Spatial resolution
|
0.5 km x 0.5 km at nadir
2.3 km x 2.3 km at limb |
IFOV
IFOV |
Spatial coverage
|
5.3 km x 8.5 km at nadir
37 km x 23 km at limb | |
Pointing accuracy
|
75 µrad pitch, 750 µrad yaw, 1100 µrad roll
|
Peak-to-peak values
|
Field of regard
|
45º cone about nadir plus trailing limb
|
Also views internal calibration sources
|
Scan (integration) time
|
4 s nadir and calibration, 16 s limb
|
Constant-speed scan, 4.2 cm/s (optical path difference rate)
|
Max stare time at nadir
|
208 s
|
40 downlooking scans
|
Transect coverage
|
885 km maximum
| |
Interferogram dynamic range
|
<=16 bit
|
Plus four switchable gain steps
|
Radiometric accuracy
|
<= 1 K, 650-2500 cm-1
|
Internal, adjustable, hot blackbody plus cold space
|
Pixel-to-pixel cross talk
|
<10%
|
Includes diffraction, aberrations, carrier diffusion, etc.
|
Spectral SNR
|
As much as 600:1, 30:1 min requirement
|
Depends on spectral region and target. General goal is to be source photon shot-noise limited
|
Instrument lifetime
|
5 year on orbit
|
Plus 2 years before launch
|
Size
|
1.0 m x 1.3 m x 1.4 m
|
Earth shade stowed
|
Power
|
334 W (average, 361 W (peak)
| |
Instrument mass
|
385 kg
| |
Instrument data rate
|
4.5 Mbit/s (average),
6.2 Mbit/s (peak) |
Science only
|
Table 7: TES performance characteristics

Figure 43: Observation geometry of the TES instrument (image credit: NASA/JPL)
TES status: After launch, TES went through a lengthy outgassing procedure to minimize the ice buildup on the detectors. After seven month of operation, the translator mechanism (which moves the reflecting surfaces of the spectrometer) began to show signs of bearing wear. The TES instrument team commanded the instrument to skip the limb sounding modes in May 2005. TES is now operating only in the nadir mode. This will increase the bearing life of the translator and the life of the instrument.

Figure 44: Schematic view of TES on the Aura spacecraft (image credit: NASA/JPL)
++++++++++++++++++++++++++++++++++++++++++++++++++++++++++++++++++++++++
e- Satellite Communication on e- DIREW on look earth for solar system and galaxy
++++++++++++++++++++++++++++++++++++++++++++++++++++++++++++++++++++++++
Great Blog.
BalasHapusThanks for sharing such a good blog.
Solar wireless camera in Dubai