before discussing the touch screen let us look at the basic concept that is an electronic component called a capacitor which in its formation serves as an electric field .
Capacitors and Capacitance
Okay, these are the two nouns with two different meanings. when we remember the Static Electricity, there explained that
Capacitance: parameter ability of an object store energy in the form of an electric field.
Capacitors: objects specially designed to store energy in the form of an electric field
You also must already know the representation of objects in an electric circuit capacitance it like this :

The symbol represents the simplest form of capacitors: two parallel conductor plates separated by a dielectric material. What is a dielectric material? In short, the dielectric material is an insulator. Each dielectric material has a dielectric constant that determines how much energy can be stored in the form of an electric field.
Actually, the capacitors must not parallel plate shaped like a snack. We just try googling "capacitor", would find any lot tubular like this:

So, it was not to be shaped capacitor plate. Any object which consists of the configuration of conductor-dielectric-conductor will have a capacitance value (can store energy in the form of an electric field) so that the electrical circuit can be represented by the symbol of a capacitor as shown above. Including two tubes of different conductors of his fingers, but placed on the same axis. Continue, where we could just find a capacitor?
The main example is the touchscreen
touchscreen
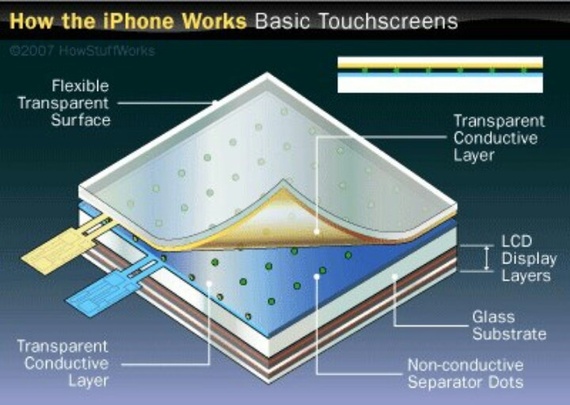
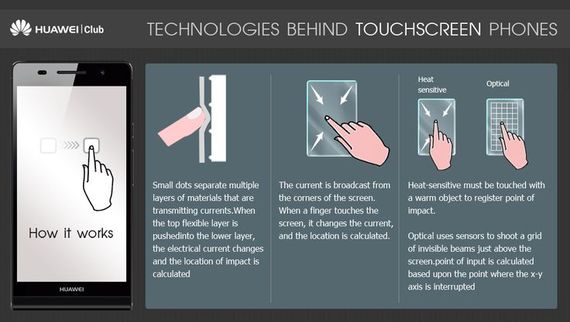
touch-screen-principles we ever thought of how to do lo smartphone or tablet can detect a touch of a finger? There are many methods touchscreen, one of which is a capacitive touchscreen. In this method, the screen acts as a dielectric. Underneath is a layer of conductors. Because the conductivity of the finger and the air is different, when lo touch, lo smartphone will detect the change in capacitance in touch lo area. The next information will be processed by the processor.
This is generally referred to capacitive sensing. Another example is the two conductors dipping into the water, lo will get a dielectric capacitor with a mixture of air and water with a specific composition corresponding water levels right. Well, from here lo can measure the depth / height of the water by looking at the change in capacitance due to changes in water level. This sensor is called a water level sensor.
For example, we want to make the water filling the fields automatically. Say a paddy height of the water should be 30 cm. Due to evaporation during the day, paddy water level will be reduced. This will cause a change in the sensor capacitance value. If already passed a certain extent, there will be an automatic water filling system that will fill the water to the fields and stop charging if the capacitance sensor is already in accordance with the initial value of the fields when the water level of 30 cm.

X . I
How Does A Touchscreen Work?
How does a touchscreen work?
Answer:

Touchscreens let us interact with computers, tablets, phones, remote controls and a host of other things with great ease but how do they work?
There are two types of touchscreens used in many devices and they work very differently.
Resistive:

(Image courtesy of PlanarTouch)
Resistive touch screens were commonly used before Apple introduced the iPhone in all touchscreen devices work by having two layers of conductive material separated by air gaps. When you apply pressure to an area of the screen a circuit completes and the device is given a coordinate where the circuit was completed. Think of it like putting a dot on a piece of graph paper. The screen reports that the dot is at the 7th box up 3 boxes in from the left. You can usually identify these screens by the flexible plastic like outer layer.
Positives of Resistive Touchscreens:
- Cheap to produce.
- Can be used with gloves, stylus or pointing devices.
- Can only detect one point of contact (one finger) at a time on most touchscreens.
- Not as resilient/durable as other touchscreens as layers must be made of flexible material.
- “Feel” of touch screen not as smooth/responsive as other technologies.

(Image courtesy of PlanarTouch)
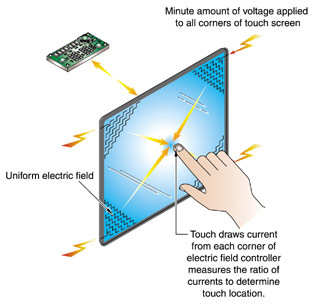
Capacitive touchscreens first introduced to the market with the Apple iPhone work by applying a very light current to all 4 corners of the screen. When a finger or other specially designed stylus touch the screen there is a circuit created and a voltage drop develops and sensors register the location of the voltage drop. You can usually identify these screens by a hard glass outer layer.
Positives of Capacitive Touchscreens:
- Very responsive to touch with natural movements.
- Able to detect multiple points of contact (fingers) to enable pinch zooming, swiping and other hand motions.
- Hard outer glass layer makes for very high quality displays with vibrant colors and high contrast ratios.
- Touch input does not work if your wearing gloves (special touch enabled gloves are availible)
- Screens often very reflective reducing outdoor useability.
- Much more expensive to produce.
X . II
The new technologies of touchscreen available for ROBO Dynamic
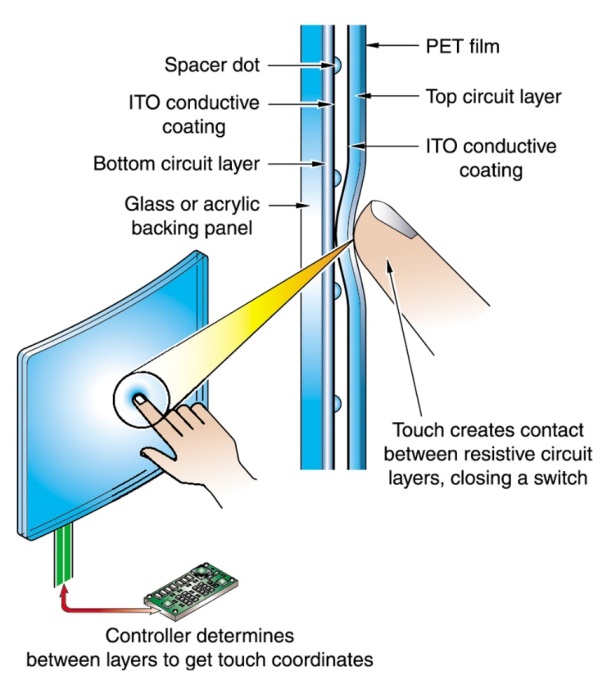
4 Wire Restistive Touch screen technology

The 4 Wire Resitive touchscreen consists of a glass layer with
a conductive coating on top and a polyester top sheet with a conductive
coating on the bottom. The conductive surfaces are held apart by
"spacer dots", usually glass beads that are silk-screened onto the
coated glass.
When a person presses on the top sheet, its conductive side comes in contact with the conductive side of the glass, effectively closing a circuit (this is called pressure sensing). The voltage at the point of contact is read from a wire connected to the top sheet.It can be touched by finger, gloved finger, leather or stylus pen.It is inherently of many advantages such as high accuracy, quick response, drift-free, stable and long durability for a life time of 1,000,000 times finger touches.
When a person presses on the top sheet, its conductive side comes in contact with the conductive side of the glass, effectively closing a circuit (this is called pressure sensing). The voltage at the point of contact is read from a wire connected to the top sheet.It can be touched by finger, gloved finger, leather or stylus pen.It is inherently of many advantages such as high accuracy, quick response, drift-free, stable and long durability for a life time of 1,000,000 times finger touches.

The 5 wrie resistive touch screen is a two-layer structure,
two materials (film or glass) with ITO are attached with a gap between
them so that the ITO layers are facing each other. Touch input will be
made as the top layer is pressed down and the two ITO layers contact.
There are insulators called spacing dots between the top and bottom ITO
layers. These spacing dots prevent unintended contacts (inputs) of the
ITO layers when not pressed.
When the top ITO film is pressed and makes contact with the bottom glass, the contacted area will be detected via electrical conduction. The notable characteristic of 5wire resistive is that only the bottom glass has detecting function. Even if the top ITO film is damaged, the detecting function will not be affected (except for the damaged area).
When the top ITO film is pressed and makes contact with the bottom glass, the contacted area will be detected via electrical conduction. The notable characteristic of 5wire resistive is that only the bottom glass has detecting function. Even if the top ITO film is damaged, the detecting function will not be affected (except for the damaged area).

Capacitive touch screen is a four-storey glass screen surface
and laminated within the glass screen is coated with a layer of ITO, the
outermost layer is a thin layer of silica glass, laminated ITO coating
as a face, four electrode leads in the four corners, inner ITO good
shielding to ensure a good working environment.
When finger touch the metal layer that is, because the body farm, users and touch-screen surface with a coupling capacitor, high frequency current, capacitance is a direct conductor, so fingers sucked away a very small amount of current from the contact point. The respectively current outflow from the touch electrode on the four corners of the screen, and flows through the four electrode current is proportional to the distance from the fingers to the four corners, controller through the accurate calculation of the four current percentage, came to the location of the touch point.
When finger touch the metal layer that is, because the body farm, users and touch-screen surface with a coupling capacitor, high frequency current, capacitance is a direct conductor, so fingers sucked away a very small amount of current from the contact point. The respectively current outflow from the touch electrode on the four corners of the screen, and flows through the four electrode current is proportional to the distance from the fingers to the four corners, controller through the accurate calculation of the four current percentage, came to the location of the touch point.

Infrared touch screen is to use a dense matrix of infra-red x,
y directions to detect and locate the user's touch. Infrared touch
screen installed in front of the monitor box outside a circuit board,
circuit board arranged on four sides of the screen infrared led and an
infrared receiver and corresponding anyway cross the infrared matrix.
When users touch the screen, fingers will be blocked anyway after the location for both infrared and therefore can judge the position of the touch points on the screen .it can detect essentially any input including a finger, gloved finger, stylus or pen.
When users touch the screen, fingers will be blocked anyway after the location for both infrared and therefore can judge the position of the touch points on the screen .it can detect essentially any input including a finger, gloved finger, stylus or pen.

SAWG touch screen technology
Surface Acoustic Wave Guide (SAW) touch screen uses ultrasonic waves
that pass over the touchscreen panel. When the panel is touched, a
portion of the wave is absorbed. This change in the ultrasonic waves
registers the position of the touch event and sends this information to
the controller for processing. Surface wave touchscreen panels can be
damaged by outside elements. Contaminants on the surface can also
interfere with the functionality of the touchscreen. Surface Acoustic
Wave (SAWG) touch screen is based on sending acoustic waves across a
clear glass panel with a series of transducers and reflectors.
When a finger touches the screen, the waves are absorbed, causing a touch event to be detected at that point. SAW touch screen technology is recommended for public information kiosks and other high traffic indoor environments.
When a finger touches the screen, the waves are absorbed, causing a touch event to be detected at that point. SAW touch screen technology is recommended for public information kiosks and other high traffic indoor environments.

Interactive touch foil is transparent touch-sensitive film,
affixed to the membrane in the back of the glass or transparent acrylic
plate, glass or acrylic panels can instantly transform size touch
screen.Only a few microns thick our thin film display screens can turn
any surface into a high definition multi media display surface. Rear
projected images, video and dynamic media content can be displayed in
any format, anywhere.
GreenTouch's touch foil can be pasted on a glass window or inside of a glass door and a simple back-projection or front-projection projector can turn the glass window or glass door into a large touch screen. This film enables projection of product information directly on the glass to attract interactivity with the potential customers. It is a perfect promotional display that not only provides interactive promotion and customer experience around the clock but also records the interactive data from potential customers..
GreenTouch's touch foil can be pasted on a glass window or inside of a glass door and a simple back-projection or front-projection projector can turn the glass window or glass door into a large touch screen. This film enables projection of product information directly on the glass to attract interactivity with the potential customers. It is a perfect promotional display that not only provides interactive promotion and customer experience around the clock but also records the interactive data from potential customers..

X . III
TOUCH SCREEN TECHNOLOGIES
Resistive Touch Screen Technology
Resistive technology is versatile and economical for applications
such as food service and retail point of sale, industrial process
control and instrumentation, portable and handheld products and
communication devices.

Resistive touch screens have a flexible top
layer and a rigid bottom layer separated by insulating dots, with the
inside surface of each layer coated with a transparent conductive
coating.
Voltage applied to the layers produces a gradient across each layer. Pressing the flexible top sheet creates electrical contact between the resistive layers, essentially closing a switch in the circuit.
Voltage applied to the layers produces a gradient across each layer. Pressing the flexible top sheet creates electrical contact between the resistive layers, essentially closing a switch in the circuit.
Advantages:
- Value solution
- Activated by any stylus
- High touch point resolution
- Low power requirements
Disadvantages:
- Reduced optical clarity
- Polyester surface can be damaged
Capacitive Touch Screen Technology
Capacitive technology offers durability, reliability, and optical
clarity. Popular applications include gaming machines, ATM
installations, kiosks, industrial equipment, and point-of-sale.

Capacitive touch screens are curved or flat
glass substrates coated with a transparent metal oxide. A voltage is
applied to the corners of the overlay creating a minute uniform electric
field. A bare finger draws current from each corner of the electric
field, creating a voltage drop that is measured to determine touch
location.
Advantages:
- Extremely durable
- Very accurate
- Good optical clarity
- Good resolution
Disadvantages:
- Requires bare finger or capacitive stylus
- Severe scratch can affect operation within the damaged area
Dispersive (DST) Touch Screen Technology
Dispersive Signal Technology (DST) consists of a
chemically-strengthened glass substrate with piezos mounted on each
corner, mated to a sophisticated, dedicated controller.
 Touch Screen Technology")
The DST Touch System determines the touch
position by pinpointing the source of "bending waves" created by finger
or stylus contact within the glass substrate. This process of
interpreting bending waves within the glass substrate helps eliminate
traditional performance issues related to on-screen contaminants and
surface damage, and provides fast, accurate touch attributes.
Advantages:
- Fast, accurate repeatable touch
- Touch operates with static objects or other touches on the screen
- Touch unaffected by surface contaminants, such as dirt, dust and grime
- Excellent light transmission provides vibrant optical characteristics with anti-glare properties
- Operation unaffected by surface damage
- Input flexibility from finger or stylus, such as pencil, credit card, fingernail, or almost any pointing stylus
- Available for display sizes 32" to 46"
Disadvantages:
- More expensive to integrate than Optical
- Only available for displays 32" and larger
Acoustic Wave Touch Screen Technology (SAW)
Because of its high optical clarity and accuracy, acoustic wave technology is typically used in kiosk applications.
")
Acoustic wave touch screens use transducers
mounted at the edge of a glass overlay to emit ultrasonic sound waves
along two sides. These waves are reflected across the surface of the
glass and received by sensors. A finger or other soft tipped stylus
absorbs some of the acoustic energy and the controller measures the
amplitude change of the wave to determine touch location.
Advantages:
- Good optical clarity
- Z-axis capability
- Durable glass front
Disadvantages:
- Requires finger or sound absorbing stylus
- Difficult to industrialize
- Signal affected by surface liquids or other contaminants
Infrared Touch Screen Technology
Infrared touch screens are primarily used for large displays, banking machines, and in military applications.

Infrared touch screens are based on light-beam
interruption technology. Instead of an overlay on the surface, a frame
surrounds the display. The frame has light sources, or light emitting
diodes (LEDs) on one side and light detectors on the opposite side,
creating an optical grid across the screen.
When an object touches the screen, the invisible light beam is interrupted, causing a drop in the signal received by the photo sensors.
When an object touches the screen, the invisible light beam is interrupted, causing a drop in the signal received by the photo sensors.
Advantages:
- 100% light transmission (not an overlay)
- Accurate
Disadvantages:
- Costly
- Low reliability (MTBF for diodes)
- Parallax problems
- Accidental activation
- Low touch resolution
- No protection for display surface
Optical Touch Screen Technology
Optical touch screen technology is ideal for large LCD and plasma displays up to 100" diagonal.

Optical touch screen technology uses two line
scanning cameras located at the corners of the screen. The cameras track
the movement of any object close to the surface by detecting the
interruption of an infra-red light source. The light is emitted in a
plane across the surface of the screen and can be either active
(infra-red LED) or passive (special reflective surfaces).
Advantages:
- 100% light transmission (not an overlay)
- Accurate
- Can be retro-fitted to any existing large format LCD or Plasma display
- Can be used with finger, gloved hand or stylus
- Requires only one calibration
- Plug and play - no software drivers
Disadvantages:
- Can be affected by direct sunlight
- Frame increases overall depth of monitor
- Cannot be fitted to plasma and LCD displays with integrated speakers
What is multi-touch?
The term "multi-touch" is now in common use to describe any touch
screen that can recognise more than one point of contact, in effect the
use of two or more fingers simultaneously.
However, there are now several different types
of multi-touch, depending on the touch technology employed. Below is an
explanation of the different types of touch available which also acts as
a guide for the terms we use for describing the touch screens we
supply.
Single Touch
Single Touch occurs when a finger or stylus creates a touch event
on the surface of a touch sensor or within a touch field so it is
detected by the touch controller and the application can determine the
X,Y coordinates of the touch event.

Single Touch occurs when a finger or stylus
creates a touch event on the surface of a touch sensor or within a touch
field so it is detected by the touch controller and the application can
determine the X,Y coordinates of the touch event.
These technologies have been integrated into millions of devices and typically do not have the ability to detect or resolve more than a single touch point at a time as part of their standard configuration.
These technologies have been integrated into millions of devices and typically do not have the ability to detect or resolve more than a single touch point at a time as part of their standard configuration.
Single Touch with Pen Input
Single Touch with Pen input functionality can range from a simple, inactive pointer or stylus to complex, active tethered pens.

Inactive pens enable the same input
characteristics as a finger, but with greater pointing accuracy, while
sophisticated, active pens can provide more control and uses for the
touch system with drawing and palm rejection capabilities, and mouse
event capabilities.
Single Touch with Gesture
Enhancements to firmware, software and hardware by many single
touch technologies have increased their touch functionality. Some touch
technologies can use advanced processing capabilities to "detect" or
recognize that a second touch event is occurring, which is called a
"gesture event".

Since single touch systems can´t resolve the
exact location of the second touch event, they rely on algorithms to
interpret or anticipate the intended gesture event input. Common
industry terms for this functionality are two-finger gestures, dual
touch, dual control, and gesture touch.
Two Touch (2-point)
Two Touch refers to a touch system that can detect and resolve two discrete, simultaneous touch events.
")
The best demonstration of Two Touch capability
is to draw two parallel lines on the screen at the same time. Two Touch
systems can also support gesturing.
Multi-touch
Multi-touch refers to a touch system´s ability to simultaneously
detect and resolve a minimum of 3+ touch points. All 3 or more touches
are detected and fully resolved resulting in a dramatically improved
touch experience.

Multi-touch is considered by many to become a
widely-used interface mainly because of the speed, efficiency and
intuitiveness of the technology.


X . IIII
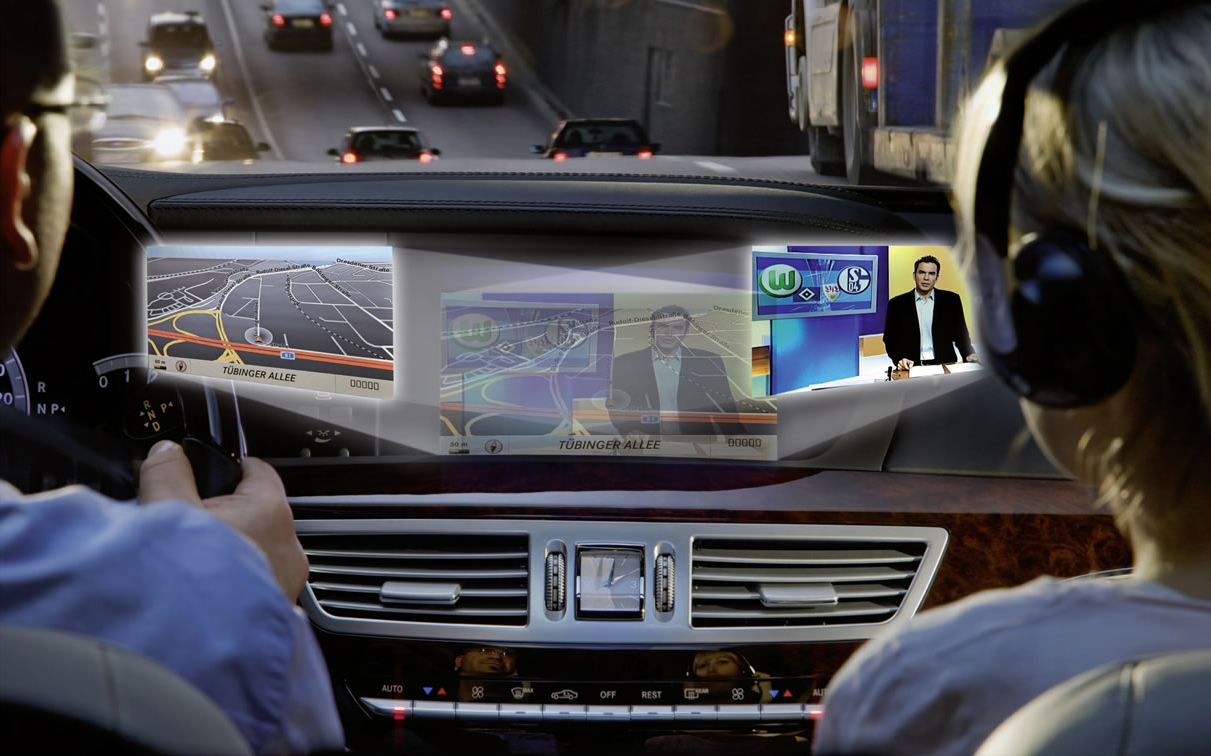
Touchscreen in cars
Infotainment displays often have touchscreen features enabling the driver to select functions via touching the display. Touchscreen technology is the direct manipulation type gesture based technology. A touchscreen is an electronic visual display capable of detecting and locating a touch over its display area. It is sensitive to the touch of a human finger, hand, pointed finger nail and passive objects like stylus. Users can simply move things on the screen, scroll them, zoom them and many more.
There are four main touchscreen technologies:
- Resistive
- Capacitive
- Surface Acoustic Wave
- Infrared
Resistive LCD touchscreen monitors rely on a touch overlay, which is composed of a flexible top layer and a rigid bottom layer separated by insulating dots, attached to a touchscreen controller. The inside surface of each of the two layers is coated with a transparent metal oxide coating (ITO) that facilitates a gradient across each layer when voltage is applied. Pressing the flexible top sheet creates electrical contact between the resistive layers, producing a switch closing in the circuit. The control electronics alternate voltage between the layers and pass the resulting X and Y touch coordinates to the touchscreen controller. The touchscreen controller data is then passed on to the computer operating system for processing.
Resistive touchscreen
Because of its versatility and cost-effectiveness, resistive touchscreen technology is the touch technology of choice for many markets and applications. Resistive touchscreens are used in food service, retail point-of-sale (POS), medical monitoring devices, industrial process control and instrumentation, portable and handheld products. Resistive touchscreen technology possesses many advantages over other alternative touchscreen technologies (acoustic wave, capacitive, infrared). Highly durable, resistive touchscreens are less susceptible to contaminants that easily infect acoustic wave touchscreens. In addition, resistive touchscreens are less sensitive to the effects of severe scratches that would incapacitate capacitive touchscreens. Drawback can be the too soft feeling when pressing it, since there is a mechanical deformation required to connect the two resistive layers to each-other.
One can use anything on a resistive touchscreen to make the touch interface work; a gloved finger, a fingernail, a stylus device – anything that creates enough pressure on the point of impact will activate the mechanism and the touch will be registered. For this reason, resistive touchscreen require slight pressure in order to register the touch, and are not always as quick to respond as capacitive touchscreens. In addition, the resistive touchscreen’s multiple layers cause the display to be less sharp, with lower contrast than we might see on capacitive screens. While most resistive screens don’t allow for multi-touch gestures such as pinch to zoom, they can register a touch by one finger when another finger is already touching a different location on the screen.
The capacitive touchscreen technology is the most popular and durable touchscreen technology used all over the world. It consists of a glass panel coated with a capacitive (conductive) material Indium Tin Oxide (ITO). The capacitive systems transmit almost 90% of light from the monitor. In case of surface-capacitive screens, only one side of the insulator is coated with a conducting layer. While the screen is operational, a uniform electrostatic field is formed over the conductive layer. Whenever, a human finger touches the screen, conduction of electric charges occurs over the uncoated layer which results in the formation of a dynamic capacitor. The controller then detects the position of touch by measuring the change in capacitance at the four corners of the screen. In the projected-capacitive touchscreen technology, the conductive ITO layer is etched to form a grid of multiple horizontal and vertical electrodes. It involves sensing along both the X and Y axis using clearly etched ITO pattern. The projective screen contains a sensor at every intersection of the row and column, thereby increasing the accuracy of the system.
Projected capacitive touchscreen
Since capacitive screens are made of one main layer, which is constantly getting thinner as technology advances, these screens are not only more sensitive and accurate, the display itself can be much sharper. Capacitive touchscreens can also make use of multi-touch gestures, but only by using several fingers at the same time. If one finger is touching one part of the screen, it won’t be able to sense another touch accurately.
Acoustic interfaces
In the following subsections the several acoustic technologies are outlined in order of the development.
Beepers
- Safety warnings
- Door is open
- Seat belt is not used
- ADAS warnings
- Comfort feedbacks
- Lights left on
- Parking assist
- Speed limit
Voice feedback
Today’s TTS systems are capable to vocalize complex texts with proper clarity. The typical fields of usage are the following:
- Navigation systems
- Telecommunication systems
- Warning messages
Voice control
Naturally Apple and Google are trying to offer their own solutions integrated into the automotive infotainment solutions, i.e. Apple CarPlay. Google has not presented a market-ready solution yet, but in January 2014 they have announced the Open Automotive Alliance, including General Motors, Honda Motor, Audi, Hyundai, and chipmaker Nvidia, that want to customize Google’s mobile operating system for vehicles.
Visual interfaces
Analogue gauge
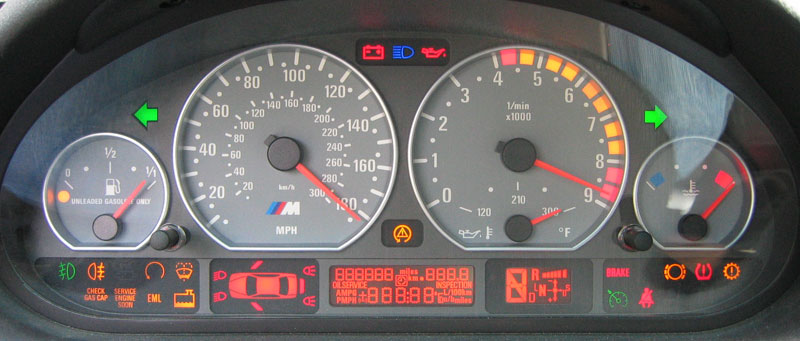
Old instrument cluster: electronic gauges, LCD, control lamps (Source: BMW)
In the newest LCD-based instrument clusters the analogue gauge type displaying will continue to be available as detailed in the following subsection.
LCD display
Liquid crystals are almost transparent substances, exhibiting the properties of both solid and liquid matter. Light passing through liquid crystals follows the alignment of the molecules that make them up – a property of solid matter. In the 1960s it was discovered that charging liquid crystals with electricity changed their molecular alignment, and consequently the way light passed through them; a property of liquids.
LCD is described as a transmissive technology because the display works by letting varying amounts of a fixed-intensity white backlight through an active filter. The red, green and blue elements of a pixel are achieved through simple filtering of the white light.
Most liquid crystals are organic compounds consisting of long rod-like molecules which, in their natural state, arrange themselves with their long axes roughly parallel. It is possible to precisely control the alignment of these molecules by flowing the liquid crystal along a finely grooved surface. The alignment of the molecules follows the grooves, so if the grooves are exactly parallel, then the alignment of the molecules also becomes exactly parallel.
In their natural state, LCD molecules are arranged in a loosely ordered fashion with their long axes parallel. However, when they come into contact with a grooved surface in a fixed direction, they line up in parallel along the grooves.
The first principle of an LCD consists of sandwiching liquid crystals between two finely grooved surfaces, where the grooves on one surface are perpendicular (at 90 degrees) to the grooves on the other. If the molecules at one surface are aligned north to south, and the molecules on the other are aligned east to west, then those in-between are forced into a twisted state of 90 degrees. Light follows the alignment of the molecules, and therefore is also twisted through 90 degrees as it passes through the liquid crystals. However, when a voltage is applied to the liquid crystal, the molecules rearrange themselves vertically, allowing light to pass through untwisted.
The second principle of an LCD relies on the properties of polarising filters and light itself. Natural light waves are orientated at random angles. A polarising filter is simply a set of incredibly fine parallel lines. These lines act like a net, blocking all light waves apart from those (coincidentally) orientated parallel to the lines. A second polarising filter with lines arranged perpendicular (at 90 degrees) to the first would therefore totally block this already polarised light. Light would only pass through the second polariser if its lines were exactly parallel with the first, or if the light itself had been twisted to match the second polariser.
Liquid crystal display operating principles
A typical twisted nematic (TN) liquid crystal display consists of two polarising filters with their lines arranged perpendicular (at 90 degrees) to each other, which, as described above, would block all light trying to pass through. But in-between these polarisers are the twisted liquid crystals. Therefore light is polarised by the first filter, twisted through 90 degrees by the liquid crystals, finally allowing it to completely pass through the second polarising filter. However, when an electrical voltage is applied across the liquid crystal, the molecules realign vertically, allowing the light to pass through untwisted but to be blocked by the second polariser. Consequently, no voltage equals light passing through, while applied voltage equals no light emerging at the other end.
Basically two LCD control technique exist: passive matrix and active matrix. The earliest laptops (until the mid-1990s) were equipped with monochrome passive-matrix LCDs, later the colour active-matrix became standard on all laptops. Passive-matrix LCDs are still used today for less demanding applications. In particular this technology is used on portable devices where less information content needs to be displayed, lowest power consumption (no backlight) and low cost are desired, and/or readability in direct sunlight is needed.
The most common type of active matrix LCDs (AMLCDs) is the Thin Film Transistor LCD (TFT LCD), which contains, besides the polarizing sheets and cells of liquid crystal, a matrix of thin-film transistors. In a TFT screen a matrix of transistors is connected to the LCD panel – one transistor for each colour (RGB) of each pixel. These transistors drive the pixels, eliminating at a stroke the problems of ghosting and slow response speed that afflict non-TFT LCDs.
The liquid crystal elements of each pixel are arranged so that in their normal state (with no voltage applied) the light coming through the passive filter is polarised so as to pass through the screen. When a voltage is applied across the liquid crystal elements they twist by up to ninety degrees in proportion to the voltage, changing their polarisation and thereby blocking the light’s path. The transistors control the degree of twist and hence the intensity of the red, green and blue elements of each pixel forming the image on the display.
TFT screens can be made much thinner than LCDs, making them lighter, and refresh rates reached the fast 5 ms value.
There are several TFT panel types exist considering the backlight and panel technology.
The LCDs does not produce light itself, thus a proper light source is needed to built-in to produce a visible image. (However low-cost monochrome LCDs are available without backlight.) Until about 2010 the backlight of large LCD panels was based on Cold Cathode Fluorescent Lamps (CCFLs). It has several disadvantages such as higher voltage and power needed, thicker panel design, no high-speed switching, faster aging. The new LED-based backlight technologies eliminated these harmful properties and took over the CCFL.
The panel technologies can be divided into three main groups:
- Twisted Nematic (TN)
- In Plane Switching (IPS)
- VA (Vertical Alignment)
The TN panel provides the shortest response time (>1ms), and it is very cost effective technology. On the other hand these panels use only 18 bit colour depth which can be increased virtually, but the colour reproduction is not perfect anyway. Another disadvantage is the poor viewing angle.
The IPS panels’ core strength are the exact colour reproduction and the wide viewing angle. The response time is higher than the TN, but it managed to the proper level (>5ms) by now. Despite the higher costs, all in all the IPS panels is the best TFT LCD panels now.
Considering the properties the VA panels can be located between TN and IPS ones. Considering the contrast ratio it is the best technology, but with higher response time (>8ms) and a medium colour reproduction.
OLED display
The basic structure of an OLED is a cathode (which injects electrons), an emissive layer and an anode (which removes electrons). Modern OLED devices use many more layers in order to make them more efficient, but the basic functionality remains the same.
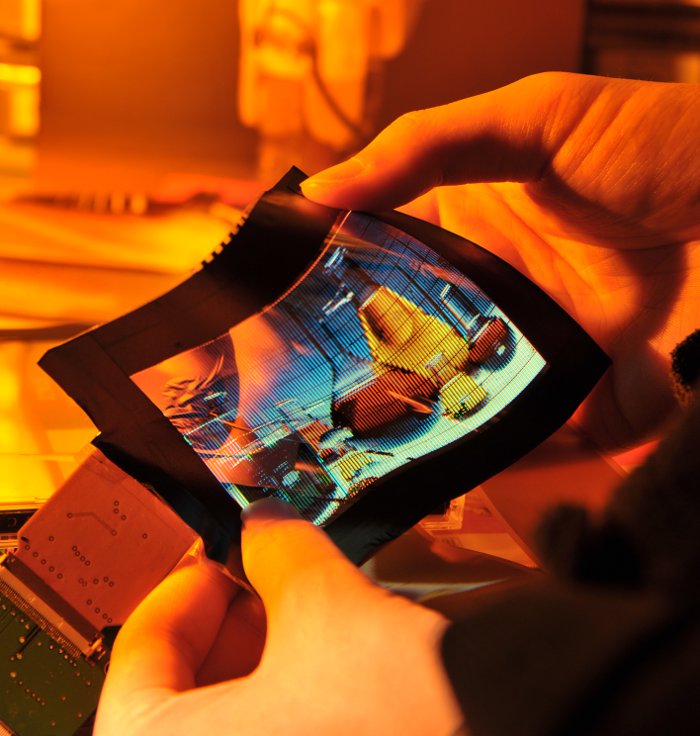
A flexible OLED display prototype
OLED displays have the following advantages over LCD displays:
- Lower power consumption
- Faster refresh rate and better contrast
- Greater brightness and fuller viewing angle
- Exciting displays (such as ultra-thin, flexible or transparent displays)
- Better durability (OLEDs are very durable and can operate in a broader temperature range)
- Lighter weight (the screen can be made very thin)
OLEDs have limited lifetime (like any display, really), that was quite a problem a few years ago. But there has been constant progress, and today this is almost a non-issue. Today OLEDs last long enough to be used in mobile devices and TVs, but the lifetime of a vehicle is significantly longer. OLEDs can also be problematic in direct sunlight, because of their emissive nature, which also could be a problem in a car. But companies are working to make it better, and newer mobile device displays are quite good in that respect.
Today OLED displays are used mainly in small (2" to 5") displays for mobile devices such as phones, cameras and MP3 players. OLED displays carry a price premium over LCDs, but offer brighter pictures and better power efficiency. Making larger OLEDs is possible, but difficult and expensive now. In 2014 several new OLED TVs has been announced and presented, which shows that the manufacturers are trying to force this promising technology, which will make the lower costs in the future.
A software configurable instrument cluster is essentially an LCD display behind the steering wheel, which can be customized to different applications (e.g. sport, luxury sedan display or special diagnostic display). There is theme selection with several colour and shape configurations and we can also decide what gauges or windows should appear. Font size altering option could help for the visually impaired. The central console display can also be temporarily ported over to the instrument cluster showing radio channel information or the current image of the parking systems status. The advantage is that the driver does not have to look aside from the instrument panel
shows a BMW instrument panel, which is based on a 10,2”, high-resolution (318 dpi) LED LCD display, with 6:1 aspect ratio.
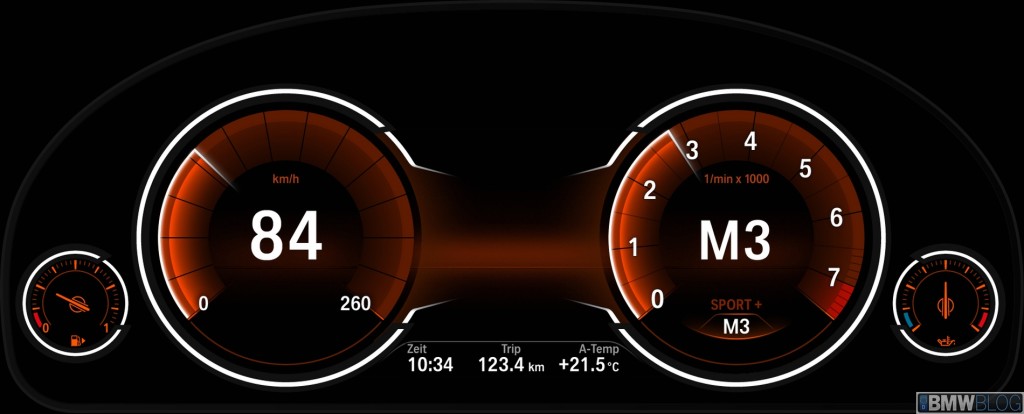
The SPORT+ and COMFORT modes of the BMW 5 Series’ instrument cluster
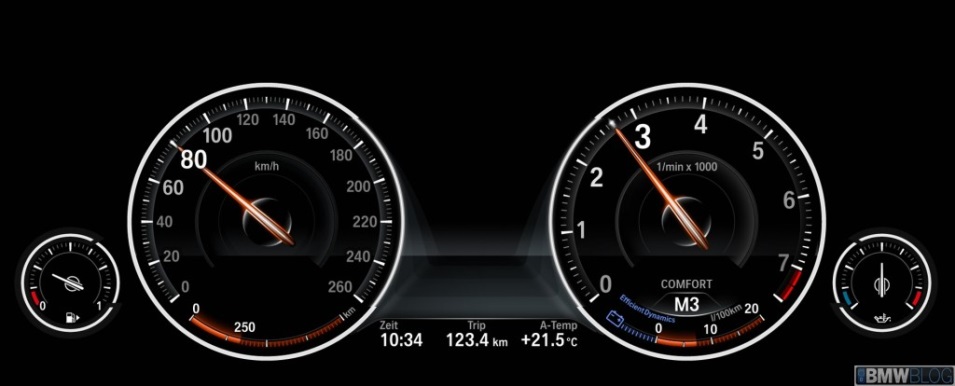
The SPORT+ and COMFORT modes of the BMW 5 Series’ instrument cluster
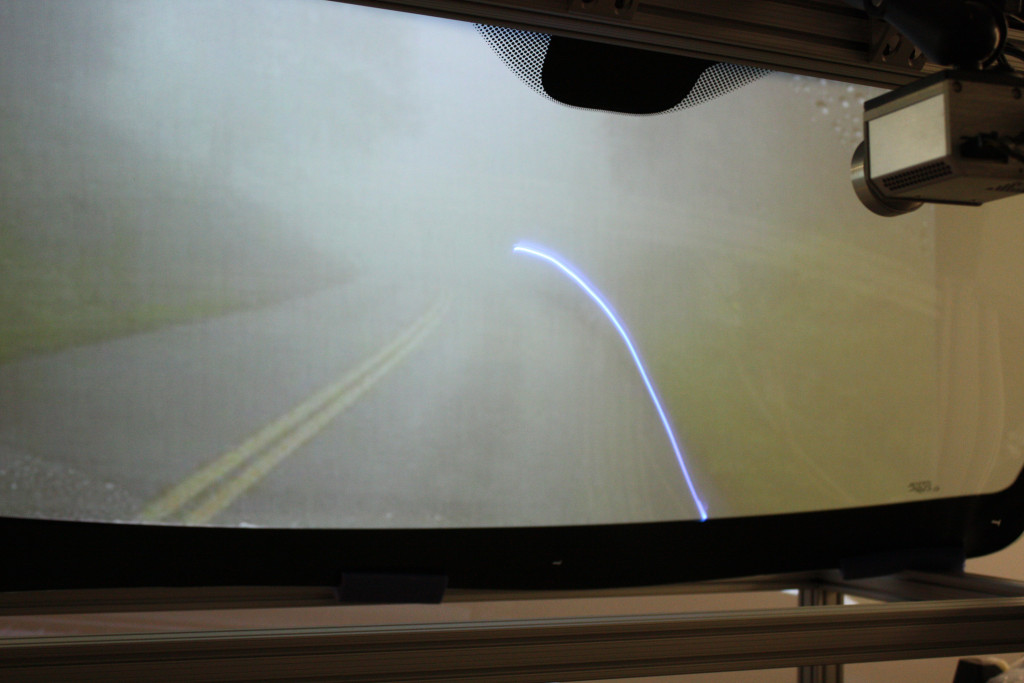
Head-Up Display (HUD)
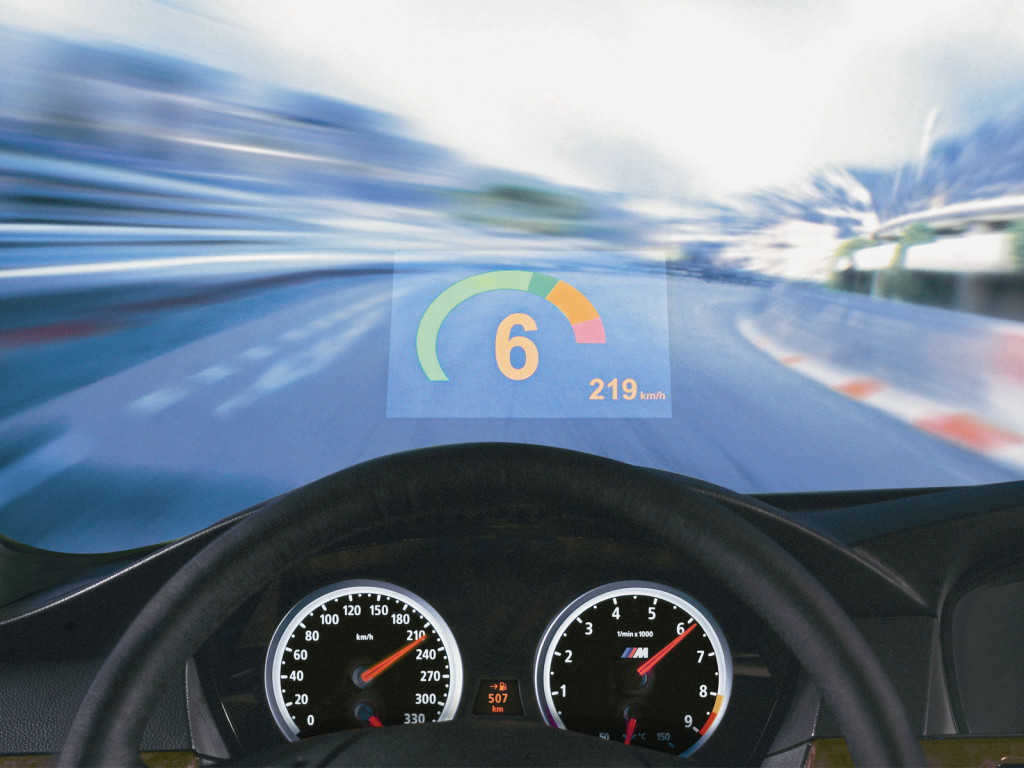
Head-Up Display on the M-Technik BMW M6 sports car. (Source. BMW)
HUD system contains a projector and a system of mirrors that beams an easy-to-read, high-contrast image onto a translucent film on the windscreen, directly in your line of sight. The image is projected in such a way that it appears to be about two metres away, above the tip of the bonnet, making it particularly comfortable to read. BMW claims that Head-Up Display halves the time it takes for eyes to shift focus from road to the instruments and back. The system’s height can be adjusted for optimal viewing. The newest HUDs provides full colour displaying which makes the car even more comfortable for the driver. More colours mean it’s easier to differentiate between general driving information like speed limits and navigation directions and urgent warning signals. Important information like “Pedestrian in the road” is now even more clear and recognisable – and this subsequently reduces the driver’s reaction time.
New technologies like the Head-Up Display (HUD) might be promising solution to reduce the time for the driver to be informed, because the information (road sign, speed limit, hazardous situation) can directly be projected in front of the driver eyes without any distraction. There are researches to use HUD technology on the full windshield that would revolutionize e.g. night vision applications providing road path and obstacle “simulation” feeling to driver .
Next generation HUD demonstration
Indicator lights (Tell-tales)
Indicator lights are regulated by automobile safety standards worldwide. In the United States, National Highway Traffic Safety Administration Federal Motor Vehicle Safety Standard 101 includes indicator lights in its specifications. In Europe and throughout most of the rest of the world, ECE Regulations specify it, more precisely “United Nations (UN) Vehicle Regulations - 1958 Agreement” .
The exact meaning and the usage of other (unregulated) symbols are manufacturer specific in the most cases.
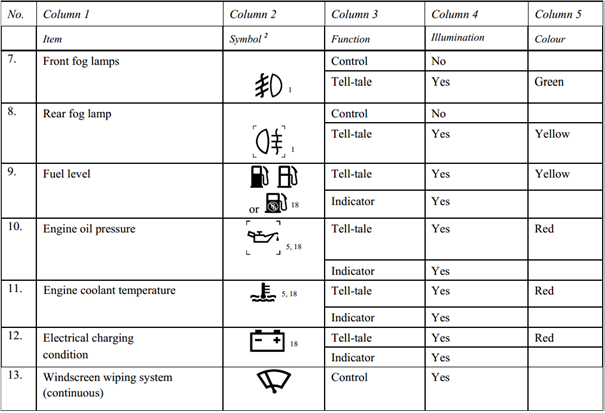
Excerpt from the ECE Regulations (Source: UNECE)
Haptic interfaces
- Pedal force and vibration for warning and efficiency functions
- Force feedback steering wheel and vibration
- Driver’s seat vibration for warning and safety functions
Driver State Assessment
The risk of momentarily falling asleep during long-distance driving in the night is quite high. During driver underload situations drivers may easily loose attention, combined with monotony the risk of falling asleep even becomes higher.
Studies show that, after just four hours of non-stop driving, drivers' reaction times can be up to 50 % slower. So the risk of an accident doubles during this time. And the risk increases more than eight-fold after just six hours of non-stop driving! This is the reason why driving time recording devices (tachograph) are mandatory all across Europe for commercial vehicles.
The driver status is calculated by special algorithms based on direct and indirect monitoring of the driver. The assessment of the driver can be grouped into the following categories:
- Drowsiness level
- Direct monitoring
- Eye movement
- Eye blinking time and frequency
- Indirect monitoring
- Driver activity
- Lane keeping
- Pedal positions
- Steering wheel intensity
- Attention/distraction level
- Driver look focuses on the street or not
- Use of control buttons
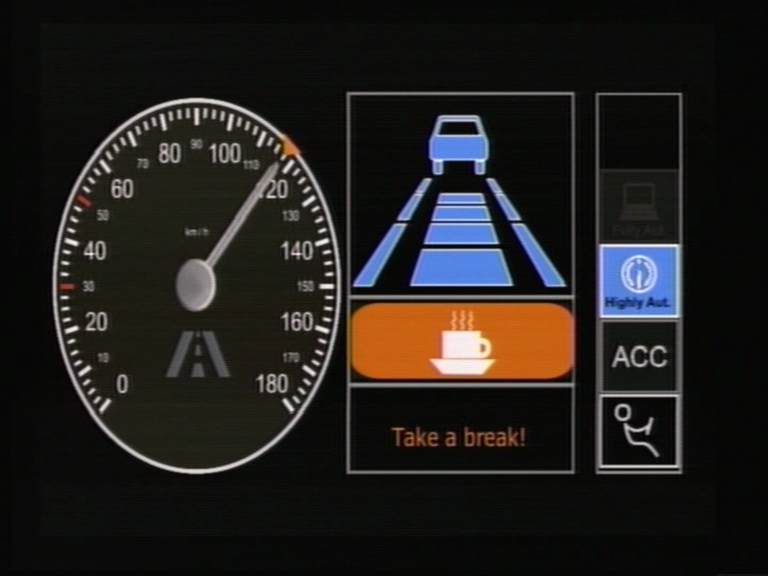
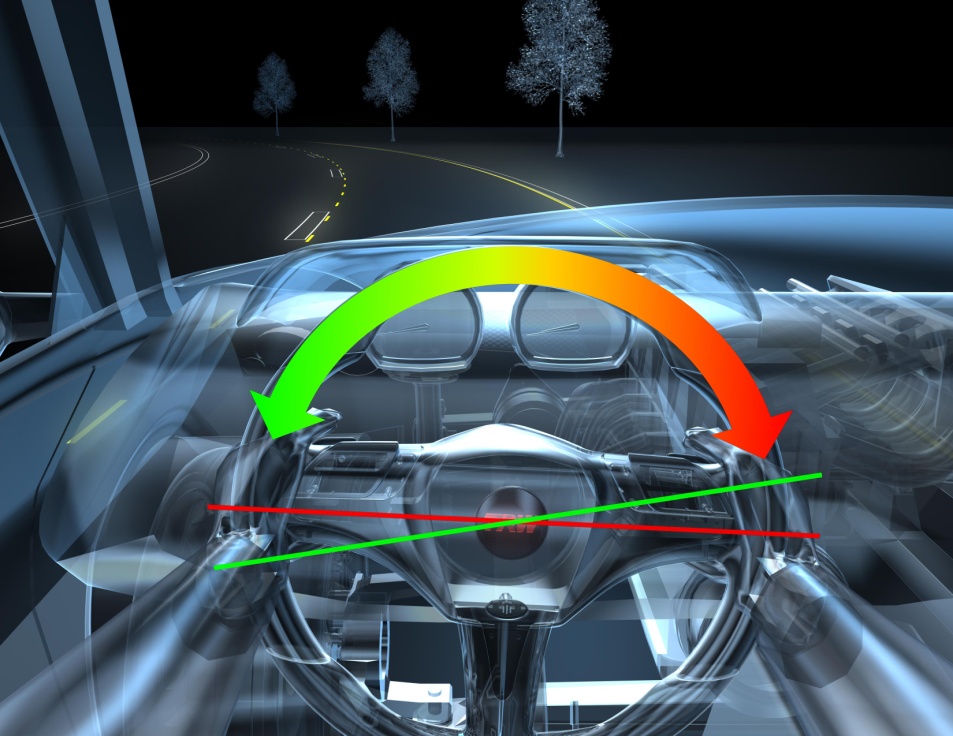
Indirect monitoring means the evaluation of the driver activity based on other sensor information (e.g. steering wheel movement, buttons/switches). The indirect algorithms calculate an individual behavioural pattern for the driver during the first few minutes of every trip. This pattern is then continuously compared with the current steering behaviour and the current driving situation, courtesy of the vehicle's electronic control unit. This process allows the system to detect typical indicators of drowsiness and warn the driver by emitting an audible signal and flashing up a warning message in the instrument cluster.
Driver distraction is a leading cause of motor-vehicle crashes. Developing driver warning systems that measure the driver status can help to reduce distraction-related crashes. For such a system, accurately recognizing driver distraction is critical. The challenge of detecting driver distraction is to develop the algorithms suitable to identify different types of distraction. Visual distraction and cognitive distraction are two major types of distraction, which can be described as “eye-off-road” and “mind-offroad”, respectively.
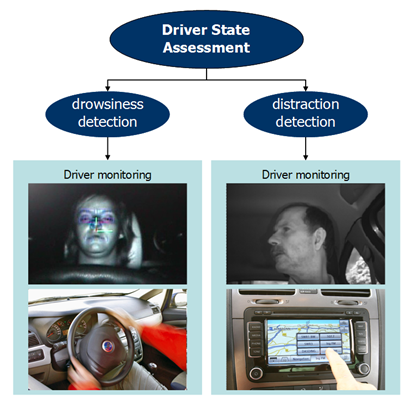
Combination of driver state assessment (Source: HAVEit)
From highly automated driving point of view it is essential to know the status of the driver, whether he is able to take back control in a dangerous situation or a minimum safety risk manoeuvre has to be carried out due to medical emergency of the driver.
Trajectory planning layer
The formulation of the vehicle trajectory, the roadpath that the vehicle travels is composed of two tasks: the trajectory planning and the trajectory execution. Trajectory planning part involves the calculation of different route possibilities with respect to the surrounding environment, contains the ranking, prioritization of the different route options based on minimizing the risk of a collision, and ends up in the selection of the optimum trajectory. The trajectory execution part contains the trajectory segmentation and the generation of the motion vector containing longitudinal and lateral control commands that will be carried out by the intelligent actuators of the execution layer .
There are already vehicle automation functions available in series production (e.g. intelligent parking assistance systems) that use trajectory planning and execution. These systems are able to park the car under predefined circumstances without any driver intervention, but there are significant limitations compared to the highly automated driving. The most important difference is that parking assistance systems operate in a static or quasi-static environment around zero velocity, while for example temporary auto-pilot drives the vehicle highly automated around 130 km/h in a continuously and rapidly changing environment.
The output of this layer is a trajectory represented in the motion vector that specifies the vehicle status (position, heading and speed) for the subsequent moments.
Longitudinal motion
Early Cruise Control (CC) functions were only able to maintain a certain engine revolution at the beginning; later systems were capable of holding a predefined speed constantly. This involved longitudinal speed control by using the engine as the only actuator. The extension of the cruise control system with a long range RADAR led to the invention of the Adaptive Cruise Control (ACC) system. ACC systems (besides longitudinal speed control) could also keep a speed dependant safe distance behind the ego vehicle. Changing between speed and distance control was automatic based on the traffic situation in front of the vehicle. ACC began to use the brake system as a second actuator. With Stop & Go function, the applicability of ACC was expanded for high-congestion, stop-and-go traffic. ACC with Stop & Go can control longitudinal speed downto zero and back to set speed permitting efficient use in traffic jams. Today’s most advanced ACC systems also take into consideration topographic information from the eHorizon like the curves and slopes ahead to calculate an optimum speed profile for the next few kilometres, for details.
In contrast to standard adaptive cruise control (ACC) that uses vehicle mounted radar sensors to detect the distance and the speed of the ego vehicle, Cooperative ACC uses V2V communication for transmitting acceleration data to reduce the time delay of onboard ranging sensors. This enables the following vehicles to adjust their speeds according to the ego vehicle resulting in better distance keeping performance. shows two comparison diagrams for ACC and cooperative ACC, indicating that V2V information exchange instead of external sensor measurement can significantly reduce of the control loop.
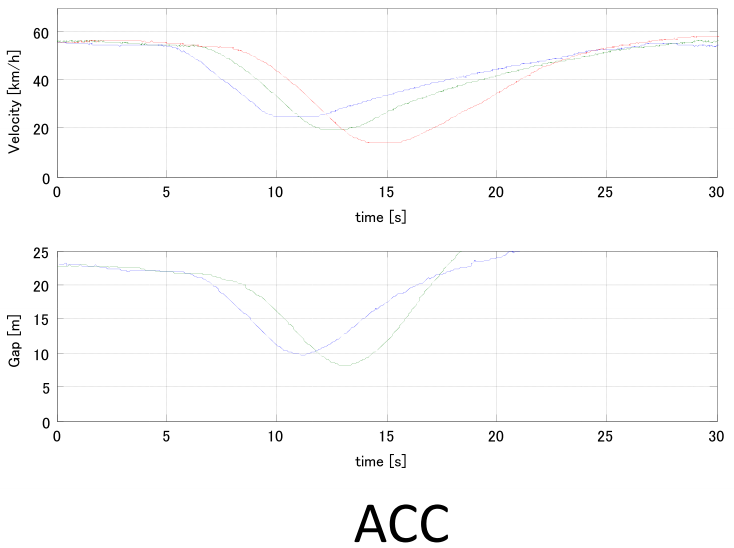
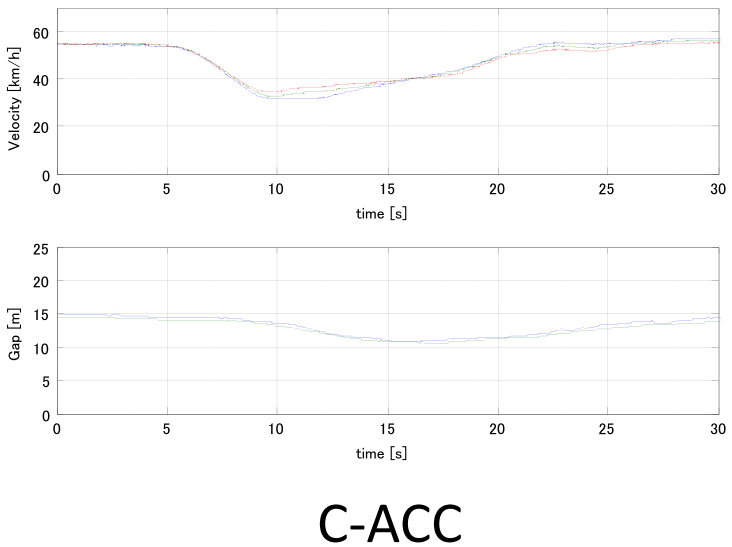
Speed and distance profile comparison of standard ACC versus Cooperative ACC systems (Source: Toyota)
5.2. Lateral motion
The objective of assisted parking systems is to improve comfort and safety of driving during parking manoeuvres. Improve comfort by being able to park the vehicle without the driver steering and improve safety by calculating precisely the parking space size and collision-free motion trajectory avoiding any human failures that may occur during a parking manoeuvre. Series production assisted parking systems appeared on the market in the beginning of the 2000s. The advances in electronic technology enabled the development of precise ultrasonic sensors for nearby distance measurement and electronic power assisted steering for driverless steering of the vehicle.
The task of trajectory planning starts with the determination of the proper parking space. By travelling low speed and continuously measuring the vehicle side distance, the parking gap can be calculated, thus proper parking space can be selected. As the first automated parking systems were capable of handling only parallel parking, the initial formulas for trajectory calculation were divided into the following segments:
- straight backward path
- full (right) steering backward path
- straight backward path
- full (left) steering backward path
- (optional straight forward path)
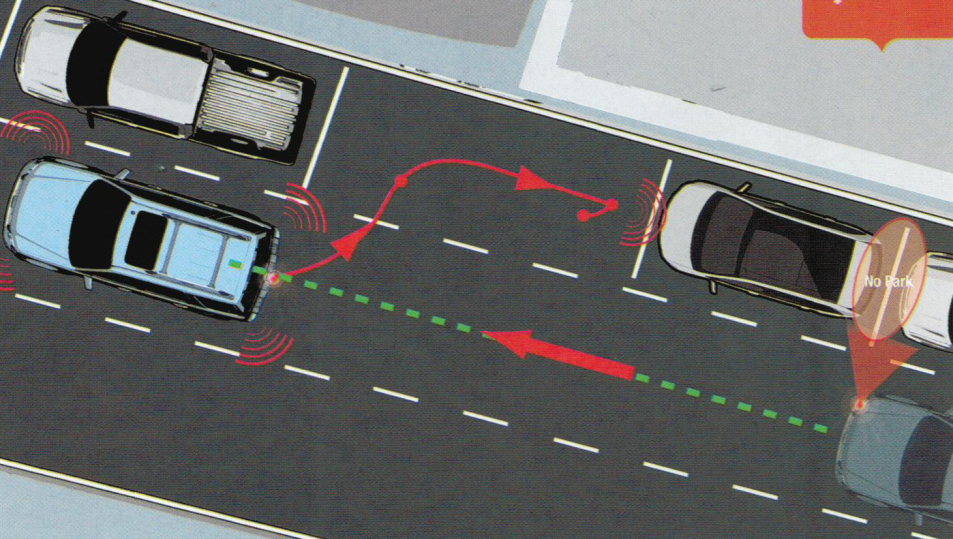
Illustration of the parallel parking trajectory segmentation (Source: Ford)
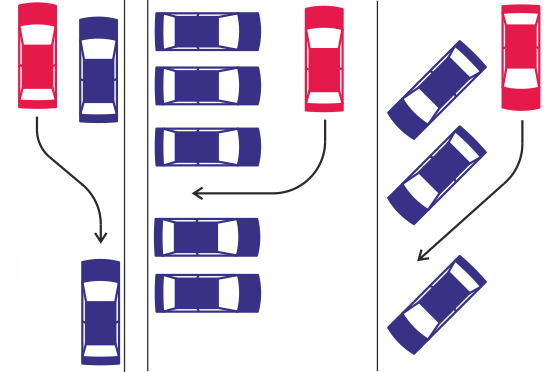
As there are different scenarios exist in everyday parking situations automated parking systems also try to assist the drivers in other situations then just parallel parking. Today’s advanced parking assist systems can also cope with perpendicular or angle parking that require a slightly different approach in lateral motion control.
One topic of recent research in highly automated driving, which is especially challenging in urban environments is fully autonomous parking control. The challenge hereby arises from the narrow corridors, tight turns and unpredictable moving obstacles as well as multiple driving direction switching. The following figure shows common parking spots in urban environments that is subject of the research and development today.
Layout of common parking scenarios for automated parking systems (Source: TU Wien)
Besides parking another good example of low speed combined longitudinal and lateral control is the traffic jam assist system. At speeds between zero and 40 or 60 km/h (depending on OEMs), the traffic jam assist system keeps pace with the traffic flow and helps to steer the car within certain constraints. It also accelerates and brakes autonomously. The system is based on the functionality of the adaptive cruise control with stop & go, extended by adding the lateral control of steering and lane guidance. The function is based on the built-in radar sensors, a wide-angle video camera and the ultrasonic sensors of the parking system. As drivers spend a great amount of their time in heavy traffic, such systems could reduce the risk of rear-end collisions and protect the drivers mentally by relieving them from stressful driving.
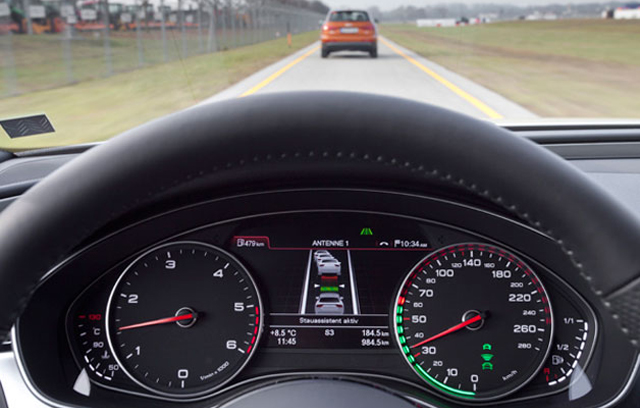
Traffic jam assistant system in action (Source: Audi)
Today’s lane keeping assist (LKA) systems are the initial signs of higher speed lateral control of vehicles. Based on camera and radar information these systems are capable of sensing if the vehicle is deviating from its lane, then they help the vehicle stay inside the lane by an automated steering and/or braking intervention. An advanced extension of LKA is lane centring assist (LCA) when the vehicle not only stays inside the lane but lateral control algorithm keeps the vehicle on a path near the centre of the lane. The primary objective of the lane keeping assist and lane centring assist functions are to warn and assist the driver and these systems are definitely not designed to substitute the driver for steering the vehicle, although on technical level they would be able to do so.
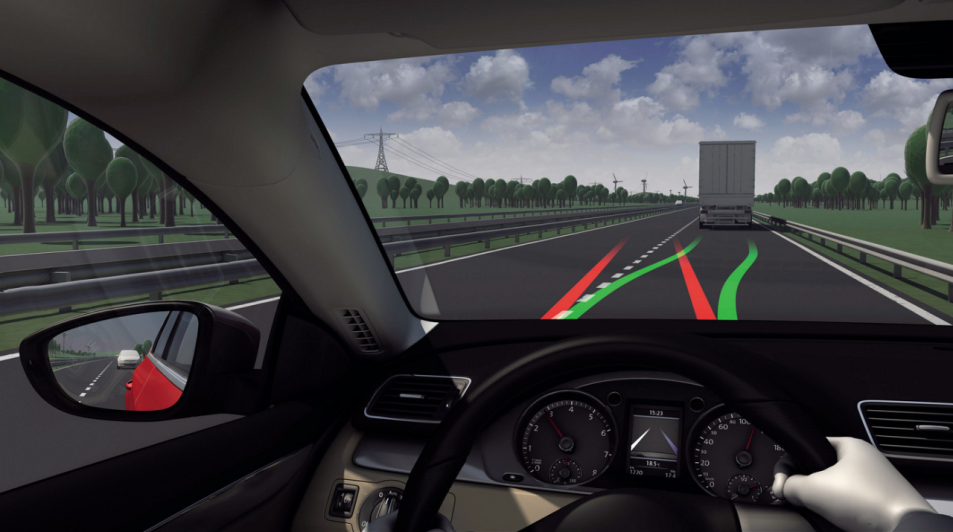
The operation of today’s Lane Keeping Assist (LKA) system (Source: Volkswagen)
Complex functions like highly automated driving with combined longitudinal and lateral control will definitely appear first on highways, since traffic is more predictable and relatively safe there (one-way traffic only, quality road with relative wide lanes, side protections, good visible lane markings, no pedestrians or cyclists, etc.). As highways are the best places to introduce hands-free driving at higher speeds, one could expect a production vehicle equipped with a temporary autopilot or in other words automated highway driving assist function as soon as the end of this decade.
Automated highway driving means the automated control of the complex driving tasks of highway driving, like driving at a safe speed selected by the driver, changing lanes or overtaking front vehicles depending on the traffic circumstances, automatically reducing speed as necessary or stopping the vehicle in the right most lane in case of an emergency. Japanese Toyota Motor have already demonstrated their advanced highway driving support system prototype in real traffic operation. The two vehicles communicate each other, keeping their lane and following the preceding vehicle to maintain a safety distance.
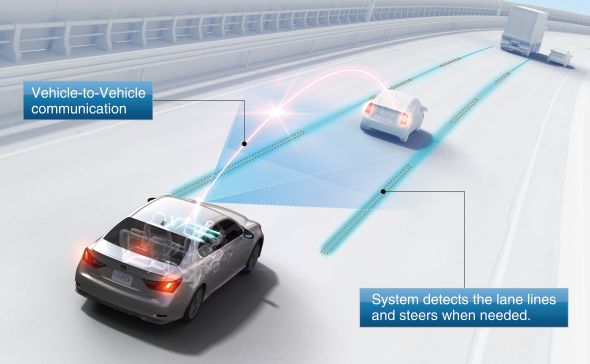
Automated Highway Driving Assist system operation (Source: Toyota)
Nissan had also announced that they are also developing their highly automated cars, which is targeted to hit the road by 2020. Equipped with laser scanners, around view monitor cameras, and advanced artificial intelligence and actuators, is not fully autonomous as its systems are designed to allow the driver to manually take over control at any time. illustrates the highly automated Leaf is being tested in a number of combined longitudinal and lateral control scenarios including automated highway exit, lane change, overtaking vehicles.
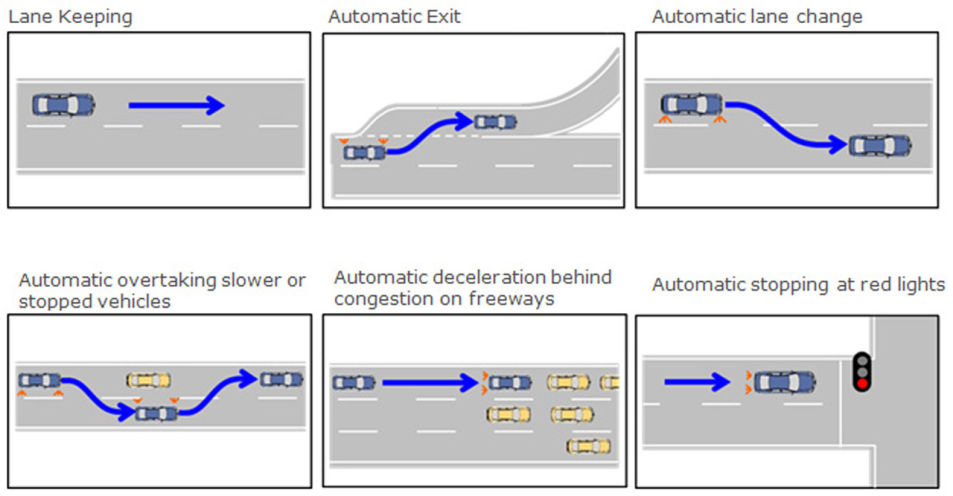
Scenarios of single or combined longitudinal and lateral control (Source: Nissan)
Automation level
- Availability of a higher automation level
- Real-time environment sensing
- Current status of vehicle dynamics
- Driver attention
- Driver request for higher automation
Auto-pilot
From the results of the multi-sensor based fusion module, the co-pilot algorithms will identify the type of situation the vehicle is in and generate driving strategy options to handle the situation. Driving strategy in this context means a set of feasible manoeuvres and trajectories to be realized by the vehicle or the driver. Driving strategy determination is based upon the analysis of the current driving situation (based on both environment sensor information and future estimation). The assessment of the danger level of the current driving situation may lead the system to select a minimum safety risk strategy or an emergency strategy for the sake of safety. The objective of the auto-pilot is to determine the optimum driving strategy for the driving context.
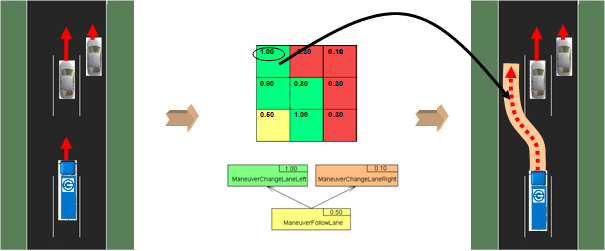
The co-pilot will provide the set of trajectories with their prioritization. Furthermore, a description of the manoeuvres which the automation intends to perform is provided by these trajectories. Every trajectory is assigned to a specific manoeuvre (e.g. slow down and stop; slow down and steer right; speed up, steer left and overtake) and vice versa. The calculations are based on the input from the perception layer. Irrespective of the automation level, the auto-pilot process is divided into two main functions :
- The definition of a driving strategy at a high level, which is described using a manoeuvre language.
- The definition of trajectory at a lower level: this function uses the previously selected manoeuvre to define a reduced possibility field of the trajectory.
The “definition of trajectory” sub-module describes and evaluates the manoeuvres proposed by the “definition of driving strategy” sub module in greater detail, choosing the best manoeuvres first, until a predefined calculation time span (which is linked to a safe reaction time) elapses.
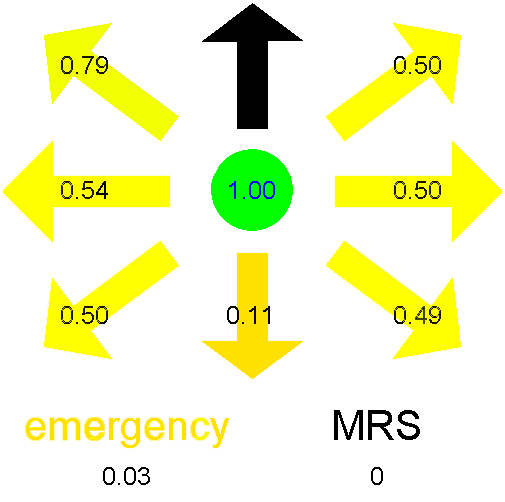
The manoeuvre grid with priority rankings (Source: HAVEit)
The manoeuvre grid contains the potential longitudinal and lateral actions that the vehicle is capable of performing in its current position. The output of this grid is a ranking of the manoeuvres. The calculation takes into consideration 9 possible combinations that comprise of the multiplication of the 3 longitudinal and 3 lateral options. In the longitudinal direction, the vehicle can accelerate, decelerate (brake) or can keep the current velocity, while in the lateral direction, the vehicle can change lane either to the left or to the right, or can stay in the current lane. There are two additional manoeuvres that have to be considered during the potential manoeuvre calculation, the minimum safety risk manoeuvre and the emergency manoeuvre with maximum braking till standstill. This gives a total of eleven manoeuvres. Each manoeuvre gets a performance indication number between zero and one.
When there are several potential vehicle trajectories available that do not contain the risk of a collision, then the next task is a more detailed evaluation to select the optimum trajectory from them. For being able to select the optimum path, the potential trajectories are ranked and optimized through qualitative and quantitative evaluation according to key performance indicators like:
- trajectory complexity
- travelling time
- driving comfort
- fuel consumption
- safety margins
According to the assumed driving situation on Figure , the best manoeuvre - taking into consideration the trajectory ratings of the grid and tree performance indicators- is overtaking and acceleration in the left lane.
. The decision of the optimum trajectory (Source: HAVEit)
Motion vector generation
Trajectory execution layer
Table of Contents
Another task of the trajectory execution layer is the execution of the calculated control commands (motion vector) and to provide feedback about the actual status. The motion vector contains the selected trajectory that has to be followed including the desired longitudinal and lateral movement of the vehicle.
The execution of the motion vector is distributed among the intelligent actuators of the vehicle. The task distribution and the harmonization of the intelligent actuators are carried out by the integrated vehicle (powertrain) controller.
Longitudinal control
Design of speed profile
The road ahead of the vehicle is divided into several sections and reference speeds are selected for them, see . The rates of the inclinations of the road and those of the speed limits are assumed to be known at the endpoints of each section. The knowledge of the road slopes is a necessary assumption for the calculation of the velocity signal. In practice the slope can be obtained in two ways: either a contour map which contains the level lines is used, or an estimation method is applied. In the former case a map used in other navigation tasks can be extended with slope information. Several methods have been proposed for slope estimation. They use cameras, laser/inertial profilometers, differential GPS or a GPS/INS systems, An estimation method based on a vehicle model and Kalman filters was proposed by .
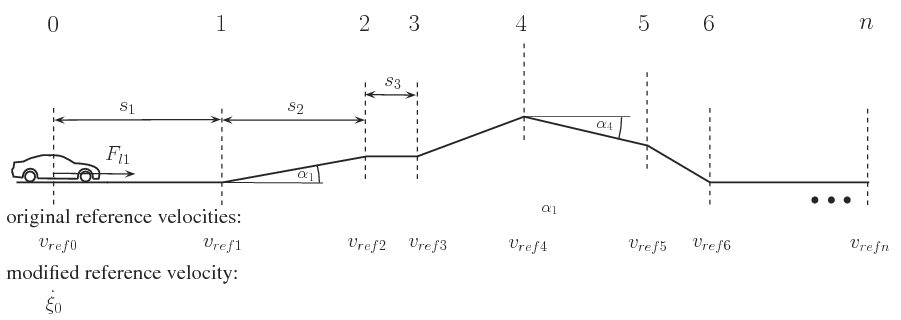
. Division of road
The simplified model of the longitudinal dynamics of the vehicle is shown in Figure . The longitudinal movement of the vehicle is influenced by the traction force
 as the control signal and disturbances
  . Several longitudinal disturbances influence the movement of the vehicle. The rolling resistance is modeled by an empiric form
  where
where  is the vertical load of the wheel,
  and
and  are empirical parameters depending on tyre and road conditions and
  is the velocity of the vehicle, see GOTOBUTTON GrindEQbibitem24 . The aerodynamic force is formulated as
  where
where  is the drag coefficient,
  is the density of air,
  is the reference area,
  is the velocity of vehicle relative to the air. In case of a lull
  , which is assumed in the paper. The longitudinal component of the weighting force is
  , where m is the mass of the vehicle and
  is the angle of the slope. The acceleration of the vehicle is the following:
  , where
  is the mass of the vehicle,
  is the position of the vehicle, and
  are the traction force and the disturbance force (
 ), respectively.
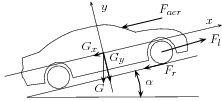
Simplified vehicle model
Although between the points may be acceleration and declaration an average speed is used. Thus, the rate of accelerations of the vehicle is considered to be constant between these points. In this case the movement of the vehicle using simple kinematic equations is:
 , where
  is the velocity of vehicle at the initial point,
  is the velocity of vehicle at the first point and
  is the distance between these points. Thus the velocity of the first section point is the following:
  . The velocity of the first section point
  is defined as the reference velocity
  . This relationship also applies to the next road section:
  . It is important to emphasize that the longitudinal force
  is known only the first section. Moreover, the longitudinal forces
  are not known during the traveling in the first section. Therefore at
the calculation of the control force it is assumed that additional
longitudinal forces will not act on the vehicle, i.e., the longitudinal
forces
are not known during the traveling in the first section. Therefore at
the calculation of the control force it is assumed that additional
longitudinal forces will not act on the vehicle, i.e., the longitudinal
forces  will not affect the next sections. At the same time the disturbances
from road slope are known ahead. Similarly, the velocity of the vehicle
can be formalized in the next
will not affect the next sections. At the same time the disturbances
from road slope are known ahead. Similarly, the velocity of the vehicle
can be formalized in the next  section points. Using this principle a velocity-chain, which contains
the required velocities along the way of the vehicle, is constructed. At
the calculation of the control force it is assumed that additional
longitudinal forces
section points. Using this principle a velocity-chain, which contains
the required velocities along the way of the vehicle, is constructed. At
the calculation of the control force it is assumed that additional
longitudinal forces  will not affect the next sections. The velocities of vehicle are
described at each section point of the road by using similar expressions
to GOTOBUTTON GrindEQequation22 . The velocity of the
will not affect the next sections. The velocities of vehicle are
described at each section point of the road by using similar expressions
to GOTOBUTTON GrindEQequation22 . The velocity of the  section point is the following:
  .
It is also an important goal to track the momentary value of the
velocity. It can also be considered in the following equation:
.
It is also an important goal to track the momentary value of the
velocity. It can also be considered in the following equation: 
The
 disturbance force can be divided in two parts: the first part is the force resistance from road slope
  , while the second part
  contains all of the other resistances such as rolling resistance, aerodynamic forces etc. We assume that
  is known while
  is unknown.
  depends on the mass of the vehicle and the angle of the slope
  . When the control force
  is calculated, only
  influences the vehicle of all of the unmeasured disturbances. In the control design the effects of the unmeasured disturbances
  are ignored. The consequence of this assumption is that the model does
not contain all the information about the road disturbances, therefore
it is necessary to design a robust speed controller. This controller can
ignore the undesirable effects. Consequently, the equations of the
vehicle at the section points are calculated in the following way:
are ignored. The consequence of this assumption is that the model does
not contain all the information about the road disturbances, therefore
it is necessary to design a robust speed controller. This controller can
ignore the undesirable effects. Consequently, the equations of the
vehicle at the section points are calculated in the following way: | (1) |
 | (2) |
 | (3) |

 | (4) |
 | (5) |
In the following step weights
 are applied to reference speeds. An additional weight
  is applied to the momentary speed. An additional weight
  is applied to the leader speed. While the weights
  represent the rate of the road conditions, weight
  has an essential role: it determines the tracking requirement of the current reference velocity
  . By increasing
  the momentary velocity becomes more important while road conditions become less important. Similarly, by increasing
  the road conditions and the momentary velocity become negligible. The weights should sum up to one, i.e.
  .
.Weights have an important role in control design. By making an appropriate selection of the weights the importance of the road condition is taken into consideration. For example when
 and
and  the control exercise is simplified to a cruise control problem without
any road conditions. When equivalent weights are used the road
conditions are considered with the same importance, i.e.,
the control exercise is simplified to a cruise control problem without
any road conditions. When equivalent weights are used the road
conditions are considered with the same importance, i.e.,  and
and  . When
  and
and  only the tracking of the preceding vehicle is carried out. The optimal
determination of the weights has an important role, i.e., to achieve a
balance between the current velocity and the effect of the road slope.
Consequently, a balance between the velocity and the economy parameters
of the vehicle is formalized.
only the tracking of the preceding vehicle is carried out. The optimal
determination of the weights has an important role, i.e., to achieve a
balance between the current velocity and the effect of the road slope.
Consequently, a balance between the velocity and the economy parameters
of the vehicle is formalized.By summarizing the above equations the following formula is yielded:
 | (6) |
 depends on the road slopes, the reference velocities and the weights
 | (7) |
 where
where  . Equation (6) is rearranged:
 | (8) |
 is calculated based on the designed
  . Consequently, the road conditions can be considered by speed tracking. The momentary velocity of vehicle
  should be equal to parameter
  , which contains the road information. The calculation of
  requires the measurement of the longitudinal acceleration
  .
.6.1.2. Optimization of the vehicle cruise control
 depends only on the weights in the following way:
  | (9) |
 depends on the weight
  , therefore
  depends on the weights
  and
and  . The longitudinal control force must be minimized, i.e.,
  . Instead, in practice the
  optimization is used because of the simpler numerical computation.
Simultaneously, the difference between momentary velocity and modified
velocity must be minimized, i.e.,
optimization is used because of the simpler numerical computation.
Simultaneously, the difference between momentary velocity and modified
velocity must be minimized, i.e., 
The two optimization criteria lead to different optimal solutions. In the first criterion the road inclinations and speed limits are taken into consideration by using appropriately chosen weights
 . At the same time the second criterion is optimal if the information is ignored. In the latter case the weights are noted by
  .
The first criterion is met by the transformation of the quadratic form
into the linear programming using the simplex algorithm. It leads to the
following form:
.
The first criterion is met by the transformation of the quadratic form
into the linear programming using the simplex algorithm. It leads to the
following form:  with the following constrains
  and
and  .
This task is nonlinear because of the weights. The optimization task is
solved by a linear programming method, such as the simplex algorithm.
.
This task is nonlinear because of the weights. The optimization task is
solved by a linear programming method, such as the simplex algorithm.The second criterion must also be taken into consideration. The optimal solution can be determined in a relatively easy way since the vehicle tracks the predefined velocity if the road conditions are not considered. Consequently, the optimal solution is achieved by selecting the weights in the following way:
 and
and  .
.In the proposed method two further performance weights, i.e.,
 and
and  , are introduced. The performance weight
  (
( ) is related to the importance of the minimization of the longitudinal control force
  while the performance weight
  is related to the minimization of
  . There is a constraint according to the performance weights
  .
Thus the performance weights, which guarantee balance between
optimizations tasks, are calculated in the following expressions:
.
Thus the performance weights, which guarantee balance between
optimizations tasks, are calculated in the following expressions: | (10) |
 , i=1,n(11)
Based on the calculated performance weights the speed can be predicted.
The tracking of the preceding vehicle is necessary to avoid a collision, therefore
 is not reduced. If the preceding vehicle accelerates, the tracking
vehicle must accelerate as well. As the velocity increases so does the
braking distance, therefore the following vehicle strictly tracks the
velocity of the preceding vehicle. On the other hand it is necessary to
prevent the velocity of the vehicle from increasing above the official
speed limit. Therefore the tracked velocity of the preceding vehicle is
limited by the maximum speed. If the preceding vehicle accelerates and
exceeds the speed limit the following vehicle may fall behind.
is not reduced. If the preceding vehicle accelerates, the tracking
vehicle must accelerate as well. As the velocity increases so does the
braking distance, therefore the following vehicle strictly tracks the
velocity of the preceding vehicle. On the other hand it is necessary to
prevent the velocity of the vehicle from increasing above the official
speed limit. Therefore the tracked velocity of the preceding vehicle is
limited by the maximum speed. If the preceding vehicle accelerates and
exceeds the speed limit the following vehicle may fall behind.Remark 3.1 Look-ahead control considering efficiency and safe cornering
The maximum cornering velocity for each section can be calculated in advance knowing the designed path of the vehicle. If the speed limit
 at section point
  exceeds the safe cornering velocity then the speed limit
  is substituted with the smallest value concerning skidding or rollover, i.e.,
  | (12) |
Implementation of the velocity design
 )
is designed. The role of the high-level controller is to calculate this
required longitudinal force. In third step the real physical inputs of
the system, such as the throttle, the gear position and the brake
pressure are generated by the low-level controller.
)
is designed. The role of the high-level controller is to calculate this
required longitudinal force. In third step the real physical inputs of
the system, such as the throttle, the gear position and the brake
pressure are generated by the low-level controller. 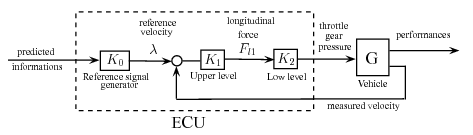
Implementation of the controlled system
In the proposed method the steps are separated from each other. The reference velocity signal generator can be added to the upper-lower Adaptive Cruise Control (ACC) system. It is possible to design a reference signal generator unit almost individually, and to attach it to the ACC system. Thus the reference signal unit can be designed and produced independently from automobile suppliers, only a few vehicle data are needed. The independent implementation possibility is an important advantage in practice. The high-level controller calculates positive and negative forces as well, therefore the driving and braking systems are also actuated. Figure shows the architecture of the low-level controller.
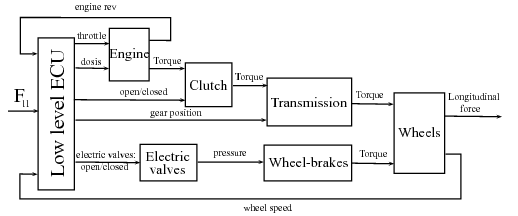
Architecture of the low-level controller
The engine is controlled by the throttle, which could be a butterfly gate or a quantity of injected fuel. The engine-management system and the fuel-injection system have their own controllers, thus in the realization of the low-level controller only the torque-rev-load characteristics of the engine are necessary. In this case the rev of the engine is measured, the required torque is computed from the longitudinal force of the high-level controller, thus the throttle is determined by an interpolation step using a look-up table. The position of the automatic transmission is determined by logic functions, thus it depends on the fuel consumption and the maximum rev of the engine. The pressures on the cylinders of the wheels increase during braking. At normal traveling the ABS actuation is not necessary, in case of an emergency the optimal driving is overwritten by the safety requirements. The necessary braking pressure for the required braking force is computed from the ratios of the hydraulic/pneumatic parts.
In the simulation example a transportational route with real data is analyzed. The terrain characteristics and geographical information are those of the M1 Hungarian highway between Tatabánya and Budapest in a
 -
- -long section. In the simulation a typical F-Class truck travels along the
  route. The mass of the 6--gear truck is
  and its engine power is
  (
( ). The regulated maximal velocity is
  , but the road section contains other speed limits (e.g.
  or
or  ),
and the road section also contains hilly parts. Thus, it is an
acceptable route for the analysis of road conditions, i.e., inclinations
and speed limits. Publicly accessible up-to-date
geographical/navigational databases and visualisation programs, such as
Google Earth and Google Maps, are used for the experiment.
),
and the road section also contains hilly parts. Thus, it is an
acceptable route for the analysis of road conditions, i.e., inclinations
and speed limits. Publicly accessible up-to-date
geographical/navigational databases and visualisation programs, such as
Google Earth and Google Maps, are used for the experiment.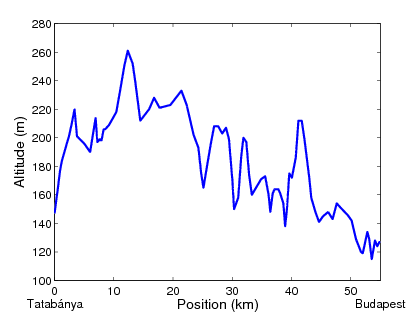 | 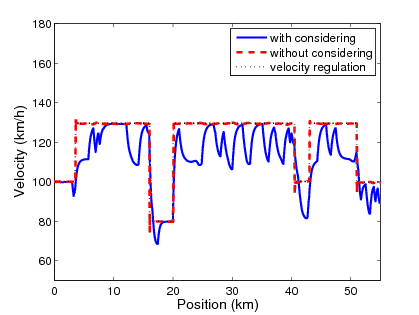 |
 |  |
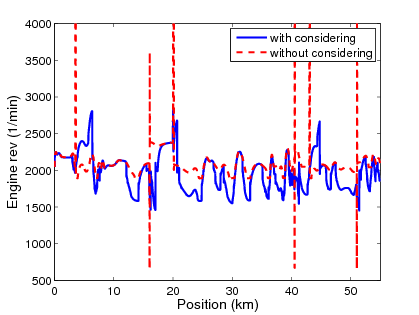 |  |
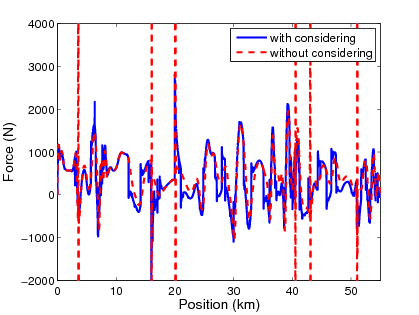
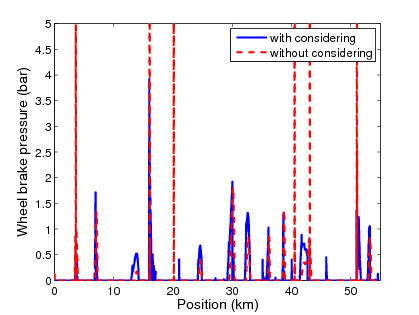
In this example two different controllers are compared. The first is the proposed controller, which considers the road conditions such as inclinations and speed limits and is illustrated by solid line in the figures, while the second controller is a conventional ACC system, which ignores this information and is illustrated by dashed line. Figure shows the time responses of the simulation.
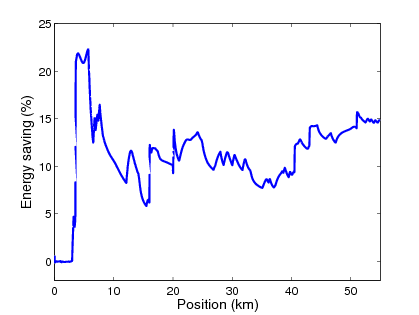
Figure (a) shows that the motorway contains several uphill and downhill sections. Figure (b) shows the velocity of the vehicle with speed limits in both cases. The conventional ACC system tracks the predefined speed limits as accurately as possible and the tracking error is minimal. In the proposed method the speed is determined by the speed limits and simultaneously it takes the road inclinations into consideration according to the optimal requirement. Figure (c) shows the required longitudinal force. The high-precision tracking of the predefined velocities in the conventional ACC system often requires extremely high forces with abrupt changes in the signals. As a result of the road conditions less energy is required during the journey in the proposed control method, see Figure (f). The proposed method requires smaller energy (
 ) than the conventional method (
 ), and the energy saving is
  , which is
  . The fuel consumption can also be calculated by using the following approximation:
  where
where  is the efficiency of the driveline system,
  is the heat of combustion and
  is the density of petrol. The fuel consumption of the conventional system is
  while that of the proposed method is
  , which results in
  reduction in fuel consumption in the analyzed
  length section.
 Remark 3.2 Speed control based on the preceding vehicle
In addition to the consideration of road conditions it is also important to consider the traffic environment. It means that the preceding vehicle must be considered in the reference speed design because of the risk of collision. Thus, all of the kinetic energy of the vehicle is dissipated by friction. This estimation of the safe stopping distance may be conservative in a normal traffic situation, where the preceding vehicle also brakes, therefore the distance between the vehicles may be reduced. In this paper the safe stopping distance between the vehicles is determined according to the 91/422/EEC, 71/320/EEC UN and EU directives (in case of
 vehicle category, the velocity in
  ):
):  .
It is also necessary to consider that without the preceding vehicle the
consideration of safe stopping distance is neither possible nor
necessary. The consideration of the preceding vehicle is determined by
.
It is also necessary to consider that without the preceding vehicle the
consideration of safe stopping distance is neither possible nor
necessary. The consideration of the preceding vehicle is determined by  .
The following example analyses the incidence when another vehicle
overtakes the vehicle with an adaptive control proposed in the paper or
the vehicle catches up with a preceding vehicle.
.
The following example analyses the incidence when another vehicle
overtakes the vehicle with an adaptive control proposed in the paper or
the vehicle catches up with a preceding vehicle.In the simulation example, the preceding vehicle is slower, however, in the second part its velocity is higher than that of the follower vehicle. Furthermore, in the example the preceding vehicle also exceeds the official speed limit (
 ). Figure (a) and Figure (b)
show that in the first part of the simulation the follower vehicle
approaches the preceding vehicle taking the braking distance into
consideration, while in the second part the follower vehicle avoids
exceeding the speed limit and falls behind. This velocity control is
achieved by using the value of
). Figure (a) and Figure (b)
show that in the first part of the simulation the follower vehicle
approaches the preceding vehicle taking the braking distance into
consideration, while in the second part the follower vehicle avoids
exceeding the speed limit and falls behind. This velocity control is
achieved by using the value of  as it is shown in Figure 92(d).
In the first part of the simulation the weight is increased by the risk
incident while in the second part it is reduced by the increasing
distance. The solution requires radar information, which is available in
a conventional adaptive cruise control vehicle. This simulation example
shows that the designed control system is able adapt to external
circumstances.
as it is shown in Figure 92(d).
In the first part of the simulation the weight is increased by the risk
incident while in the second part it is reduced by the increasing
distance. The solution requires radar information, which is available in
a conventional adaptive cruise control vehicle. This simulation example
shows that the designed control system is able adapt to external
circumstances.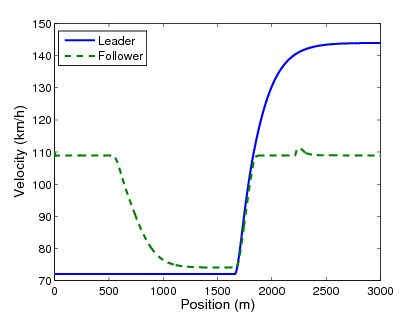 | 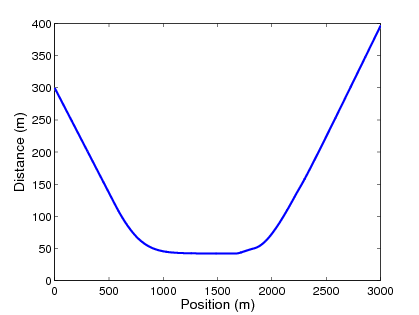 |
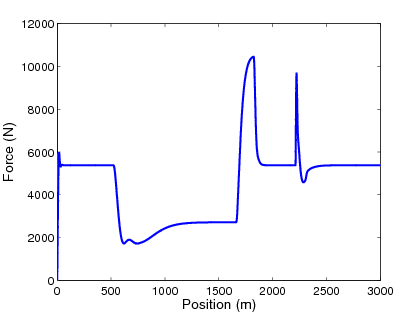 | 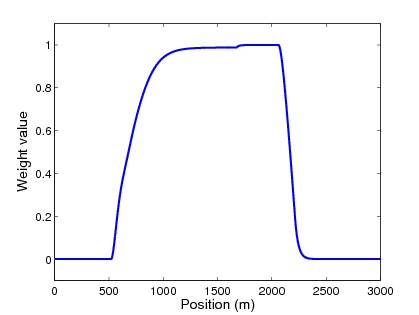 |
6.1.4. Extension of the method to a platoon
 . Moreover, speeds of the vehicles are not independent of each other, because the speed of the leader
  influences the speed of every member of platoon
  . The goal is to find an optimal reference speed for the leader
  .
.It is important to note that there is an interaction between the speeds of the vehicles in a platoon. If a preceding vehicle changes its speed, the follower vehicles will modify their speeds and track the motion of the preceding vehicle within a short time. The members of the platoon are not independent of the leader, therefore it is necessary to formulate the relationship between the speed of the
 platoon member
  and the leader and the preceding vehicles. It is formulated with a transfer function with its input and output. The output
  contains the information, i.e., the position, speed and acceleration of
the vehicle, which is sent to the follower vehicles. The input
contains the information, i.e., the position, speed and acceleration of
the vehicle, which is sent to the follower vehicles. The input  contains the position, speed, the acceleration of the preceding vehicle and the leader. The transfer function between
  and
and  is
is  with the controller of the
  vehicle
  and its longitudinal dynamics
  . Similarly, the effect of the leader and the preceding vehicles on the
  platoon member is formulated:
  , where
  , which finally leads to
  . Consequently, the speed of the
  vehicle is determined by the next formula:
  . The value of
  is used for the computation of the optimal reference speed of the platoon
  .
.Finally the required reference speed of the leader vehicle
 is designed. The aim of the design is that the generated speeds of all the vehicles
  are as close to as their modified reference speed
  as possible:
 | (13) |
 vehicle is formulated as
  , the following optimization form is used:
  , where
  . It can be stated that in GOTOBUTTON GrindEQequation48 the only unknown variable is
  . The optimization leads to the following equation:
  The solution of the optimization problem can be achieved. The deduction of the optimization of
  is as follows:
  | (14) |
 .
.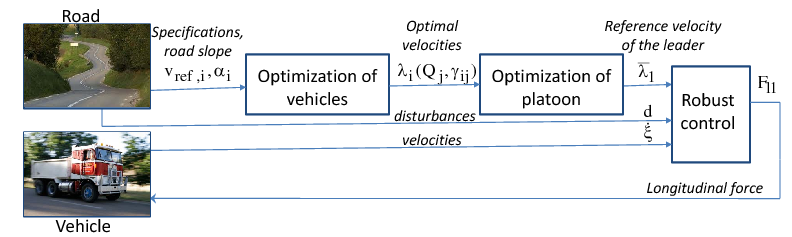
Figure 6.5. Architecture of the control system
Lateral control
Design of trajectory
 is assumed to be small enough for the lateral force to point along the
path radius, and the longitudinal acceleration is also small enough not
to degrade the lateral friction of the vehicle considerably.
is assumed to be small enough for the lateral force to point along the
path radius, and the longitudinal acceleration is also small enough not
to degrade the lateral friction of the vehicle considerably.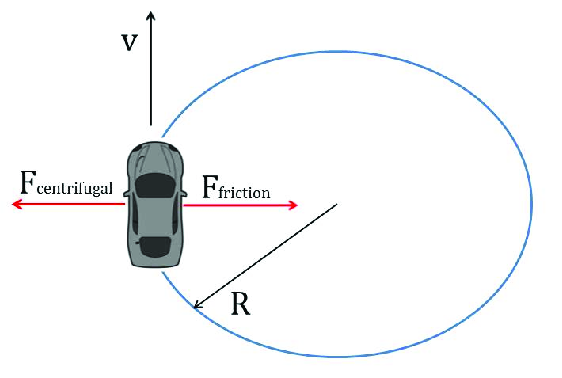
Counterbalancing side forces in cornering maneuver
The mass of the vehicle
 along with the road superelevation (cross slope)
  and the side friction between the tire and the road surface
  counterbalance the centrifugal force. Assuming that there is the same
  at each wheel of the vehicle the sum of the lateral forces is:
  , where
  is the gravitational constant. At cornering the dynamics of vehicle is described by the equilibrium of the two forces:
  , where
  is the radius of the curve. Assuming that the road geometry is known by
on-board devices such as GPS, it is possible to calculate a safe
cornering velocity.
is the radius of the curve. Assuming that the road geometry is known by
on-board devices such as GPS, it is possible to calculate a safe
cornering velocity.The following relationship holds for the maximum safe cornering velocity regarding the danger of skidding out of the corner:
 | (15) |
Note that in the calculation of the safe cornering velocity the value of the side friction factor
 plays a major role. This factor depends on the quality and the texture
of the road, the weather conditions and the velocity of the vehicle and
several other factors. The estimation of
plays a major role. This factor depends on the quality and the texture
of the road, the weather conditions and the velocity of the vehicle and
several other factors. The estimation of  has been presented by several important papers, .
However, these estimations are based on instant measurements, thus they
are not valid for look-ahead control design, where the friction of
future road sections should be estimated.
has been presented by several important papers, .
However, these estimations are based on instant measurements, thus they
are not valid for look-ahead control design, where the friction of
future road sections should be estimated.In road design handbooks the value of the friction factor is given in look-up tables as a function of the design speed, and it is limited in order to determine a comfortable side friction for the passengers of the vehicle. For the calculation of safe cornering velocity these friction values give a very conservative result.
A method to evaluate side friction in horizontal curves using supply-demand concepts has been presented by . Here the side friction has an exponential relation with the design speed as follows:
 | (16) |
 and
and  are constant values depending on the texture of the pavement. Note that
  is the estimated reference friction at a measurement speed of
  .
Thus, by using (15) and (16) the maximum safe cornering speed can be
determined on a given road surface along with the side friction factor,
as it is illustrated in Figure .
The intersections of the supply and demand curves give the safe
cornering velocities and the corresponding maximum side frictions. Note
that whereas the friction supply only depends on the velocity of the
vehicle, the friction demand is a function of the velocity and the curve
radius as well.
.
Thus, by using (15) and (16) the maximum safe cornering speed can be
determined on a given road surface along with the side friction factor,
as it is illustrated in Figure .
The intersections of the supply and demand curves give the safe
cornering velocities and the corresponding maximum side frictions. Note
that whereas the friction supply only depends on the velocity of the
vehicle, the friction demand is a function of the velocity and the curve
radius as well.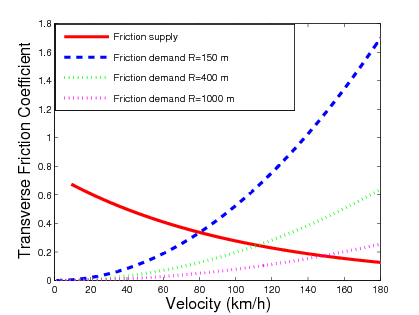
Relationship between supply and demand of side friction in a curve
The relationship between the curve radius and safe cornering velocity can be observed in Figure 5. The data points of the diagram are given by the intersections of the supply and demand curves. It shows that the safe cornering velocity increases with the curve radius. However, the relationship is not linear, i.e by increasing an already big cornering radius results in only moderated growth of the safe cornering velocity.
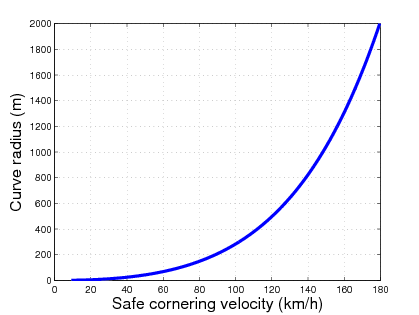
Figure 6.8. Relationship between curve radius and safe cornering velocity
Rollover danger estimation and prevention control methods have already been studied by several authors, . A quasi-static analysis of maximal safe cornering velocity regarding the danger of rollover has been presented by . Assuming a rigid vehicle and using small angle approximation for superelevation (
 ,
,  ), a moment equation can be written for the outside tires of the vehicle during cornering as follows:
  | (17) |
 is the height of the center of gravity,
  is the track width,
  is the load of the inside wheel at cornering.
The vehicle stability limit occurs at the point when the load
 reaches zero, which means the vehicle can no longer maintain
equilibrium in the roll plane. Thus by reorganizing (17) and
substituting
reaches zero, which means the vehicle can no longer maintain
equilibrium in the roll plane. Thus by reorganizing (17) and
substituting  the rollover threshold is given as follows:
  | (18) |
Road curve radius calculation
 number of sections. The goal is to calculate the curve radius at each
  section points ahead of the vehicle to determine the safe cornering velocities corresponding to the curve radius.
The calculation of the cornering radius
 ,
,  is as follows. It is assumed that the global trajectory coordinates
  and
and  of the vehicle path are known. Considering a sufficiently small
distance the trajectory of the vehicle around a section point can be
regarded as an arc, as it is shown in Figure . The arc can be divided into
of the vehicle path are known. Considering a sufficiently small
distance the trajectory of the vehicle around a section point can be
regarded as an arc, as it is shown in Figure . The arc can be divided into  data points.
The length of the arc can be approximated by summing up the distances between data points:
 These distances are calculated as:
  The length of the chord
  is calculated as follows:
  Knowing the length
  and
and  ,
,  it is possible to calculate a reasonable estimation of the curve radius
  .
Note that the length of the arc must be chosen carefully. A too short
section with fewer data points may give an unacceptable approximation of
the radius. On the other hand a too big distance can be inappropriate
as well, since then the section may not be approximated by a single arc.
The number of data points selected is also important, and by increasing
the number
.
Note that the length of the arc must be chosen carefully. A too short
section with fewer data points may give an unacceptable approximation of
the radius. On the other hand a too big distance can be inappropriate
as well, since then the section may not be approximated by a single arc.
The number of data points selected is also important, and by increasing
the number  , the accuracy of the following calculation can be enhanced. The angle of the arc
  is as follows
  . The length of the chord
  is also expressed as a function of the radius:
  . Expressing the radius
  the following equation is derived:
  | (19) |
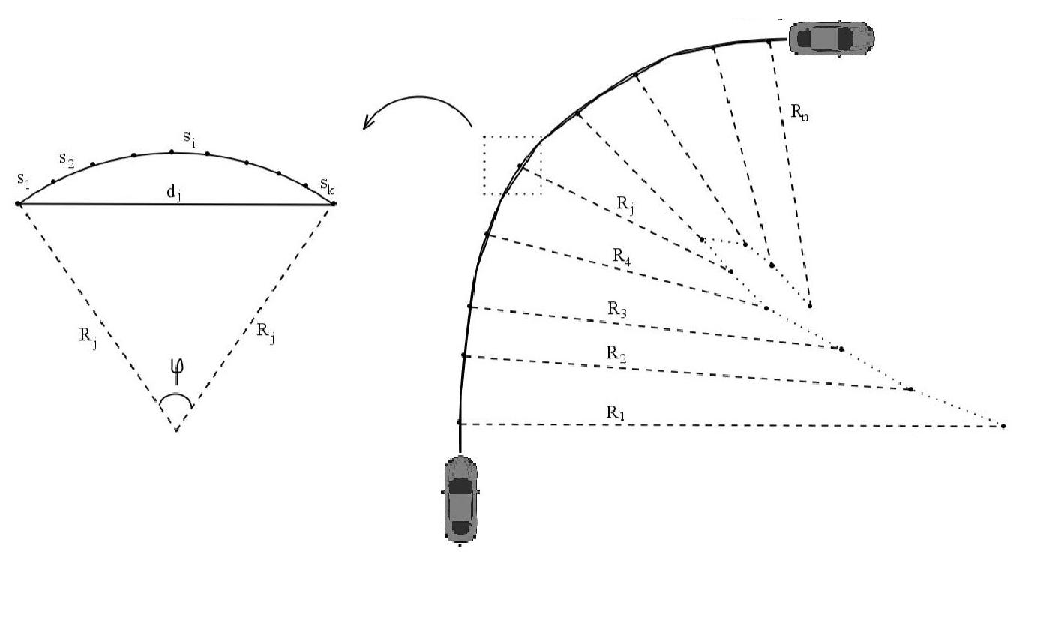
Figure The arc of the vehicle path
This expression can be transformed by introducing
 and using the Taylor series for the approximation of the
  function, i.e.,
  . Then the following expression is gained for the radius:
  | (20) |
 ,
,  can be calculated at each section point ahead of the vehicle path. The
calculation method is validated through the CarSim simulation
environment. Here, the vehicle follows the desired path while the curve
radius is being measured and at the same time the calculation method is
running giving a close approximation of the real value. The comparison
of the real and the calculated radius is shown in Figure
can be calculated at each section point ahead of the vehicle path. The
calculation method is validated through the CarSim simulation
environment. Here, the vehicle follows the desired path while the curve
radius is being measured and at the same time the calculation method is
running giving a close approximation of the real value. The comparison
of the real and the calculated radius is shown in Figure 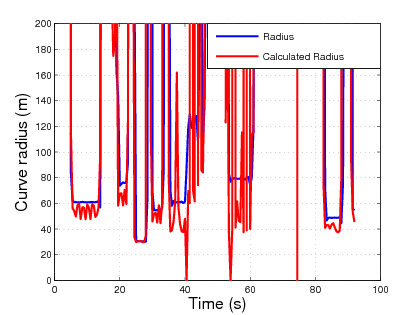
Figure Validation of the calculation method
By calculating the radius of the curve using (20) the safe cornering velocity of the vehicle can be determined by using (15) and (18). This velocity can be considered as the maximum velocity that the vehicle is capable of in a corner without the danger of slipping and leaving the track or rolling over. It is important to state that in severe weather conditions this safe velocity may be smaller than that of the speed limit, thus the consideration of the maximum safety velocity in the cruise control design is essential.
Intelligent actuators
Table of Contents
- Throttle-by-wire
- Steer-by-wire
- Brake-by-wire
- Shift-by-wire
Up until the late 1980s most of the cars have had mechanical, hydraulic or pneumatic connection (such as throttle Bowden cable, steering column, hydraulic brake etc.) between the HMI and the actuator. Series production of the x-by-wire systems was introduced with the throttle-by-wire (electronic throttle control) applications in engine management, where the former mechanical Bowden was replaced for electronically controlled components. The electronic throttle control (ETC) was the first so called x-by-wire system, which has replaced the mechanical connection. The use of ETC systems has become a standard on vehicle systems to allow advanced powertrain control, meet and improve emissions, and improve driveability. Today throttle-by-wire applications are standard in all modern vehicle models.
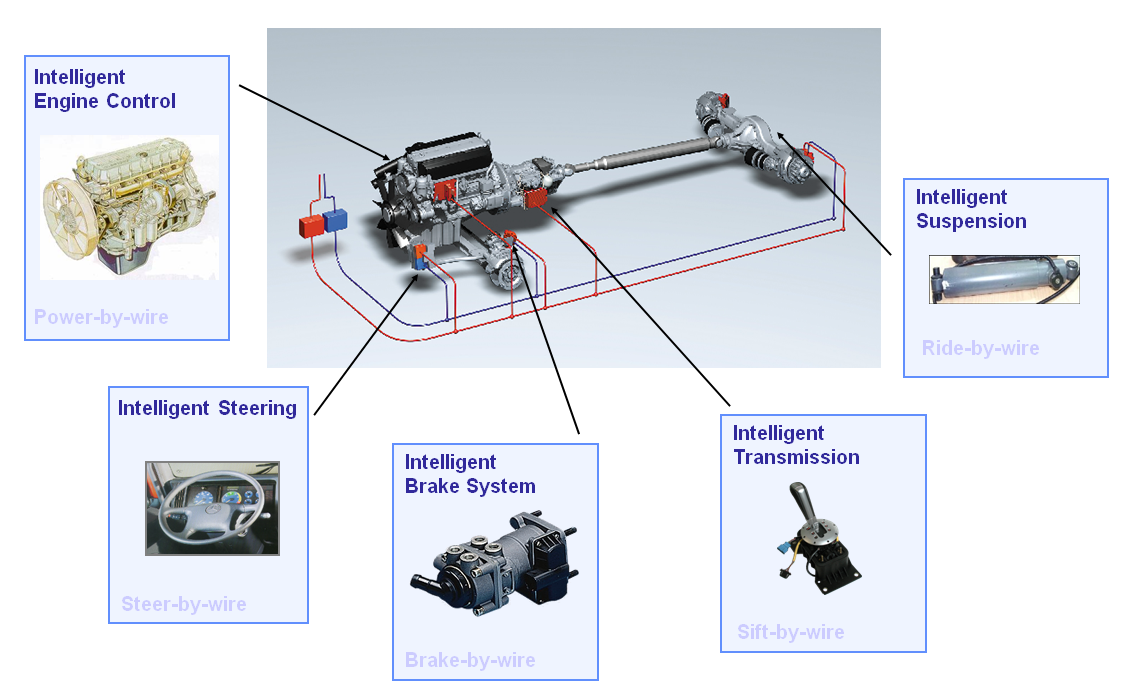
Figure Intelligent actuators influencing vehicle dynamics (Source: Prof. Palkovics)
The figure above shows the intelligent actuators in the vehicle that has strong influence on the vehicle dynamics. Throttle–by-wire systems enables the control of the engine torque without touching the gas pedal, steer-by-wire systems allow autonomous steering of the vehicle, brake-by-wire systems delivers distributed brake force without touching the brake pedal, shift-by-wire systems enables the automatic selection of the proper gear.
For providing highly automated vehicle functions the intelligent actuators are mandatory requirements. For example for a basic cruise control function, only the throttle-by-wire actuator is required, but if we extend the functionality for adaptive cruise control the brake-by-wire subsystem will also be a prerequisite. While adding the shift-by-wire actuator one can provide even more comfortable ACC function. Steer-by-wire subsystems become important when not only the longitudinal, but also the lateral control of the vehicle is implemented e.g. lane keeping, temporary autopilot.
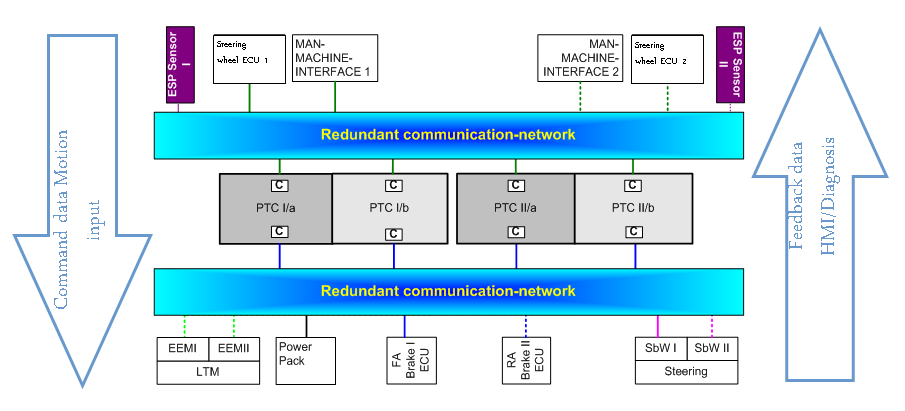
Figure The role of communication networks in motion control (Source: Prof. Spiegelberg)
These intelligent actuators are each responsible for a particular domain of the vehicle dynamics control, while the whole vehicle movement (trajectory execution) is organized by the so-called powertrain controller. The powertrain controller separates and distributes the complex tasks for fulfilling the vehicle movement defined by the motion vector.
Another system should be noted here, namely the active suspension system. The suspension is not a typical actuator because generally it is a springing-damping system which connects the vehicle to its wheels, and allows relative movement between each other. The driver cannot influence the movement of the vehicle by direct intervention into the suspension. Modern vehicles can provide active suspension system primarily to increase the ride comfort and additionally to increase vehicle stability, thus safety. In this case an electronic controller can influence the vehicle dynamics by the suspension system.
Vehicular networks
The Controller Area Network (CAN) is a serial communications protocol which efficiently supports distributed real-time control with a very high level of security. Its domain of application ranges from high-speed networks to low-cost multiplex wiring. In automotive electronics, electronic control units (ECU) are connected together using CAN and changing information with each-other by bitrates up to 1 Mbit/s.
CAN is a multi-master bus with an open, linear structure with one logic bus line and equal nodes. The number of nodes is not limited by the protocol. Physically the bus line (Figure 6) is a twisted pair cable terminated by termination network A and termination network B. The locating of the termination within a CAN node should be avoided because the bus lines lose termination if this CAN node is disconnected from the bus line. The bus is in the recessive state if the bus drivers of all CAN nodes are switched off. In this case the mean bus voltage is generated by the termination and by the high internal resistance of each CAN nodes receiving circuitry. A dominant bit is sent to the bus if the bus drivers of at least one unit are switched on. This induces a current flow through the termination resistors and, consequently, a differential voltage between the two wires of the bus. The dominant and recessive states are detected by transforming the differential voltages of the bus into the corresponding recessive and dominant voltage levels at the comparator input of the receiving circuitry.
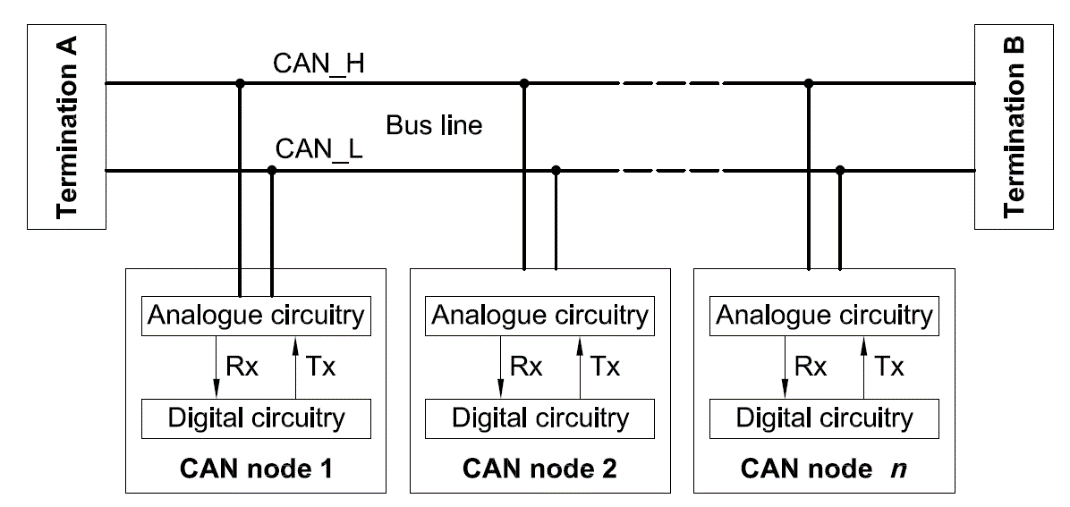
Figure CAN bus structure (Source: ISO 11898-2)
The CAN standard gives specification which will be fulfilled by the cables chosen for the CAN bus. The aim of these specifications is to standardize the electrical characteristics and not to specify mechanical and material parameters of the cable. Furthermore the termination resistor used in termination A and termination B will comply with the limits specified in the standard also.
Besides the physical layer the CAN standard also specifies the ISO/OSI data link layer as well. CAN uses a very efficient media access method based on the arbitration principle called "Carrier Sense Multiple Access with Arbitration on Message Priority". Summarizing the properties of the CAN network the CAN specifications are as follows:
- prioritization of messages
- event based operation
- configuration flexibility
- multicast reception with time synchronization
- system wide data consistency
- multi-master
- error detection and signalling
- automatic retransmission of corrupted messages as soon as the bus is idle again
- distinction between temporary errors and permanent failures of nodes and autonomous switching off of defect nodes
Safety critical systems
- Safety critical subsystem (e.g. steer-by-wire, brake-by-wire, throttle-by-wire)
- Not safety critical subsystem (e.g. shift-by-wire, active suspension)
The required safety level can be traced back to the risk analysis of a potential failure. During risk analysis the probability of a failure and the severity of the outcome are taken into consideration. Based on this approach the risk of a failure can be categorized into layers, like low, medium or high as can be seen on the following figure:
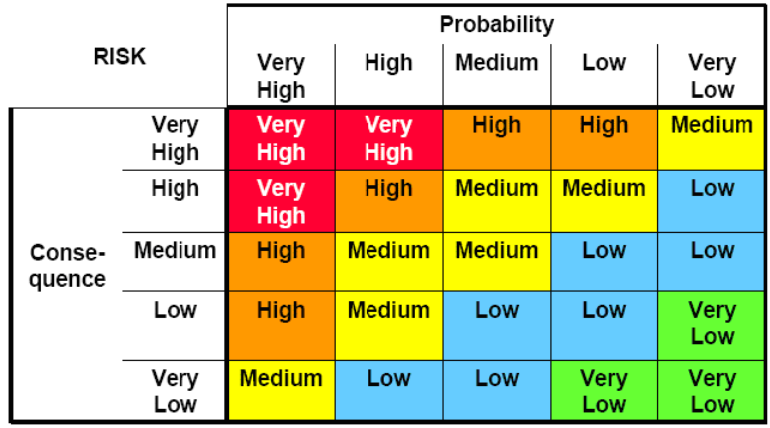
Figure Categorization of failure during risk analysis (Source: EJJT5.1Tóth)
The IEC61508 standard stands for “Functional safety of electrical/electronic/programmable electronic (E/E/PE) safety-related systems” The IEC61508 standard provides a complex guideline for designing electronic systems, where the concept is based on
- risk analysis,
- identifying safety requirements,
- design,
- implementation and
- validation.
Dependability summarizes a system’s functional reliability, meaning that a certain function is at the driver’s disposal or not. There are different aspects of dependability, first of all availability, meaning that the system should deliver the function when it is requested by the driver (e.g. the vehicle should decelerate when the driver pushes the brake pedal). The subsequent aspect is reliability, indicating that the delivered service is working as requested (e.g. the vehicle should decelerate more as the driver pushes the brake pedal more). Safety in this manner implies that the system that provides the function operates without dangerous failures. Functional security ensures that the system is protected against accidental or deliberate intrusion (this is more and more important since vehicle hacking became an issue recently . There are additional important characteristics can be defined as a part of dependability like maintainability, reparability that has real add value during operation and maintenance. The figure below shows a block diagram describing the characteristics of functional dependability.
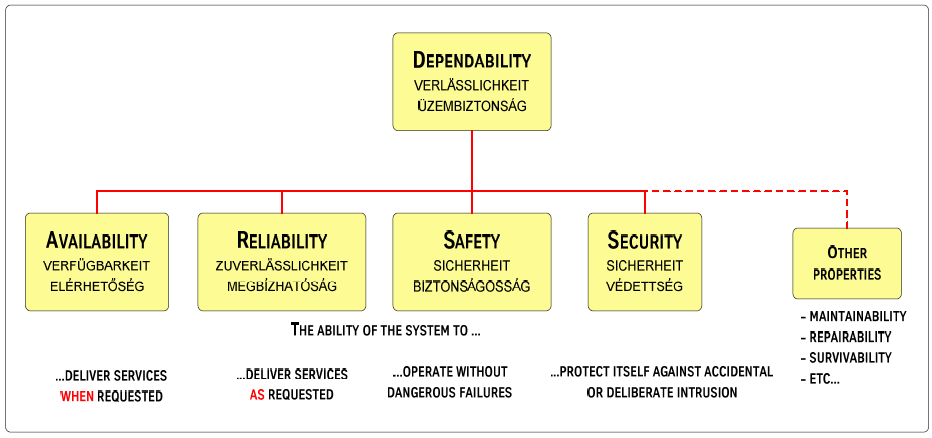
Figure Characterization of functional dependability (Source: EJJT5.1 Tóth)
Generally the acceptable risk hazard is below the tolerable risk limit, defined by market (end-user requirements expressed by the OEMs). The probability of a function loss should be inversely related to the probability of the safety level of the function. For example in the aviation industry (Airbus A330/A340) the accepted probability of a non-intended flap control is P < 1*10-9 (Source: Büse, Diehl). Such high requirements for the availability can only be fulfilled by so called fault-tolerant systems. This is the reason why automotive safety critical systems must be fault tolerant; meaning that one failure in the system may not reduce the functionality. Please remember the two independent circuits of the traditional hydraulic brake system, having the intension that if one circuit fails, there is still brake performance (but in this case not 100%!) in the vehicle. Such systems are called 2M systems, since there are two independent mechanical circuits in the architecture.
In today’s electronically controlled safety critical systems there are usually at least one mechanical backup system. As a result, the probability of a function loss with a mechanical backup (1E+1M - one electrical system and one mechanical system architecture) can be as low as P < 1*10-8, while the probability of a function loss without mechanical backup (1E - architecture alone) is around P < 1*10-4. The objective of the safety architectural design is to provide around P < 1*10-8 level of dependability (availability) in case of 2E system architectures (electronic system with electronic backup) without mechanical backup.
Safety architectural design means consideration of all potential failures and relevant design answers to all such issues. The easiest answer to produce a fault tolerant system, so as to avoid that one failure may result is a complete function loss is to duplicate the system and extend it with arbitration logic. In case of a redundant system extended it with arbitration logic the subcomponents are not simply duplicated, but there is a coordinating control above to enable (or disable) output control based on the comparison of the two calculated outputs of the redundant subsystems. In case both subsystems have the same output (and none of them identified errors) the overall system output is enabled. Even in case of redundancy there are several tricks to enhance the safety level of a system. For example safety engineers soon realized that it makes great difference if the redundant subsystems are composed of physically the same (hardware and software) or physically different components. Early solutions just used two physically same components for redundancy, but today the different hardware and software components are predefined requirements to eliminate the systematic failures caused by design and/or software errors.
Redundancy and supervision are not only issue in case of fault tolerant architectures, safety focused approach can also be observed in ECU (electronic Control Unit) design. Early and simple ECUs were only single processor systems; while later - especially in brake system control – the dual processor architectures became widespread. Initially these two processors were the same microcontrollers (e.g. Intel C196) with the same software (firmware) inside. In this arrangement both microcontrollers have access to all of the input signals, they individually perform internal calculations based on the same algorithm each resulting in a calculated output command. These two outputs then are compared to each-other and only in case both controllers came to the same result (without any errors identified) the ECU output is controlled. This so called A-A processor architecture was a significant step forward in safety (compared to single processor systems), but safety engineers quickly understood, that this approach does not prevent system loss in case of systematic failures (e.g. microcontroller hardware bug or software implementation error). This is the reason why the A-B processor architecture was later introduced. In the A-B processor approach the two controllers physically must differ from each other. Usually the A controller is bigger and more powerful (bigger in memory capacity, having more calculation power) than the B controller. The A controller is often identified as “main” controller, while B controller is often referred to as “safety” controller, since in this task distribution the A controller is responsible for the functionality, while the B controller has only tasks for checking the A controller. B controller has access also to the inputs of the A controller, but the algorithms inside are totally different. B controller also does calculations based on the input signals, but these are not detailed calculations, only basic calculations on a higher level “like rule of thumb” checking. The different hardware and the different software algorithms in A-B processor design have proved its superior reliability.
Besides the different controller architectures there are also different kinds of dedicated supervisory electronics used extensively by the automotive electronics industry. The most significant ones are the so called “watch-dog” circuits. The watch-dogs are generally separate electronic devices that have a preset internal alarm timer. If the watch-dog does not get an “everything is OK” signal from the main controller within the predefined timeframe, the watch-dog generates a hardware reset of the whole circuitry (ECU). There are not only simple watch-dog integrated circuits available, but also more complex ones (e.g. windowed watch-dogs), however the theory of operation are basically the same.
Up to now fault-tolerant requirements were only observed from functional point-of-view, while a simple failure in the energy supply system can also easily result in function loss. That is why a fail-safe electrical energy management subsystem is a mandatory requirement for safe electrical energy supply of safety related drive-by-wire subsystems (e.g. steer-by-wire, brake-by-wire). The following figure shows a block diagram of a redundant energy management architecture (where PTC stands for Powertrain Controller, SbW stands for Steer by Wire and BbW stands for Brake by Wire subsystems).
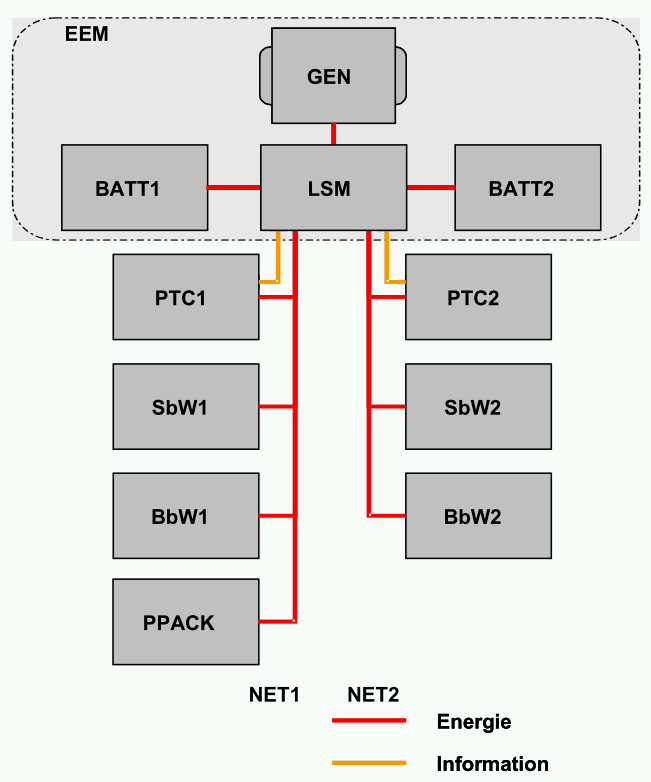
Figure Redundant energy management architecture (Source: PEIT)
Steering
In the present day automobiles, power assisted steering has become a standard feature. Electrically power assisted steering has replaced the hydraulic steering aid which has been the standard for over 50 years. A hydraulic power assisted steering (HPAS) uses hydraulic pressure supplied by an engine-driven pump. Power steering amplifies and supplements the driver-applied torque at the steering wheel so that the required drive steering effort is reduced. The recent introduction of electric power assisted steering (EPAS) in production vehicles eliminates the need of the former hydraulic pump, thus offering several advantages. Electric power assisted steering is more efficient than conventional hydraulic power assisted steering, since the electric power steering motor only needs to provide assist when the steering wheel is turned, whereas the hydraulic pump must run continually. In the case of EPAS the assist level is easily adjustable to the vehicle type, road speed, and even driver preference. An added benefit is the elimination of environmental hazard posed by leakage and disposal of hydraulic power steering fluid.
Although aviation industry proved that the fly-by-wire systems can be as reliable as the mechanical connection, automotive industry steps forward with intermediate phases like EPAS (electronically power assisted steering) as mentioned above and SIA (superimposed actuation) to be able to electronically intervene into the steering process.
Electric power steering (EPAS) usually consists of a torque sensor in the steering column measuring the driver’s effort, and an electric actuator which then supplies the required steering support .This system enables to implement such functions that were not feasible with the former hydraulic steering like automated parking or lane departure preventions.
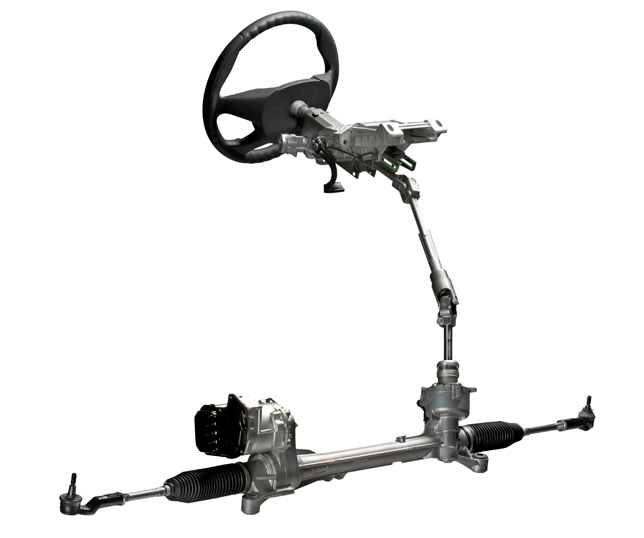
Electronic power assisted steering system (TRW)
Superimposed actuation (SIA) allows driver-independent steering input without disconnecting the mechanical linkage between the steering wheel and front axle. It is based on a standard rack-and-pinion steering system extended with a planetary gear in the steering column ). The planetary gear has two inputs, the driver controlled steering wheel and an electronically controlled electromotor and one output connected to the steering pinion at the front axle. The output movement of the planetary gear is determined by adding the steering wheel and the electro-motor rotation. When the electromotor is not operating, the planetary gear just passes through the rotation of the steering wheel; therefore the system also has an inherent fail silent behaviour. SIA systems may provide functions like speed dependent steering and limited (nearly) steer-by-wire functionality.
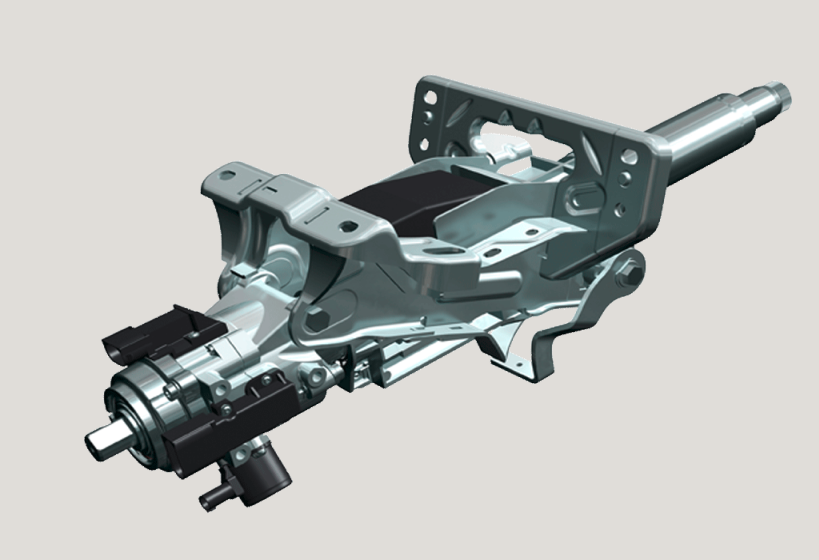
Figure Superimposed steering actuator with planetary gear and electro motor (ZF)
The future of driving is definitely the steer-by-wire technology. An innovative steering system allowing new degrees of freedom to implement a new human machine interface (HMI) including haptic feedback (by "cutting" the steering column, i.e. opening the mechanical connection steering wheel / steering system).
The steer-by-wire system offers the following advantages:
- The absence of steering column simplifies the car interior design.
- The absence of steering shaft, column and gear reduction mechanism allows much better space utilization in the engine compartment.
- Without mechanical connection between the steering wheel and the road wheel, it is less likely that the impact of a frontal crash will force the steering wheel to intrude into the driver’s survival space.
- Steering system characteristics can easily and infinitely be adjusted to optimize the steering response and feel.
This above described solution is a 1E+1M architecture system, representing a steer-by wire system with full mechanical backup function. A similar system was installed in the PEIT demonstrator vehicle to validate steer-by-wire functionality.
Figure Steer-by-wire actuator installed in the PEIT demonstrator (Source: PEIT)
As steer-by-wire system design involves supreme safety considerations, it is not surprising that after PEIT the later HAVEit approach has extended the original safety concept with another electric control circuitry resulting in a 2E+1M architecture system. The following figure describes the safety mechanism of a steer-by-wire clutch control by introducing two parallel electronic control channels with cross checking functions
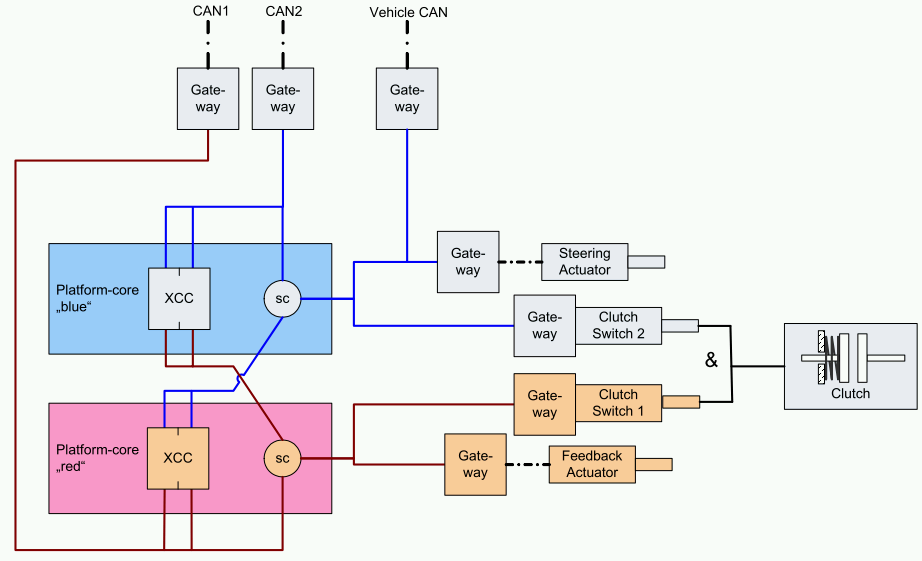
Figure Safety architecture of a steer-by-wire system (Source: HAVEit)
Steer-by-wire systems also raise new challenges to be resolved, like force-feedback or steering wheel end positioning. In case of the mechanical steering the driver has to apply torque to the steering wheel to turn the front wheels either to left or right directions, the steering wheel movement is limited by the end positions of the steered wheels and the stabilizer rod automatically turns back the steering wheel into the straight position. In steer-by-wire mode when the clutch is open there is no direct feedback from the steered wheels to the steering wheel and without additional components there would be no limit for turning the steering wheel in either direction. Additionally there has to be a driver feedback actuator installed in the steering wheel to provide force (torque) feedback to the driver.
Mainly due to legal legislation traced back to safety issues steer-by-wire systems are not common on today’s road vehicles however the technology to be able to steer the wheels without mechanical connection exists since the beginning of the 2000s. Up to now only Infiniti introduced a steer-by-wire equipped vehicle into the market in 2013, but its steer-by-wire system contains a mechanical backup with a fail-safe clutch described later. The Nissan system debuted under the name of Direct Adaptive Steering technology, . It uses three independent ECUs for redundancy and a mechanical backup. There is a fail-safe clutch integrated to the system, which is open during electronically controlled normal driving situations (steer-by-wire driving mode), but in case of any fault detection the clutch is closed, establishing a mechanical link from the steering wheel to the steered axle, working like a conventional, electrically assisted steering system. illustrates DAS system architecture with the system components.
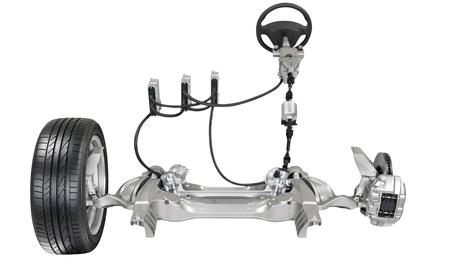
Figure Direct Adaptive Steering (SbW) technology of Infiniti (Source: Nissan)
Engine
Electronic throttle control enables the integration of features such as cruise control, traction control, stability control, pre-crash systems and others that require torque management, since the throttle can be moved irrespective of the position of the driver's accelerator pedal. Throttle-by-wire provides some benefit in areas such as air-fuel ratio control, exhaust emissions and fuel consumption reduction, and also works jointly with other technologies such as gasoline direct injection.
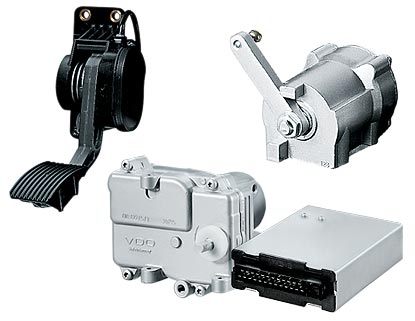
Figure Retrofit throttle-by-wire (E-Gas) system for heavy duty commercial vehicles (Source: VDO)
Brakes
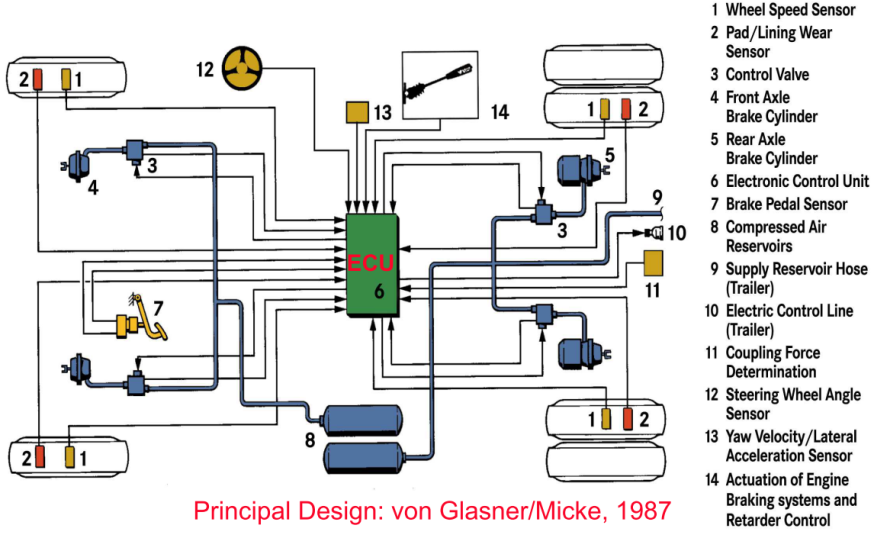
Figure 7.13. Layout of an electronically controlled braking system (Source: Prof. von Glasner)
Electro-pneumatic Brake (EPB)
The basic functionality of the EBS can be observed in Figure . The driver presses the brake pedal which is connected to the foot brake module. It measures the pedal’s path with redundant potentiometers and sends the drivers demand to the central ECU. The EBS’s central ECU calculates the required pressure for each wheel and sends the result to the brake actuator ECUs. In this ECU there is closed loop pressure control software, which sets the air pressure in the brake chambers to the prescribed value. The actuator ECU also measures the wheel speed and sends this information back to the central EBS ECU. During the normal operation the actuator ECUs energize the so-called backup valves, which results in the pneumatic backup system’s deactivation. In case of any detected or unexpected error (and when unpowered) the backup valves are dropped and the conventional pneumatic brake system becomes active again.
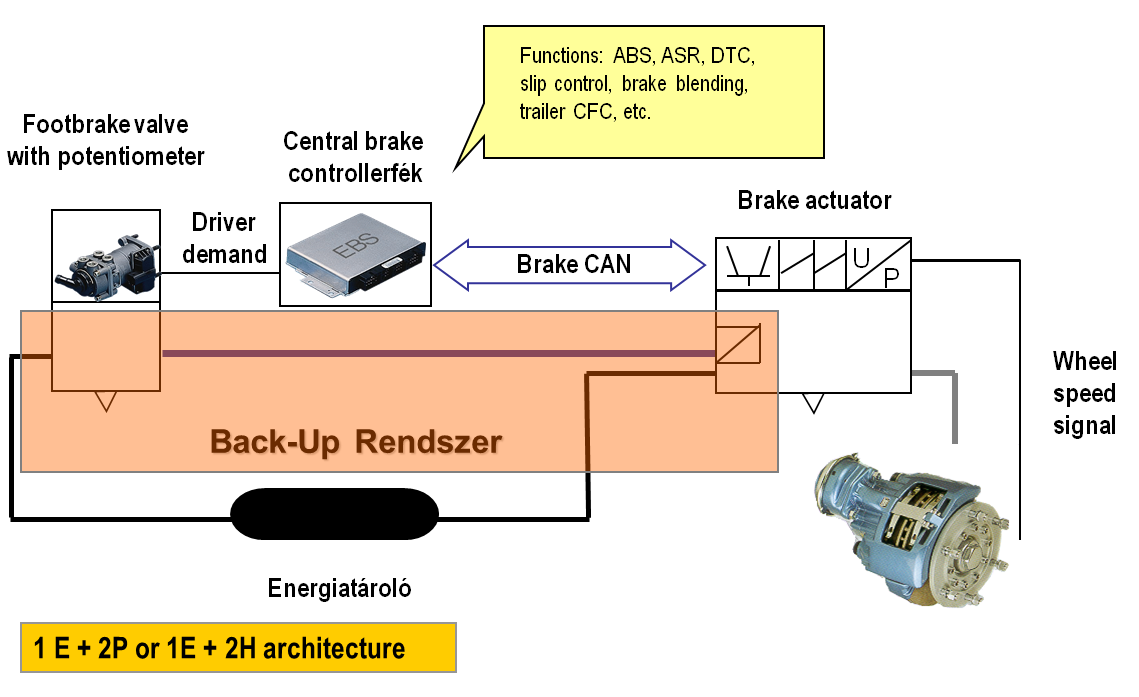
Figure Layout of an Electro Pneumatic Braking System (Source: Prof. Palkovics)
The advantages of electronic control over conventional pneumatic control are shorter response times and build-up times in brake cylinders, reducing the brake distance and the integration possibility of several active safety and comfort functions like the followings.
- Anti-lock Braking System (ABS)
- Traction control (ASR,TCS)
- Retarder and engine brake control
- Brake pad wear control
- Vehicle Dynamics Control (VDC/ESP)
- Yaw Control (YC)
- Roll-Over Protection (ROP)
- Coupling Force Control (CFC) between the tractor and semi-trailer
- Adaptive Cruise Control (ACC)
- Hill holder
Elector-hydraulic Brake (EHB)
An Electro Hydraulic Brake system is practically a brake-by-wire system with hydraulic actuators and a hydraulic backup system. Normally there is no mechanical connection between the brake pedal and the hydraulic braking system. When the brake pedal is pressed the pedal position sensor detects the amount of movement of the driver, thus the distance the brake pedal travelled. In addition the ECU feedbacks to the brake pedal’s actuator which hardens the pedal to help the driver to feel the amount of the braking force. As a function of distance the ECU determines the optimum brake pressure for each wheel and applies this pressure using the hydraulic actuators of the brake system. The brake pressure is supplied by a piston pump driven by an electric motor and a hydraulic reservoir which is sufficient for several consecutive brake events. The nominal pressure is controlled between 140 and 160 Ba. The system is capable of generating or releasing the required brake pressure in a very short time. It results in shorter stopping distance and in more accurate control of the active safety systems. Should the electronic system encounter any errors the hydraulic backup brake system is always there to take over the braking task. The following figure shows the layout of an electronically controlled hydraulic brake system.
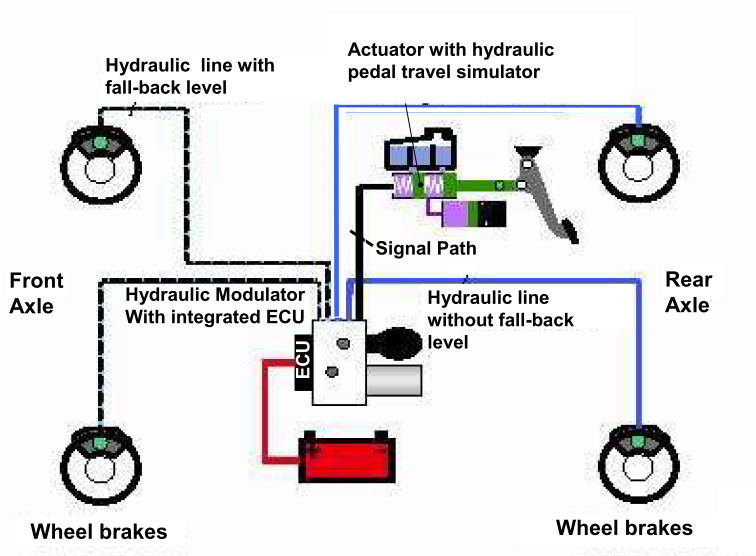
Figure Layout of an Electro Hydraulic Braking System (Source: Prof. von Glasner)
The first brake-by-wire system with hydraulic backup was born from the cooperation of Daimler and Bosch in 2001, which was called Sensotronic Brake Control (SBC). It was not a success story, because of software failures. The customers complained because the backup mode resulted in longer stopping distance and higher brake pedal effort by the driver. In May 2004, Mercedes recalled 680,000 vehicles to fix the complex brake-by-wire system. Then, in March 2005, 1.3 million cars were recalled, partly because of further unspecified problems with the Sensotronic Brake Control system.
Electro-mechanic brake (EMB)
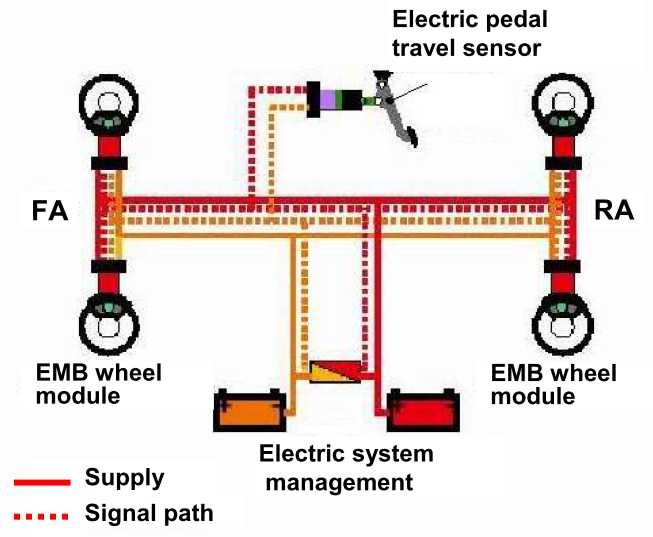
Figure Layout of an Electro Mechanic Brake System (Source: Prof. von Glasner)
Power requirements for EMB are high and would overload the capabilities of conventional 12 volt systems installed in today's vehicles. Therefore the electro-mechanical brake is designed for a working voltage of 42 volts, which can be ensured with extra batteries.
Transmission
In case of the manual transmission system, the driver has the maximum control over the vehicle; however using manual transmission requires a certain practice and experience. The manual transmission is fully mechanical system that the driver operates with a stick-shift (gearshift) and a clutch pedal. The manual transmission is generally characterized by simple structure, high efficiency and low maintenance cost.
Automatic transmission systems definitely increase the driving comfort by taking over the task of handling the clutch pedal and choosing the appropriate gear ratio from the driver. Regardless of the realization of the automatic transmission system, the gear selection and changing is done via electronic control without the intervention of the driver. There are different types of automatic transmission systems available, like
- Automated Manual Transmission (AMT)
- Dual Clutch Transmission (DCT/DSG)
- Hydrodynamic Transmission (HT)
- Continuously Variable Transmission (CVT)
Clutch
In the SensoDrive electronically controlled manual transmission system of Citroen there is no clutch pedal. The gear shifting is simply done by selecting the required gear with the gear stick or the paddle integrated into the steering wheel. During gear shifting the driver even does not have to release the accelerator pedal. The SensoDrive system is managed by an electronic control unit (ECU), which controls two actuators. One actuator changes gears while the other, which is equipped with a facing wear compensation system, opens and closes the clutch. The following figure illustrates the operation of the clutch-by-wire system of Citroen
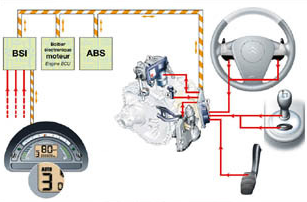
Figure Clutch-by-wire system integrated into an AMT system (Source: Citroen)
Automated Manual Transmission (AMT)
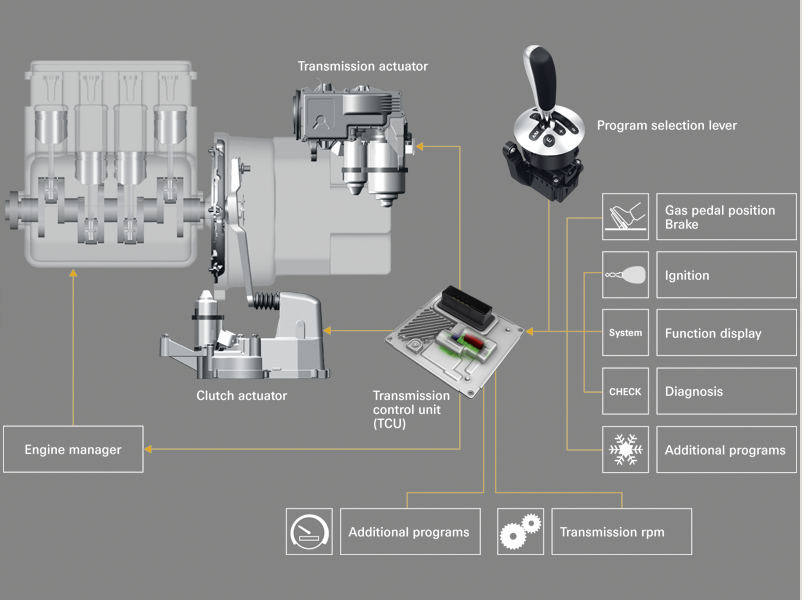
Figure Schematic diagram of an Automated Manual Transmission (Source: ZF)
Automated Manual Transmissions have a lot of favourable properties; the disadvantage is that the power flow (traction) is lost during switching gear, as it is necessary to open the clutch. This is what automatic transmission systems have eliminated providing continuous traction during acceleration.
Dual Clutch Transmission (DTC/DSG)
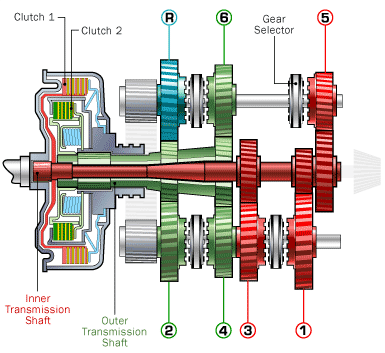
Figure Layout of a dual clutch transmission system (Source: howstuffworks.com)
Hydrodynamic Transmission (HT)
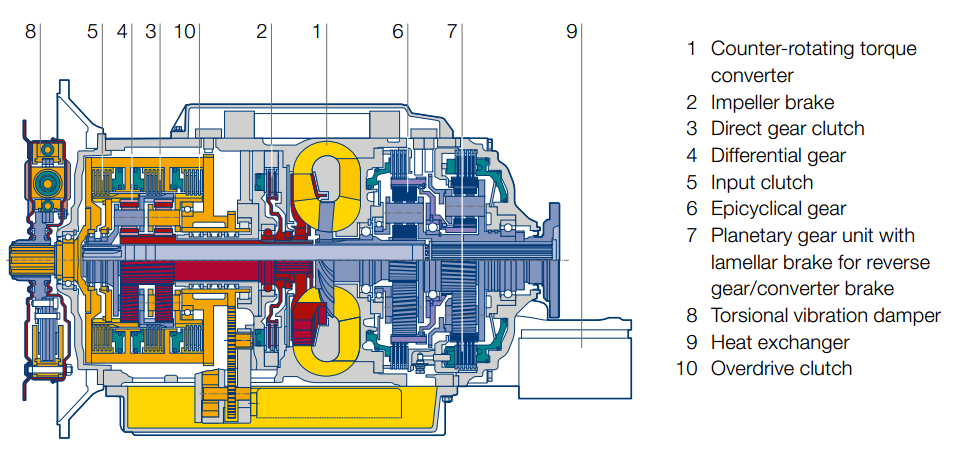
Figure Cross sectional diagram of a hydrodynamic torque converter with planetary gear (Source: Voith)
Continuously Variable Transmission (CVT)
While traditional automatic transmissions use a set of gears that provides a given number of ratios there are no gears in CVT transmissions, but two V-shaped variable-diameter pulleys connected with a metal belt. One pulley is connected to the engine, the other to the driven wheels.
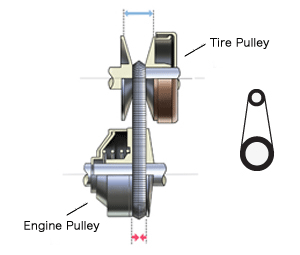
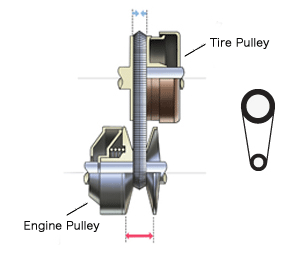
Figure CVT operation at high-speed and low-speed (Source: Nissan)
Changing the diameter of the pulleys varies the transmission ratio (the number of times the output shaft spins for each revolution of the engine). Illustrated in the figures above, as the engine (input) pulley width increases and the tire (output) pulley width decreases, the engine pulley becomes smaller than the tire pulley for the diameter of the part where the pulley and the belt are in contact. This is the state of being in low gear. Vice versa, as the engine pulley width decreases and the tire pulley width increases, the diameter of the part where belt and pulley are in contact grows larger for the engine pulley than the tire pulley, which is the state of being in high gear. The main advantage of the CVT is that pulley width can be continuously changed, allowing the system to change transmission gear ratio smoothly and without steps .
The controls for a CVT are the same as an automatic: Two pedals (accelerator and brake) and a P-R-N-D-L-style shift pattern.
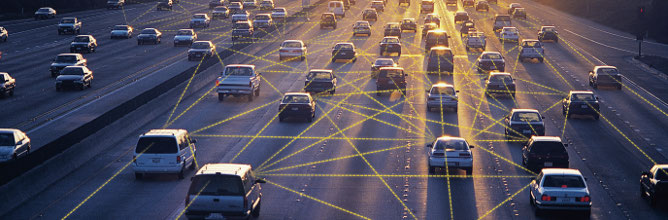
Nowadays the developed countries are increasingly characterized by a pervasive computing environment. The people’s living environments are emerging based upon information resource provided by the connections of various communication networks. New handheld devices like smartphones and tablets enhance information processing and global access of users. During the last decade, advances in both hardware and software technologies have resulted in the need for connecting the vehicles with each other. In this chapter first the basic theory of the Mobile Ad Hoc Networks are introduced, then the available functions and the advantages of the vehicle to vehicle interactions are detailed.
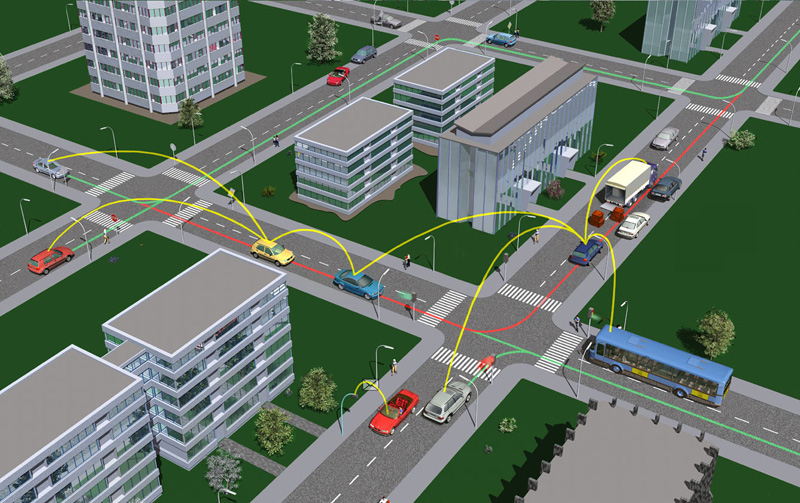
X . IIIII
Why does a touchscreen not work when it is wet or the fingers of user are wet?
The touchscreen used in the smartphones now a days uses the Capacitive sensing technology.
Earlier the smartphones had a Resistive touchscreen which used a stylus to operate. It works on the principle of pressure applied on the screen with the finger. It could also operate with a gloved hand.
Today, the most commonly used is the Capacitive Touchscreen which relies on the electrical properties of the human body to detect when and where on a display the user touches.
This facilitates the
detection of very light touches of a finger and does not work well with a
gloved hand as the cloth restricts the electrical conductivity of the
body to interact with the screen.
Now, we are aware of the fact that water is a good electric conductor (unless pure water). Then why doesn’t the phone work with sweaty hands or wet fingers?
This
happens because the water is also conductive and this causes error in
the capacitive measurement which confuses the receptors of the
touchscreen.
When you have wet hands, you
inevitably touch parts of the screen other than where you want to. The
phone doesn't know what is your finger and what is water. All it knows
is it is being touched in multiple places and hence becomes
unresponsive.
This is a graph displaying the
similarity of the signal level of the water droplet and the finger
touching the screen of the phone.

 Hence, the performance of the touch screen is compromised when you use it with wet hands.
The corrective method for this problem is to incorporate the “Self - capacitance” mode of touch sensing.
Hence, the performance of the touch screen is compromised when you use it with wet hands.
The corrective method for this problem is to incorporate the “Self - capacitance” mode of touch sensing.

The Raw Count shown in the figure is the unfiltered output from the
sensor. The Baseline is a continuously updated estimate of the average
Raw Count level when a finger is not present. The Baseline provides a
reference point for determining when a finger is present on the sensing
surface.
Fingers and water interact in a similar, but not identical, way with
electric fields. There is enough difference between the two to make
possible techniques for discriminating between a touch and a spill. On printed circuit boards and flex circuits, a practical level of water tolerance is achieved with the use of a shield electrode and guard sensor. These special electrodes add no material cost to the system since they are incorporated into the same circuit board layout as the touch sensors, as shown in Figure 3 below.
Figure 3. The shield electrode and guard sensor are added to the printed circuit board layout to add water tolerance to standard touch sensors.
The purpose of the shield electrode is to set up an electric field pattern around the touch sensors that helps attenuate the effects of water. The purpose of the guard sensor is to detect abnormally high liquid levels so the system can react appropriately.

X . IIIIII
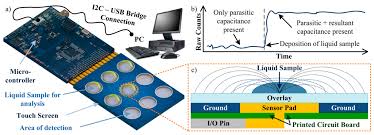
Touchscreens

The Sony ebook Reader features an infrared touchscreen (described in more detail below). That eliminates the need for a separate keyboard and allows the gadget to be much smaller and more portable. You press the screen to turn pages and create bookmarks, and you can use a pop-up on-screen keyboard to make notes in the books you're reading, as I'm doing here.
Once upon a time, the way to get a computer to do something useful was to feed it a stack of cards with holes punched into them. Thankfully, things have moved on a lot since then. Now we can get our computers to do things simply by pointing and clicking with a mouse—or even by speaking ordinary commands with voice recognition software. But there's a revolution coming that will make computers even easier to use—with touch-sensitive screens. Cellphones like Apple's iPhone, ebook readers, and some MP3 players already work with simple, touch controls—and computers are starting to work that way too. Touchscreens are intuitively easy to use, but how exactly do they work?
Keyboards and switches
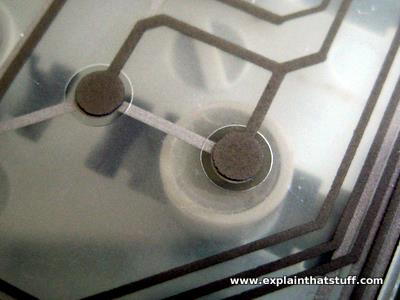
A touchscreen is a bit like an invisible keyboard glued to the front of your computer monitor. To understand how it works, it helps if you know something about how an ordinary keyboard works first. You can find out about that in our article on computer keyboards, but here's a quick reminder. Essentially, every key on a keyboard is an electrical switch. When you push a key down, you complete an electric circuit and a current flows. The current varies according to the key you press and that's how your computer figures out what you're typing.
In a bit more detail, here's what happens. Inside a keyboard, you'll find there are two layers of electrically conducting plastic separated by an insulating plastic membrane with holes in it. In fact, there's one hole underneath each key. When you press a key, you push the top conductor layer down towards the bottom layer so the two layers meet and touch through the hole. A current flows between the layers and the computer knows you've pressed a key. Little springy pieces of rubber underneath each key make them bounce back to their original position, breaking the circuit when you release them.
Touchscreens have to achieve something similar to this on the surface on your computer screen. Obviously they can't use switches, membranes, and bits of plastic or they'd block the view of the screen below. So they have to use more cunning tricks for sensing your touch—completely invisibly!
Photo: This is the sensitive, switch layer from inside a typical PC keyboard. It rests under the keys and detects when you press them. There are three separate layers of plastic here. Two of them are covered in electrically conducting metal tracks and there's an insulating layer between them with holes in it. The dots you can see are places where the keys press the two conducting layers together. The lines are electrical connections that allow tiny electric currents to flow when the layers are pressed tightly together.
How touchscreens work
Different kinds of touchscreen work in different ways. Some can sense only one finger at a time and get extremely confused if you try to press in two places at once. Others can easily detect and distinguish more than one key press at once. These are some of the main technologies:Resistive
Resistive touchscreens (currently the most popular technology) work a bit like "transparent keyboards" overlaid on top of the screen. There's a flexible upper layer of conducting polyester plastic bonded to a rigid lower layer of conducting glass and separated by an insulating membrane. When you press on the screen, you force the polyester to touch the glass and complete a circuit—just like pressing the key on a keyboard. A chip inside the screen figures out the coordinates of the place you touched.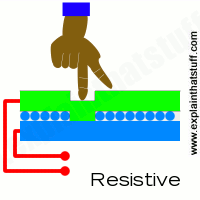
When you press a resistive touchscreen, you push two conducting layers together so they make contact, a bit like an ordinary computer keyboard.
Capacitive
These screens are made from multiple layers of glass. The inner layer conducts electricity and so does the outer layer, so effectively the screen behaves like two electrical conductors separated by an insulator—in other words, a capacitor. When you bring your finger up to the screen, you alter the electrical field by a certain amount that varies according to where your hand is. Capacitive screens can be touched in more than one place at once. Unlike most other types of touchscreen, they don't work if you touch them with a plastic stylus (because the plastic is an insulator and stops your hand from affecting the electric field).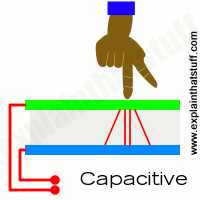
In a capacitive touchscreen, the whole screen is like a capacitor. When you bring your finger up close, you affect the electric field that exists between the inner and outer glass.
Infrared
Just like the magic eye beams in an intruder alarm, an infrared touchscreen uses a grid pattern of LEDs and light-detector photocells arranged on opposite sides of the screen. The LEDs shine infrared light in front of the screen—a bit like an invisible spider's web. If you touch the screen at a certain point, you interrupt two or more beams. A microchip inside the screen can calculate where you touched by seeing which beams you interrupted. The touchscreen on Sony Reader ebooks (like the one pictured in our top photo) works this way. Since you're interrupting a beam, infrared screens work just as well whether you use your finger or a stylus.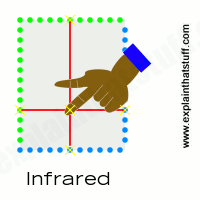
An infrared touchscreen uses the same magic-eye technology that Tom Cruise had to dodge in the movie Mission Impossible. When your fingers move up close, they break invisible beams that pass over the surface of the screen between LEDs on one side and photocells on the other.
Surface Acoustic Wave
Surprisingly, this touchscreen technology detects your fingers using sound instead of light. Ultrasonic sound waves (too high pitched for humans to hear) are generated at the edges of the screen and reflected back and forth across its surface. When you touch the screen, you interrupt the sound beams and absorb some of their energy. The screen's microchip controller figures out from this where exactly you touched the screen.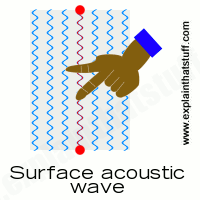
A surface-acoustic wave screen is a bit like an infrared screen, but your finger interrupts high-frequency sound beams rippling over the surface instead of invisible light beams.
Near field imaging
Have you noticed how an old-style radio can buzz and whistle if you move your hand toward it? That's because your body affects the electromagnetic field that incoming radio waves create in and around the antenna. The closer you get, the more effect you have. Near field imaging (NFI) touchscreens work a similar way. As you move your finger up close, you change the electric field on the glass screen, which instantly registers your touch. Much more robust than some of the other technologies, NFI screens are suitable for rough-and-tough environments (like military use). Unlike most of the other technologies, they can also detect touches from pens, styluses, or hands wearing gloves.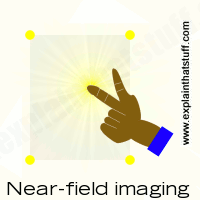
With a near-field imaging screen, small voltages are applied at the corners, producing an electric field on the surface. Your finger alters the field as it approaches.
Light pens
Light pens were an early form of touchscreen technology, but they worked in a completely different way to modern touchscreens. In old-style computer screens, the picture was drawn by an electron beam that scanned back and forth, just like in a cathode-ray tube television. The pen contained a photoelectric cell that detected the electron beam as it passed by, sending a signal to the computer down a cable. Since the computer knew exactly where the electron beam was at any moment, it could figure out where the pen was pointing. Light pens could be used either to select menu items or text from the screen (similar to a mouse) or, as shown in the picture here, to draw computer graphics.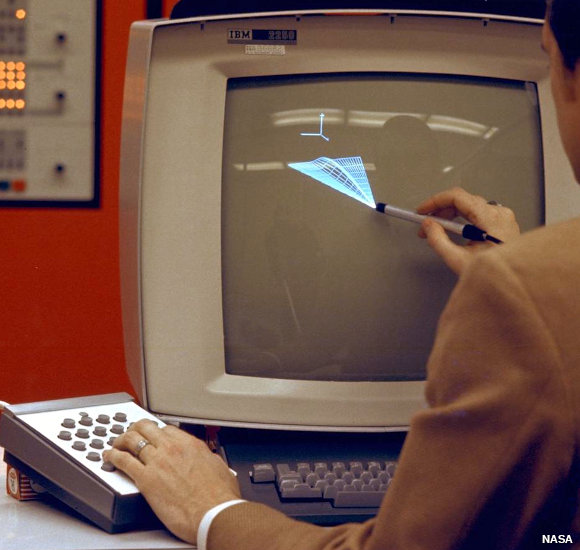
Drawing on a screen with a light pen back in 1973. Although you can't see it from this photo, the light pen is actually connected to the computer by a long electric cable. Photo by courtesy of NASA Ames Research Center (NASA-ARC).
Advantages of touchscreens
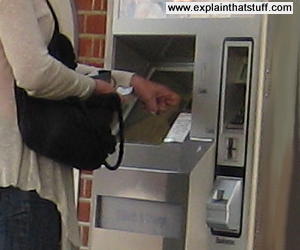
The great thing about touchscreen technology is that it's incredibly easy for people to use. Touchscreens can display just as much information (and just as many touch buttons) as people need to complete a particular task and no more, leading people through quite a complex process in a very simple, systematic way. That's why touchscreen technology has proved perfect for public information kiosks, ticket machines at railroad stations, electronic voting machines, self-service grocery checkouts, military computers, and many similar applications where computers with screens and keyboards would be too troublesome to use.
Photo: Touchscreens are widely used in outdoor applications, such as ticket machines at railroad stations. They're popular with customers, since you can often buy your train ticket more quickly without waiting in line. They're also good news for the station operator, since machines like this work out cheaper than paying a human sales person.
Some of us are lucky enough to own the latest touch phones, which have multi-touch screens. The big advantage here is that the display can show you a screen geared to exactly what you're trying to do with it. If you want to make a phone call, it can display the ordinary digits 0–9 so you can dial. If you want to send an SMS text message, it can display a keyboard (in alphabetical order or typewriter-style QWERTY order, if you prefer). If you want to play games, the display can change yet again. Touchscreen displays like this are incredibly versatile: minute by minute, they change to meet your expectations.
All of us with smartphones (modern cellphones), ebook readers, and tablet computers are now very familiar with touchscreen technology. Back in 2008, Microsoft announced that touch technologies would feature prominently in future versions of the Windows operating system—potentially making computer mice and keyboards obsolete—but almost a decade later, most of us are still locked into our old-style computers and operating systems, and the old ways of using them. Though it could be a while before we're all prodding and poking our desktop computers into action, touchscreen technology is definitely something we'll be seeing more of in future!
Who invented touchscreens?
Automobiles, airplanes, computers, and steam engines—touchscreens belong in the company of these illustrious inventions because they lack a unique inventor and a definitive, "Eureka" moment of invention: in other words, no single man or woman invented the touchscreen.The first invention that bears any kind of resemblance to using a modern touchscreen was called a light pen (featured in the photo up above), a stylus with a photocell in one end, and a wire running into the computer at the other end, that could draw graphics on a screen. It was developed in the early 1950s and formed a part of one of the first computer systems to feature graphics, Project Whirlwind. Light pens didn't really work like modern touchscreens, however, because there was nothing special about the screen itself: all the clever stuff happened inside the pen and the computer it was wired up to.
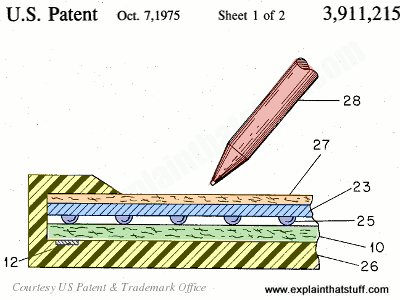
During the 1960s and early 1970s, another key strand in the development of touchscreens came from the work of computer scientists who specialized in a field called human-computer interaction (HCI), which sought to bridge the gap between people and computers. Among them were Douglas Engelbart, inventor of the computer mouse; Ivan Sutherland, a pioneer of computer graphics and virtual reality; and Alan Kay, a colleague of Sutherland's who helped to pioneer the graphical user interface (or GUI—the picture-based desktop used on virtually all modern computers).
The first gadget that worked in any way like a modern touchscreen was called a "Discriminating Contact Sensor," and it was patented on October 7, 1975 by George S. Hurst and William C. Colwell of Elographics, Inc. Much like a modern resistive touchscreen, it was a device with two electrically conducting contact layers separated by an insulating layer that you could press together with a pen. Crucially, it was designed to be operated "with a writing instrument [the patent drawings show a pen] and not by any portion of a writer's hand". So it wasn't like a modern, finger-operated touchscreen device.
Photo: Artwork: Left: This early touchscreen by Elographics was patented in 1975. It has an outer case (26, yellow) and a top contact layer (27, orange) on which you can write with anything you like (28). As you scribble away, you press the top contact layer (blue, 23) down onto the bottom one (10, green) by squashing the small, well-spaced insulator buttons (dark blue, 25). An electrode (12) picks up the contact and uses resistance to figure out which part of the screen you've touched. From US Patent #3,911,215: Discriminating Contact Sensor by George S. Hurst and William C. Colwell, Elographics, Inc., courtesy of US Patent and Trademark Office.
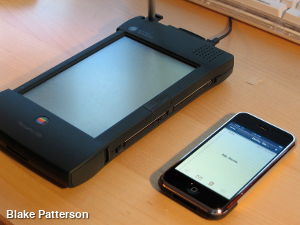
Many people think touchscreens only arrived when Steve Jobs unveiled Apple's iPhone in 2007—but touch-operated, handheld computers had already been around for 20 years by then. One of the first was the Linus Write-Top, a large tablet computer released in 1987. Five years later, Apple released the ancestor of its iPhone in the shape of Newton, a handheld computer manufactured by the Japanese Sharp Corporation. Operated by a pen-like stylus, it featured pioneering but somewhat erratic handwriting recognition but was never a commercial success. Touchscreen input and handwriting recognition also featured in the Palm series of PDAs (personal digital assistants), which were hugely popular in the mid-1990s.
From iPhones and iPads to ebooks and tablets, all modern touchscreen gadgets owe something to these pioneering inventors and their scribbling machines!
Photo: Right: Now that's what I call miniaturization! An Apple Newton from the early 1990s (left) alongside a modern iPhone (right). Photo courtesy of Blake Patterson published on Flickr under a Creative Commons Licence.
X . IIIIII
The Evolution of Touchscreen Technology
Surprisingly enough, the first touchscreen device was capacitive (like
modern phones, rather than the resistive technology of the 1980s and
1990s) and dates back to around 1966. The device was a radar screen,
used by the Royal Radar Establishment for air traffic control, and was invented by E. A. Johnson,
for that purpose. The touchscreen was bulky, slow, imprecise, and very
expensive, but (to its credit) remained in use until the 1990s). The
technology proved to be largely impractical, and not much progress was
made for almost a decade.
The technology used in this kind of monotouch capacitive screen is
actually pretty simple. You use a sheet of a conductive, transparent
material, and you run a small current through it (creating a static
field) and measure the current at each of the four corners. When an
object like a finger touches the screen, the gap between it and the
charged plate forms a capacitor. By measuring the change in capacitance
at each corner of the plate, you can figure out where the touch event is
occurring, and report it back to the central computer. This kind of
capacitive touchscreen works, but isn’t very accurate, and can’t log
more than one touch event at a time.

These touchscreens did, however, proved to be both good and cheap enough to be useful, and were used for various fixed-terminal applications, including industrial machine controllers, ATMs, and checkout devices. Touchscreens didn’t really hit their stride until the 1990s, though, when mobile devices first began to hit the market. The Newton, the first PDA, released in 1997 by Apple, Inc. was a then-revolutionary device that combined a calculator, a calendar, an address book, and and a note-taking app. It used a resistive touchscreen to make selections and input text (via early handwriting recognition), and did not support wireless communication.

The PDA market continued to evolve through the early 2000s, eventually merging with cell phones to become the first smartphones. Examples included the early Treos and BlackBerry devices. However, these devices were stylus dependent, and usually attempted to imitate the structure of desktop software, which became cumbersome on a tiny, stylus-operated touch screen. These devices (a bit like Google Glass today) were exclusively the domain of power-nerds and businesspeople who actually needed the ability to read their email on the go. Google Glass Review and Giveaway Google Glass Review and Giveaway We were lucky enough to get a pair of Google Glass to review, and we're giving it away!
That changed in 2007 with the introduction of the iPhone that you just
watched. The iPhone introduced an accurate, inexpensive, multi-touch
screen. The multi-touch screens used by the iPhone rely on a carefully
etched matrix of capacitance-sensing wires (rather than relying on
changes to the whole capacitance of the screen, this scheme can detect
which individual wells are building capacitance). This allows for
dramatically greater precision, and for registering multiple touch
events that are sufficiently far apart (permitting gestures like ‘pinch
to zoom’ and better virtual keyboards).
The big innovation that the iPhone brought with it, though, was the idea of physicalist software. Virtual objects in iOS obey physical intuitions – you can slide and flick them around, and they have mass and friction. It’s as though you’re dealing with a universe of two dimensional objects that you can manipulate simply by touching them. This allows for dramatically more intuitive user interfaces, because everyone comes with a pre-learned intuition for how to interact with physical things. This is probably the most important idea in human computer interaction since the idea of windows, and it’s been spreading: virtually all modern laptops support multi-touch gestures, and many of them have touchscreens.
What’s Next
Multi-touch screens will probably continue to get better in terms of resolution and number of simultaneous touch events that can be registered, but the real future is in terms of software, at least for now. Google’s new material design initiative is an effort to drastically restrict the kinds of UI interactions that are allowed on their various platforms, creating a standardized, intuitive language for interacting with software. The idea is to pretend that all user interfaces are made of sheets of magic paper, which can shrink or grow and be moved around, but can’t flip or perform other actions that wouldn’t be possible within the form factor of the device. Objects that the user is trying to remove must be dragged offscreen. When an element is moved, there is always something underneath it. All objects have mass and friction and move in a predictable fashion.In a lot of ways, material design is a further refinement of the ideas introduced in iOS, ensuring that all interactions with the software take place using the same language and styles; that users never have to deal with contradictory or unintuitive interaction paradigms. The idea is to enable users to very easily learn the rules for interacting with software, and be able to trust that new software will work in the ways that they expect it to.
On a larger note, human-computer interfaces are approaching the next big challenge, which amounts to taking the ‘screen’ out of touchscreen — the development of immersive interfaces designed to work with VR and AR platforms like the Oculus Rift (read our review) and future versions of Google Glass. Making touch interactions spatial, without the required gestures becoming tiring (“gorilla arm”) is a genuinely hard problem, and one that we haven’t solved yet. We’re seeing the first hints of what those interfaces might look like using devices like the Kinect and the Leap Motion (read our review), but those devices are limited because the content they’re displaying is still stuck to a screen. Making three dimensional gestures to interact with two dimensional content is useful, but it doesn’t have the same kind of intuitive ease that it will when our 3D gestures are interacting with 3D objects that seem to physically share space with us. When our interfaces can do that, that’s when we’ll have the iPhone moment for AR and VR, and that’s when we can really start to work out the design paradigms of the future in earnest.
The design of these future user interfaces will benefit from the work done on touch: virtual objects will probably have mass and friction, and enforce rigid hierarchies of depth. However, these sorts of interfaces have their own unique challenges: how do you input text? How do you prevent arm fatigue? How do you avoid blocking the user’s view with extraneous information? How do you grab an object you can’t feel?
These issues are still being figured out, and the hardware needed to facilitate these kinds of interfaces is still under development. Still, it’ll be here soon: certainly less than ten years, and probably less than five. Seven years from now, we may look back on this article the same way we look back on the iPhone keynote today, and wonder how we could have been so amazed about such obvious ideas.


Tidak ada komentar:
Posting Komentar