
I. Concept and Practice of e- IC ( electronic - Instrumentation and Control )
Instrument is the art of measuring and managing all quantities of a process. In its broadest sense it is the science that socializes all fields of science, physics, chemistry, electronics, and mechanics into a form of science measuring and regulating all changes in the fields of science above or in combination.
Measuring is the process of relating a number of things empirically and objectively to the properties of an object or event in such a way that the numbers can provide a clear picture of the object or event. Measuring instruments used must be related to standard objects that have Traceability that are legalized nationally and internationally.
Factors that influence the selection of measuring instruments:
1. The type of process to be measured.
2. Range (work area) of the process magnitude.
3. Additional functions of the measuring instrument that are desired, for example: recorder, pointer, marker and others.
4. The value of accuracy and accuracy desired
5. Speed response of measuring instruments.
6. Possible dangers of the process.
7. Reliability and maintenance of measuring instruments.
8. Purchase, installation and maintenance costs.
9. The ease of operation.
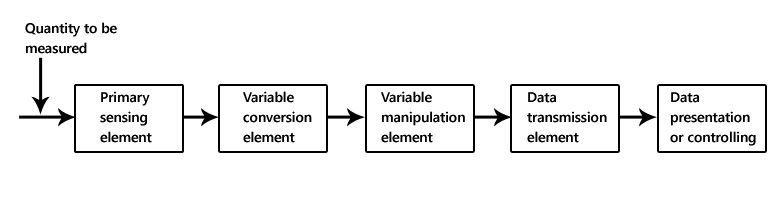
Although each measuring instrument is different both functionally and technically, but in general the measuring instrument consists of the same parts, namely:
1. Primary element (taste)
That is a measuring instrument that converts the measured medium energy to produce a condition that shows the measured price.
2. Secondary element (connecting)
That is the part that changes the state produced by the primary element to a state that is useful for measuring instruments in other separate places.
3. Element manipulation (gauges)
That is the part that changes the state produced by the connecting element so that the results are observed.
4. Pointing element
That is the measuring instrument for transmitting, recording or recording purposes.
MEASURING FUNCTIONS :
1. Transmitter:
2. Giver of the sign:
3. Registrar:
4. Pointer:
5. Recorder:

STATIC AND DYNAMIC CHARACTERISTICS A MEASURING TOOL
STATIC CHARACTERISTICS
What is meant by static characteristics are things that must be taken into account if a measuring instrument is used to measure a situation that is not time dependent. Static characteristics include:
1. Measuring error (Error)
Error is defined as the difference in the measurement price produced at its true price, where the true price is the average variable of an infinite number of measurements and will always change depending on all aspects that influence it. Then it can be ascertained that there will be no measurement that does not have an error, either a positive error or a negative error because between the two do not eliminate each other.
2. Accuracy
Accuracy is usually expressed as a percent of uncertainty. In other words accuracy is the percentage of the close price of the measurement results at the actual price.
3. Accuracy (Precision)
Accuracy is the percentage of nearby measurement results with one other measurement results at the same actual price.
4. Measurement Area (Range) and Measurement Distance (Span)
For range and span at the same time and can even be called the same if indicated by the same lowest value, which is 0. But the difference will appear if the lowest value is not 0 (zero). Example:
• A measuring device that measures in the range of 0 to 100, the measuring instrument can be said to have a range of 100 and span 100. In this case we can say the range and span values are the same.
• A measuring device measures in the range of 150 to 250, then the measuring device has a range of 150 to 250 and has a span of 100.
With the two examples above clearly the span affects the accuracy of the tool, the smaller the specified span the more accurate the resulting measurement results. While the selection of range values affects the span.
5. Readability
Readability is the smallest distance from a designation scale that can still be defined. Most readability that feels the effect on analog measuring devices that usually have a pointer and scale. Digital measurements can usually be compared to how many digits behind a comma.
6. Sensitivity
Sensitivity is a comparison between changes in the size of the output with changes in input to the instrument after the balance is reached.
7 Linearity
Linearity can be interpreted as a close measurement curve for linear lines (straight lines). Normally linearity is expressed as a linear non-tool.
8 Hysteresis.
Hysteresis can be interpreted as the amount of deviation between the output of the measuring instrument when receiving input rising with the output of the measuring instrument when receiving input down.
9 Repeatability
Repeatability is the nearby measurement price produced by a measuring instrument for the same input price under the same conditions, for the same input direction and for the entire measurement area. This is usually measured as inaccuracy but is expressed as a repeatability in the percent span. repeatability does not contain hysteresis even though the data is the same.
DYNAMIC CHARACTERISTICS
What is meant by dynamic characteristics is how much one changes the measurement results to the other measurement results. Dynamic characteristics include:
1. Responsiveness.
What is meant by response speed is the response speed of a device to follow price changes of the measured quantity.
2 Fidelity
Fidelity or strength indicates the speed class and the accuracy of a device following changes in price quantities.
TYPES OF PROCESS MIXES
The following are the types of process quantities that are commonly circulated in the industry, including numbers and the usual costs.
Type of quantity of sum of points
measure costs
1. pressure
2. Temperature
3. flow
4. Surface (level)
5. Analyzer
Furthermore, to get to know more about the magnitude of the process, we must specifically examine one by one because each of them does not have the same basic measurements.
TYPES OF SIGNALS
The measurement results can usually be immediately known by a direct measuring device. Suppose we will measure the length, area or field so that the meter can be used immediately. But in general, currently the measurement results are not read directly, but are sent to other places, both for measurement and for regulation. Therefore we need the right means for delivery, namely in the form of signals. And these signals have been standardized, namely:
* Pneumatic = 0.2 ~ 1.0 kg / cm2
3 ~ 15 PSI
0.2 ~ 1.0 bar
* Electricity = 4 ~ 20 mA DC
1 ~ 5 VDC
0 ~ 10 mA DC
* Digital communication
SETTINGS
MANUAL AND AUTOMATIC SETTINGS
Manual settings
Manual settings are settings that are run by human operators, where everything done in a setting involves the actions of many people, we take one example, for example:
Set the heat-exchanger process so that the water temperature that comes out remains large. The task of the first operator is to measure the temperature and inform the measurement results to the second operator, the task of the second operator is to calculate the measurement error to produce how much heater is needed and then to the third operator and the third operator to turn the heating valve as per the perator second. This happens repeatedly until the desired output temperature of the water is produced.
The first, second and third operator activities include: measurement, comparison, calculation and corrective action. This will continue continuously in proportion to changes in measurement results and changes in the price of desires and thus this is the basic principle of automatic regulation.
Automatic settings
Automatic settings can be defined as a setting technique of a quantity, and that will produce a business so that it can limit the deviation of its measurement to a desired price process.
If we take the example from the manual settings above by changing the tasks of the operators into equipment then the first operator becomes Transmitter as a measuring instrument, the second operator becomes the controller as a counter measure of the deviation of measurement with the desire price and the third operator becomes the correction element or final element. And this is an automatic regulatory system, where human tasks are eliminated by a closed automatic control system.
The purpose and objective of automatic regulation is for production to be obtained more economically. Even today some processes cannot be done without automatic settings. The advantages of automatic settings are:
1. Reducing labor costs
2. Eliminate or reduce human error
3. Enhancing the quality of the results of the arrangement
4. Reducing the size of process equipment
5. Providing greater security to humans
SETTLEMENT SYSTEM ELEMENTS
From the explanation above, it can be concluded that the process arrangement will take place if there is a supporting support, namely the regulatory element. The regulatory elements include:
1 Process (process magnitude)
2 Measuring instruments and transmitters
3 Controller
4 Final element control (usually motorized valves or inverters)
1 Process
The process is a combination of events that occur inside and by equipment where a vehicle will be controlled. Magnitude or circumstances that must be measured and controlled. The magnitude or condition that must be measured and controlled is called the controlled variable, for example: flow, temperature, pressure, altitude and analizer. The magnitude or state of the controller and will affect the controlled variable is called the manipulated variable. This amount is carried or produced by the control agent.
2 Measuring instruments
Consists of the first element (primary element), a transmitter, means of transmission and receiving elements (receiving elements) which are usually located on the controller. The first element converts energy from a controlled variable to another such as a change in pressure, position force, electrical voltage, electric current, etc. by the transmitter, this last quantity is passed to the controller. For a complete measuring instrument explained in the measurement chapter.
3 Controller
A tool that produces a setting action as a function of the input signal error (error signal). This error signal is the difference from the desired price (setpoint) with the measurement results. The comparison process is carried out by an error detector (comparator) and then amplified by the amplifier signal. All of these tools are part of a controller. Sometimes it looks separate, but often becomes one, the type of controller is distinguished by the way in which manipulated variables are generated by error signals. further explained in the controller chapter.
4 Final elements
Equipment that can be manipulated / executed by the output controller to regulate the flow of energy or material into a process. This last element can be shaped: Regulating valve, motor damper, speed change etc.
In addition to the four main elements mentioned above there are some additional elements that are not important, for example: indicators, recorders, alarms, positioners, inverters, adapters, transducers, converters, etc. all of which are indispensable parts in a control loop.
TYPE OF SETUP LOOP
A process management system can be simple or complicated. A simple system consists of one process and one process control loop and for the complicated one sometimes a process requires multiple process control loops (multiple control). but basically there are only three types of setting loops.
1 Open loop settings (programmed)
Open-loop settings are settings where the setting of action does not depend both on the input of the measurement results and from the output of the results of the arrangement. This type of arrangement is based on an estimate of the effort needed to obtain the desired results, so it is basically a forecast. From this prediction a fixed program is made, which does not require checking the process of whether the regulatory business is in accordance with the desired price or not.
2 Closed-loop settings
In the loop settings feedback is input, the setting action depends on the output process. In this system the output of the process is compared to the price of input to the system, so that the regulatory action can be obtained as a function of the output and input. Variables to be set are measured by a meter and the results are compared with the input setpoint, and the deviation between them will activate the automatic regulator to minimize the error. And because the automatic regulator will work if there is an error then to make continuous settings an error price is needed. Further things will be explained in the regulating mode chapter.
3 Setting closed loop (Feed forward)
That is an arrangement where the action of the settings is determined by the input of the process, but does not depend on the output process. This arrangement is the most recent type of arrangement, it includes a type of closed loop where information from input input is controlled by a calculation based on a model of the process (research and experiments) which becomes a formulation of error control and data data is processed by computer. In this type of arrangement it can produce a perfect process if the measurement and data reference calculations are correct.
MODE OF THE SETTINGS
Setting the amount of the process can be done in a variety of ways. This arrangement method states the work of the regulator, namely the relationship of the regulator action with a signal error or error. The number of ways this arrangement is caused by two things, namely:
* Each process requires the appropriate type of regulator to be achieved
good stability in the process.
* Accuracy needed is not always the same in every process.
Mode of arrangement consists of two major groups, namely:
1. Open and close (on - off) settings
2. Continuous settings, which consist of
3. Proportional arrangement
4. Proportional plus integral settings5
5. proportional plus integral and differential settings
The name of the name of this regulator explains the relationship of motion of the final element if the amount set (manipulated variable) changes high or low from the setpoint. So the Variable relationship is manipulated (m) to error (e).
1 Setting open and close (on - off)
Open-close settings are also called two-position settings where this mode is the most used mode in each industry.
This mode setting works in such a way that the output of the regulator (mv) moves from the maximum price to the minimum price, depending on whether the controlled variable (e) is greater or less than the desired price (sp). the equation of this mode is:
m = M1 if e> 0
m = M2 if e <0
Because the variable will be on or off quickly, this mode is usually added to the hysteresis gap system, so the control action is not too fast on and off, the equation becomes:
m = M1 if e goes up and e> g
m = M2 if e drops and e <-g
2 Continuous Settings
Opponents of on-off settings are continuous settings or continuous settings. The arrangement of this mode has three types of elements to determine the continuity of the arrangement, these elements include:
1. Proportional (P)
2. Integral or Reset (I)
3. Derivative or Rate (D)
2.1 Proportional
Proportional mode is a regulatory action where the amount of output from the regulator (manipulated variable) is proportional to the deviation from the measurement of errors. with the equation:
gain = m / e
This comparison only occurs in an area called Proportional Band where the percentage of input changes needed to produce 100% regulator output. And for the price of input outside of the PB it will produce the lowest or highest output.
This can be seen from the equation below:
gain = 100%
PB
m = 100%. e + b
PB
m = output from the regulator
PB = Proportional Band
e = error or input process deviation
b = bias (m = b if e = 0)
The price bias must always be in order for a continuous arrangement to occur, and the bias for pneumatic arrangements is usually 50%, and for electronics the price of bias can usually be set.
The advantage of the proportional setting mode is that the regulator does not affect the behavior of the loop because it does not contain dynamic elements. This arrangement only provides an amplifier that can be set by adjusting the size of PB. The disadvantage is that there are very large offsets in proportion to the size of PB settings.
2.2 Integral or Reset
To overcome the offset that occurs in a proportinal setting, an integral mode is added which will return an error to the setpoint. The operation of the integral is to change the bias continuously so that the offset approaches zero. in the following way:
dm = 1 e
dt Ti
- Where Ti is the integral time or Reset time and this equation
can be written in the form.
m = 1 e dt
Ti
II . APPLICATION e- IC ON Modern Automotive as like as ECU ( Electronic Control Engine )
‘ECU’ is a Three
Letter Answer for all the Innovative Features in Your Car: Know How the Story
Unfolded
Automobiles were seen
as mechanical machines until the introduction of Electronics in Automotive
Industry.
Every component
starting from engine to window, steering, brake was a mechanical component
working on gears and principles of mechanics.
The mechanical systems
had inherent limitations and limited accuracy, which not only caused undetected
failures, but also pose life threats to the consumers.
These limitations
meant that there was a lot of scope for innovation in automotive sector.
This eventually led to
the widespread introduction of electronics across components and systems within
an automobile.
In 1970, Automotive Electronic Control Units (ECUs)was introduced in the automotive
industry and since then, it has played a fundamental role in evolution of
Automobiles from being a completely mechanical to being an electronics dominant
device.
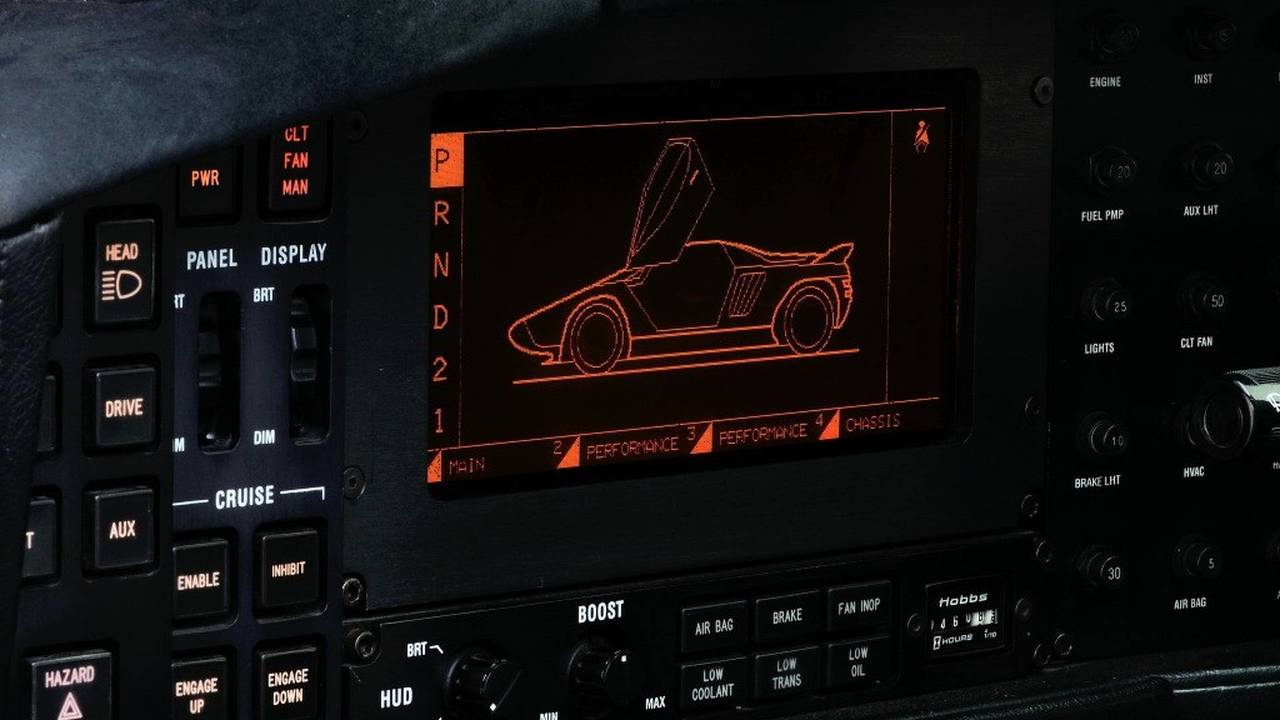
Modern day cars have
over hundred in-built or installed ECUs in them.
Luxury cars like BMW
7-series models have as many as 150 Automotive ECUs to control and regulate the
functions of the car.
Understanding the Functional Difference
between Mechanical and Electronics based control units:

The automotive ECU can
be subdivided into three major categories,
·
Power train Control Module
·
Body Control Unit
·
Chassis System.
Let us consider Engine
control unit which is a part of the Power train Control Module (PCM).
In modern vehicles,
the basic working principle of engine operation is still based on combustion,
only difference is that the process is now controlled by the ECU.
The engine ECU
controls the opening and closing of the input/output valve, by taking input
from the accelerator of pedal of the vehicle.
The engine ECU is also
responsible for the clockwork of the amount of fuel injection and spark
ignition.
In this way, the
Engine ECU results in accurate synchronization, rendering more power,
efficiency and highly functional engines, to the vehicles.
In this way, ECU
controlled vehicles are able to deliver higher efficiency as compared to
mechanical automobiles.
Factors that led the Automotive OEMs’ to move
from Mechanical to Electronic Control Units:
The paradigm shift of
Automobiles from a mechanical machine to electronic system has paved the way
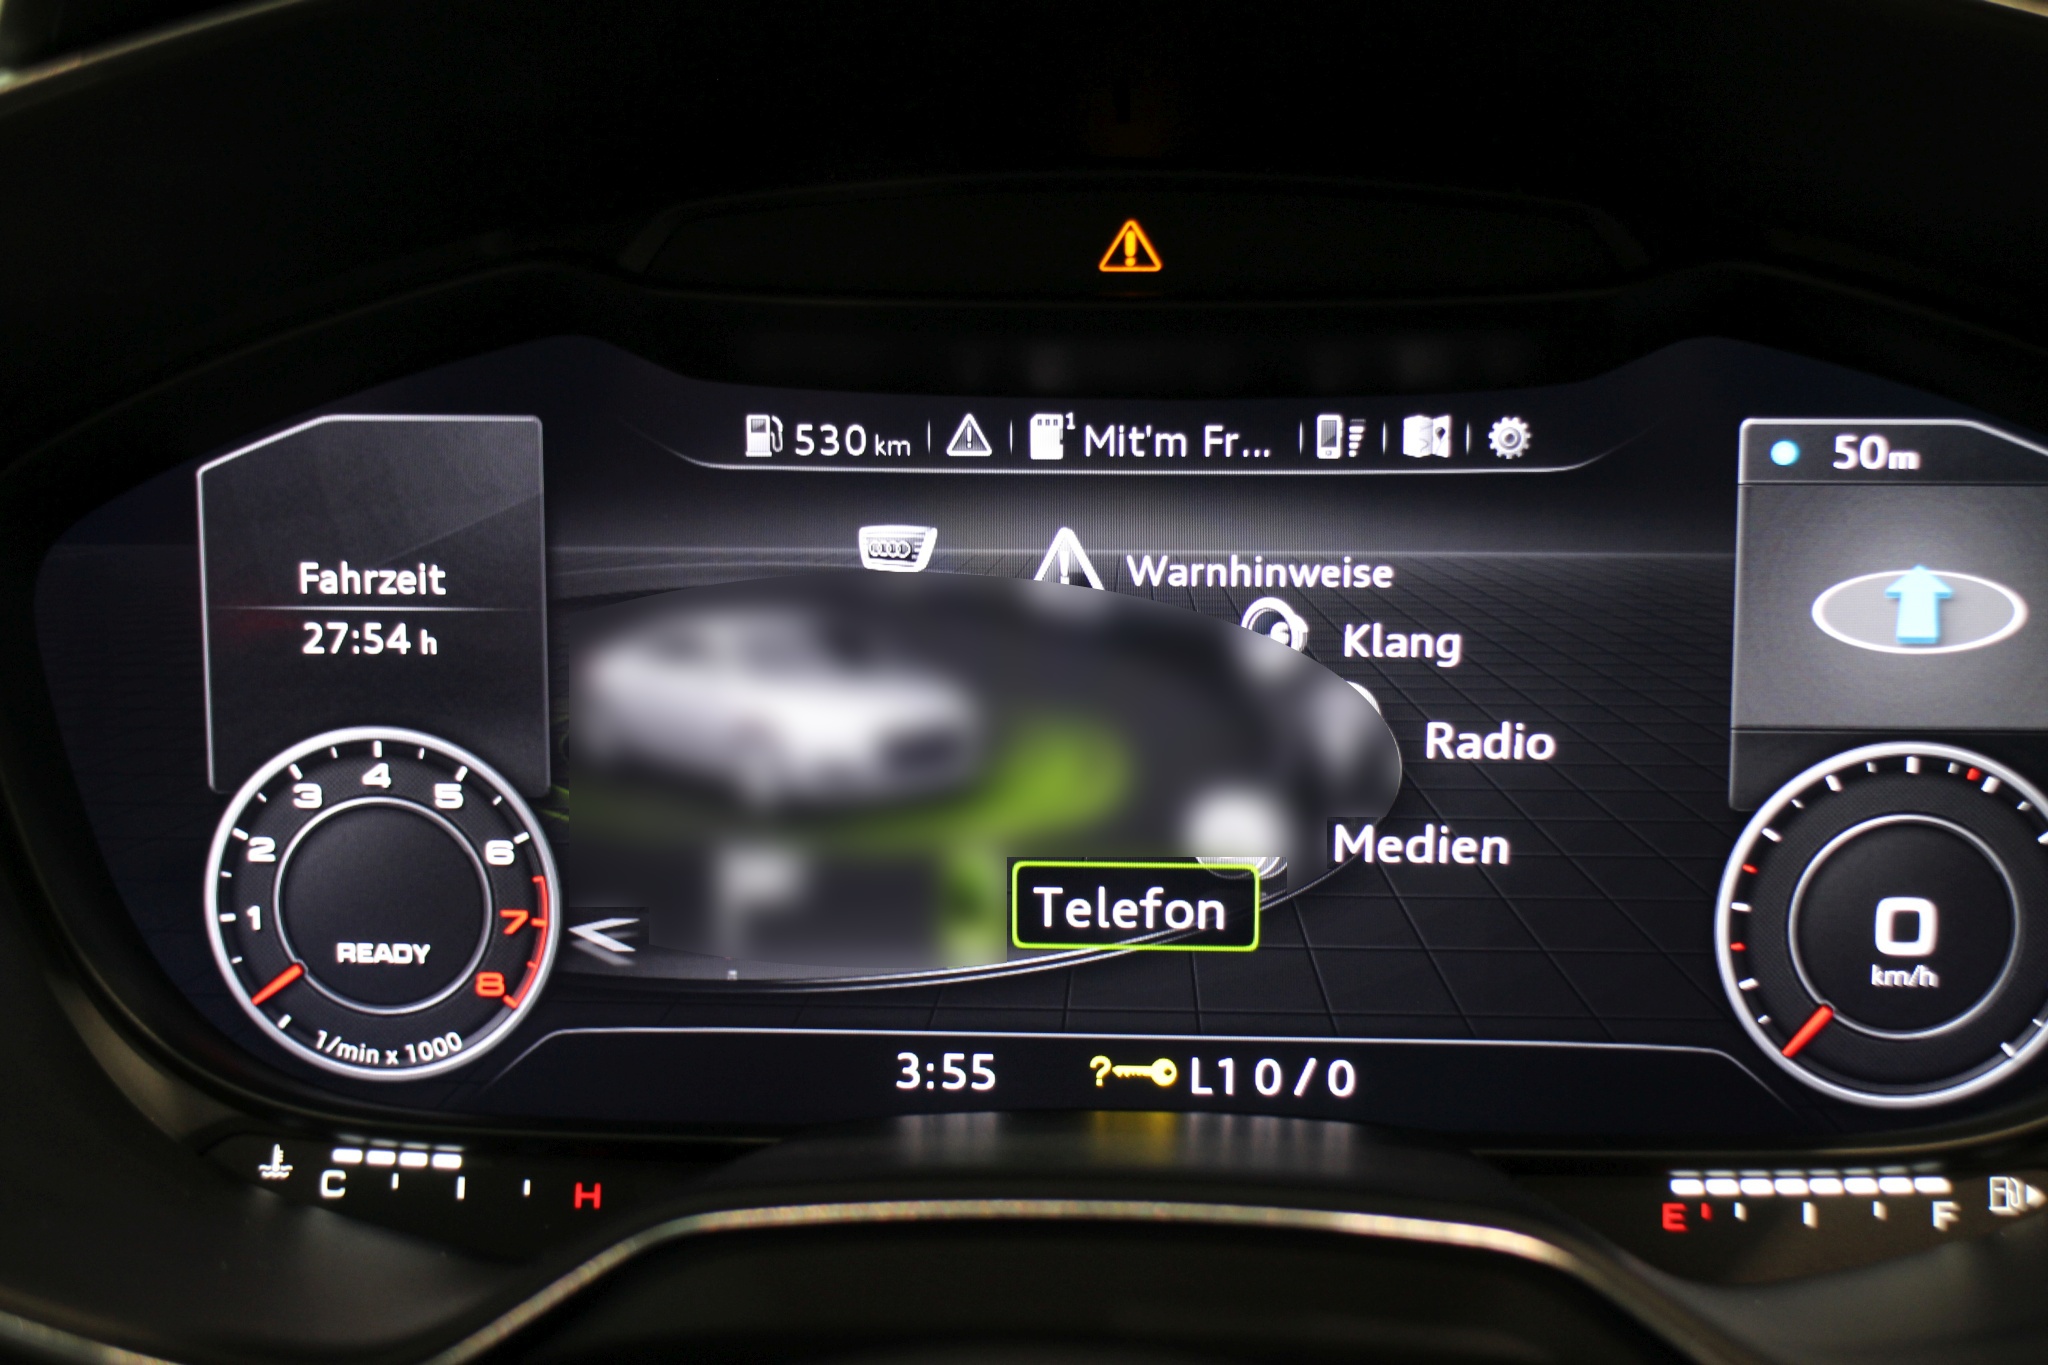
for innovations like power steering, cruise control, infotainment, HUD, in-car
connectivity and mobility.
In modern connected
cars, Automotive ECUs along with LiDAR sensor technology are eventually making
a self-driving autonomous car a reality.
So while in the
hindsight, it is a no-brainer to conclude that the electronics in automotive
has indeed led to favourable results.
But it would also be
interesting to look at the factors that stood out as the factors driving this
change in automotive industry

·
Driver and pedestrian safety:
Mitigation of driver
distraction to ensure safety for both drivers and pedestrians has always been
the top priority for Automotive OEMs’ and Government Regulators.
Some of the OEMs’ like
Volvo have also officially announced their ambitions to reduce the fatality
rate due to vehicles to zero by 2020.
The automotive OEMs’
and Suppliers are able to walk the talk due to the capabilities of the
electronics based control units within the vehicle.
Automotive ECUs along
with image processing algorithms, sensors and camera support a number of
Advanced Driver Assistance Systems (ADAS) like adaptive cruise control, driver
drowsiness detection, lane departure warning, forward collision alert,
pedestrian detection and more
This has been one of
the major driving factors as any compromise with safety would have direct
impact on the very existence of automobiles as the mode of transport.
·
Need for compliance with government
regulations:
Government regulatory
bodies are one of the key stakeholders of the automotive industry ecosystem
As an Automotive OEM
and /or a Supplier, it is mandatory to comply with such region specific
regulations and norms pertaining to emissions, energy consumption, safety and
emergency responses and more
Implementing such
mandates without the use of Electronic Control Units and software algorithms
would have been a mission impossible.
On the other end, due
to emergence of electronic based automation and connectivity with road
infrastructure, the regulators are also able to keep the malpractices in check
and respond in a better way, to emergency situations.
For an instance, to
keep in check the frequency of road accidents due to fleet trucks and also to
ensure adherence to the HOS (hours of service) policy, the U.S. Federal Motor
Carrier Safety Administration (FMCSA) has issued an ELD mandate.
All the fleet
companies have to comply with the mandate by December 2017 by installing
Electronic Logging Device (ELD) in their trucks.
·
Car or a mobile device on wheels :
In the last decade,
since the advent of mobile phones, it became pertinent for car-makers to
introduce connectivity and more electronics within the car
The generation
obsessed with smart devices, web connectivity, ease of navigation, social media
and consumption of information on the go, meant that car had to slowly
transform into a consumer electronics device.
Global OEMs’ and
Suppliers have been able to respond to such a change in customer preference by
allowing the explosion of electronics to bolster in-car mobility and
connectivity.
Investments in R&D
and in-vehicle infrastructure ensured that ECUs’ and in-vehicle networks
(FlexRay BUS) support multimedia systems like Infotainment and HUD (Head-up
Display)
These along with
Telematics applications have opened up a Pandora box of new revenue
opportunities for OEMs’, through value-add after-sales service and remote
diagnostics and maintenance support

Numbers speak louder
than words! And this graph (by ‘statistic ) does all the justice to the influence
of electronics in Automotive.
It also offers a lot
of insights regarding the journey of automotive electronics from 1950 to 2030.
What we see here is
the cost share of automotive ECU
with respect to the overall cost of the car from 1950 to 2030.
From the graph above,
it is very evident that the presence of electronics in cars did not grow
overnight.
It took 3 decades of
technology innovations, persistent R&D in automotive product development
along with other driving factors, when finally electronics contributed 10% to
overall cost in 1980s’.
To be more specific
the introduction of Airbags Control Unit in 1970s and the demand for fuel
efficient cars, also contributed to the rapid growth of electronics during
1970-1980
1990-2010 can be
considered as the best growth years for automotive electronics.
Automotive OEMs’ like
Toyota, Ford and Honda introduced car models with GPS, multimedia (DVD)
players, advanced diagnostics systems, back-up sensor and cameras and driver
assistance systems like pre-collision safety systems,and OnStar module(General
motors car models).
With advanced
technologies like LiDAR sensor
based self-driving cars, Land Rover’s Invisible Car and Toyota’s Hovering car,
it is anticipated that, by 2030 Automotive electronics will contribute 50% of
the total car cost
It is no brainer that
Automotive Electronics is having a dream-run in recent years.
And the way this
story has unfolded, all this seems destined to happen not only for better
driving experience but also for the safer roads of the world!

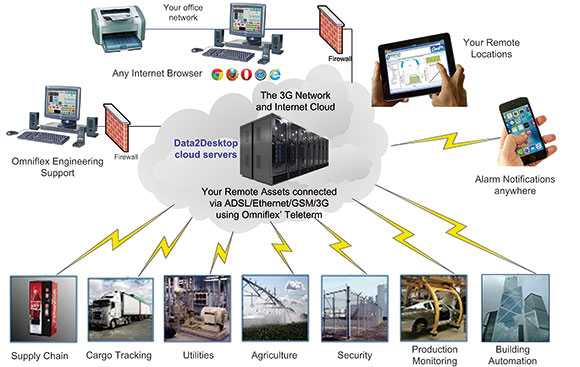
Automotive electronics systems: trends and impact for test and measurement companies
The automotive industry in the United States is steadily
recovering from its worst downturn since the Great Depression. Over the
past three years, automotive-production growth in the United States (and
globally) has been strong and is expected to increase at a moderate
pace from here on out.
When looking at electronic systems or, more specifically, ECUs (electronic control units) for these systems, however, growth is expected to be much stronger. Nowadays, electronics run pretty much everything in a vehicle. Between consumer love of electronic conveniences and hybrid or electric vehicles, the use of electronic systems in the automotive industry is accelerating at a furious pace. Of course, with new technologies come new challenges.
Among the design trends are faster transport buses; more wireless applications, often using a variety of standards; higher switching power, especially when talking about hybrid or electrical vehicles; and the sheer amount and density of electronics in modern vehicles, as shown in the example below.

From a test and measurement perspective, these developments boil down to three major areas that engineers will need to pay more attention to:
- Increasing
demand for more interactive systems that respond real time, requiring
more data to be transmitted at ever increasing speeds
=> implementation and test of higher-speed serial buses - Increasing
complexity and requirements for interoperability, including the
proliferation of RF-enabled functions throughout the vehicle
=> tests to ensure interoperability across analog, digital, serial, and RF data - Increasing EMI challenges, for the “overall system to work with itself,” and to meet EMI requirements
=> EMI debug and test
Serial buses such as CAN, LIN, and, to some extent, FlexRay have a long history in automotive design—each with its own set of advantages and shortcomings. LIN, for example, is very inexpensive to implement but has a maximum speed of 19.2 Kbit/s. CAN, which can handle multiple master devices, is somewhat faster and goes up to 1 Mbit/s; FlexRay reaches 10 Mbit/s but is more expensive to implement. Test solutions including serial bus decode and protocol analysis are readily available.
Less prevalent but increasingly popular in the industry is the MOST (Media Oriented System Transport) standard that currently comes in two variants with either 50 Mbit/s (MOST50) or 150 Mbit/s (MOST150), and BroadR-Reach, an Ethernet variant introduced by Broadcom. As with any new bus, proper transport, functionality, interoperability, and, in some cases, compliance need to be tested. For these applications, a mixed-signal oscilloscope works well since it supports decode, protocol analysis, and compliance test of the various serial data standards.
On the second point: What has been a radio in the past now is an entertainment and control unit, complete with seamless wireless connectivity of your cell phone or other devices. What was a simple steering wheel in the past now is a multifunction steering wheel, adding the ability to control almost everything without taking your hands off the wheel. All this, and more, increases the number of ECUs and wireless functions in a vehicle. It goes without saying that they all have to play nicely with each other.
Interoperability has emerged as a major challenge for automotive design engineers, and RF is now an integral part of that. Engineers need to look at not only analog and digital or serial data signals in the time domain but also, increasingly, RF signals in the frequency domain. Things like tracing the handshake between a radio transmitter and receiver as the communication is established and determining if a Bluetooth radio IC is transmitting when it is supposed to are common tasks that span the time and frequency domain. You now need to look at both domains at the same time. Time domain and frequency domain with time-correlated data are key to determining how one signal affects the other or if there are any unforeseen signal behaviors that might cause malfunctions.
And then there is electromagnetic interference, or EMI. So many things play into EMI, and it is something not to take lightly. And with more ECUs come more wireless functionality and the move toward higher switching power in hybrids and electrical vehicles; EMI is becoming even more important. Testing for potential EMI issues should be an integral part of the entire debug process. Don’t wait until the final EMI certification. Issues that turn up during certification testing are much harder to fix than if they would have been discovered earlier in the design stage.
When looking at the frequency domain, you want to ensure that all signals are behaving as designed and expected. Are there RF signal bursts that have an effect on other signals on the board? Are there any signals or bursts that might cause EMI issues? And if so, how can the RF burst be traced back to its source? By tracing back the RF signal to its source, you can start to eliminate or mitigate undesired signal behavior causing EMI concerns. Since the source of the problem can be in the frequency or time domain, tools such as an MDO (mixed-domain oscilloscope) can make that process much easier. An MDO combines the functionality of an oscilloscope with a spectrum analyzer to allow analysis across both the time and the frequency domain.
For those of us in electronics engineering, now is a great time to become a “car guy.” The use of electronics in the automotive industry is truly exploding with many new and innovative features. Instead of lagging behind the rest of the industry, automotive is at the forefront. Fortunately, the test and measurement industry is keeping pace with support for new standards and breakthrough tools, such as MDOs.

__________________________________________________________________________________
e- IC
___________________________________________________________________________________