Transport Management Systems (TMS)


good case on the TMS :
Get all the elements of your business under control centrally
TMS software focuses on transport logistics and coordinates control of consignments between order management systems, the warehouse, the distribution centre and the drivers.
TMS covers the four main processes of transportation management;
Planning, Execution, Follow up and Measurement.
Our TMS will integrate with routing and scheduling software, use pre prepared route templates or routes can be planned manually from a map display or paperwork.
Load / route details can be uploaded to drivers' phones and proof of delivery returned real time to the transport management system and the customers directly.
Monitor the progress of your drivers, be alerted to possible service issues and pro actively solve them before they become customer service issues.
Understand your productivity and costs, price your services more accurately, spot trends early and produce timely, accurate invoices that your customers will understand.
Benefit your business by integrating your customers and suppliers into our user friendly Transport Management System. Simplify your office procedures, improve the efficiency of your transport operations and enjoy reduced costs and increased profits that will follow.
TrackTrans' Transport Management System enables you to:• Create, export, POD, Price and Invoice all from one package
• Give great customer service, let your customers see the status of their consignments Live online
• View the days progress at a glance through the colour coded diary screen
• Access your TMS anywhere in the world from any internet enabled PC
• In conjunction with our POD android app receive complete signatures, co-ordinates and times
• Link your TMS with your customers ERP/TMS solution, receive live electronic jobs, return real time status and PODs
• All your data backed up and protected on our specialist servers
Order entry
Create complete jobs with references, extra requirements, instructions, dates/times and many other details or, receive jobs from your customers electronically through our EDI Interface.• Manual - Simple and quick to enter essential information
• Ideal for use in conjunction with 'in house' ERP systems
• Maintained Customer, Staff, Vehicle, Subcontractor, collection and delivery address lists cut down key strokes and enhance accuracy
Routing and Scheduling
Table sorting, colour coded diary screens and advanced date/time criteria allow jobs to be organised and scheduled with the minimum of fuss.• Colour coded diaries screen shows live reports of arrivals, problems and completed deliveries
• All tables can be sorted and organised by your criteria
• Organise by area, size of load, date/time, etc...
Load creation
• 'Own fleet' - allocate loads to vehicles, trailers and drivers• 'Subcontractors' - allocate loads to subcontractors
• Communicate load instructions direct to vehicles and subcontractor systems via the TrackTrans 'Message Hub'
Status update/POD
• In-cab solutions allow Driver’s to return POD’s, signatures and other status directly from their mobile phone*. Ideal for ‘Own fleet’ and ‘owner drivers’.• Subcontractors can update status and POD information via a web interface on the TrackTrans 'Message Hub'.
• No systems interface required, just an internet connection and web browser - everyone can cooperate
• For larger subcontractors a simple XML interface to the TrackTrans 'Message Hub' gives 'real time' status and POD information
Costing
• Purchase orders – send the agreed rate for jobs along with the job information• Self Billing – costing system uses purchase orders to pre approve third party invoices
• Purchase logging – record purchase invoices on arrival at your premises before distribution to the operators. Eliminate nasty surprises.
Accounting
• Price jobs and Invoice customers by date, batch reference or purchase order• Prepare detailed schedules to support summary financial invoices
• Optional integration with QuickBooks
• Integrate working time information with your payroll system
Reporting and Searching
• Search by dates, address, driver or any other aspect of a job/load• Custom reports – Choose your own headings and report on any aspect of a jobs status. Reports received in spreadsheets format to allow full editing and manipulation
Special reports for:
• Progress chasing – check for status and POD information against ETA’s and ETD’s
• Subcontractor costing and Gross Profit details
• Vehicle, trailer and driver utilisation
• Unpriced, un-costed and un-billed jobs
Working Time and Hours recording
• Record working time against drivers and extra men.• Record warehouse hours against customers/warehouseman and invoice out with other work
• Holiday book allows annual leave, sickness, maternity leave etc. to be recorded. Holiday chart lets you view leave/sickness at a glance and plan for potential staffing shortfalls and
Administration
Maintains lists of:• Users
• Contacts
• Employees
• Vehicles, etc...
System Architecture
• SQL database backend• Browser based application
• Android, iOS and Windows compatible apps for handheld smartphones
• 'Message Hub' XML based
Service Options & Charging
Need to collect your PODs in real time but think the cost is too high?
A lot of people think that a real time Proof Of Delivery system is expensive, but with TrackTrans that isn’t the case.Proof Of Delivery is now a real possibility, even for those who are on a limited budget. Our new, electronic POD app offers a real alternative to the traditional paper based systems.

All you need to do is download the TrackTrans proof of delivery app onto your Android, iOS or Windows mobile phone and you’re good to go. Installing the software onto a compatible smart phone is fast and easy, and it's a simple process to go from running one handset to one hundred.
Our real time Proof Of Delivery app is designed to run alongside our Transport Management System (or interface to your existing TMS). It allows jobs to be sent easily from your TMS to the drivers mobile quickly. Drivers can then access full details including the address, references, quantities and instructions.
Free up your office staff - have your drivers and subcontractors enter POD's themsleves - Real Time
The TrackTrans electronic POD system gives you:
• live updates on arrival and waiting times
• Instant confirmation of deliveries or problems
• POD's complete with names and signatures
• Realtime updates on Vehicle Location
Are your phone bills too high?
Do you find yourself repeatedly spelling out addresses over the phone?
Do you feel there should be an easier way?
Data communication with TrackTrans could be the answer you're looking for.
The TrackTrans app ( Android, iOS, Windows ) allows jobs to be sent, quickly and easily, from your TMS straight to your drivers' mobiles.
As well as full address details, references, and quantities, instructions can be added easily and sent to the drivers' handsets.
Receive instant acknowledgements from your drivers for the jobs sent to them.
Designed to run alongside your existing Transport Management software (or TrackTrans' Transport Management System).
Simple and intuitive to use, drivers quickly get accustomed to using handheld devices, saving time, money and hassle.
Satellite Navigation & Traffic Alerts
Sygic the best in offline Satellite navigation - fleet version with road restrictions
 Reliable offline app, no internet needed
Sygic GPS Navigation is an offline navigation app.
This means that all the important stuff like maps, millions of points of interest and software for route calculation, are all stored on the phone.
So even if there is no mobile internet you can count on Sygic to guide you to your destination.
 High-quality maps & Free updates
Great navigation takes accurate and up-to-date maps.
Because roads are constantly changing Sygic offers frequent map updates at no additional cost.
Sygic provides the latest maps from premium providers.
Sygic GPS Navigation is the right app for your next trip.
 Turn-by-Turn voice guidance
Sygic GPS Navigation will find the best route for you, whether you are driving or walking.
Each mode offers convenient directions specifically tailored for drivers or pedestrians.
You will never get lost again and always get to your destination as quickly as possible.
 3D buildings & landscape
A precise map is not enough to find your bearings easily in an unfamiliar city.
3D landmarks, buildings, parks, mountains and valleys, and smooth map movement.
Driving with Sygic GPS Navigation is both practical and enjoyable.
Warehouse Management - WMS
Goods Inwards
• EDI - receive data from supplier systems via the TrackTrans 'Message Hub' - simple XML interface. Create pre-advices for manpower and space planning
• Manual - Simple and quick to enter essential information
• Customer, Supplier, Stock codes, Packing units, SKUs, Serial numbers. etc...
• Bar Codes - Scan goods in using supplier bar codes or prepare goods in labels with system generated bar codes
• Holding area - unload directly to a holding area for quick turnaround and accurate checking and labelling
Put Away
• Stock locations - all pallet locations and stock holding areas defined with system generated bar coded location labels
• Pick bays replenished first in put away process
• Optimise Locations - Goods directed to vacant locations according to speed of throughput and proximity to pick bays
• Integrate replenishment with the put away process - utilise the return leg of the fork lift movement for pick bay top up and location management
Picking
• Multi task picking - pick lists for different customers can be run concurrently
• Pick bays - used to manage break bulk quantities and pick lists prepared to use bins before breaking boxes or pallets
• Pick lists - optimised to reduce picking tasks to the minimum and to maximise productivity
• Stock rotation - stock utilised on a 'First in, First out' basis. Can be overridden if other factors need to be considered
• Line picking - pick orders directly during the unloading process
Goods Out
• Shipping labels - produce shipping labels and record consignment weight and dimensions
• Scan out - confirm loading of consignments with scanning of shipping labels, overscan to consolidate shipping labels
• Create Consignments in TrackTrans TMS
• Manage Delivery process to final consignee with Proof Of Delivery
Stock Check
Blind scan of stock by:
• Customer
• Area
• Range of locations
• Entire warehouse
• Scan results compared with 'Book' stock figures and reconcile variances
• Facility to update stock with 'actual' figures and maintain an audit trail of all adjustments
Accounting
• Invoicing - Prepare detailed schedules to support summary financial invoices
• Integrate working time information with your payroll system
Management reporting
• Stock reports
• Empty locations
• Pick bay replenishment requirements
• Enquiries - on all aspects stock movements
Administration
Maintains lists of:
• Customers
• Locations
• SKU's
• Employees
• Users, etc....
System Architecture
• SQL database backend
• Browser based Java application
• C++ for WiFi handheld devices
• 'Message Hub' XML based
Service Options
• Hosted service on a 'Pay as you go' basis - no up front costs - no long term contract
• Licensed to run on your hardware
Messaging - EDI
Consignment information, status and Proof Of Delivery (POD) updates
Connecting consignors and consignees with all the transport contractors in their supply chain
The Message Database is the TrackTrans integration service that communicates consignment data between transport contractors in a supply chain. End to End visibility of consignment movements in the delivery process enables the performance monitoring and management that delivers reliable and dependable service
Outputs:- Consignment Information
Inputs:- Status and Proof Of Delivery (POD) updates from the hub
Outbound
EDI – send consignment data from your existing systems via the TrackTrans ‘Message Hub’ – simple XML interface.
TrackTrans Integration services ensure that all the necessary data is collated and transmitted to the transport contractors.
Simple connection to the TrackTrans TMS if a disposition module is required to enhance the capabilities of the existing system.
Project Logistics
Internet based, no start up investment, no long term contract.
Deploy a complete management and visibility solution for all contractors on your project.
Set up
All the TrackTrans software is multi language - if we don't have the language you need, it can be made available in a few days
Training
Full step by step guides and flash videos are available for downloading
Implementation
Use whatever TrackTrans products you need in different locations:
• Warehouse management
• Transport management
• Vehicle Tracking
• Messaging
• Proof Of Delivery
Reporting
The TrackTrans databases have integrated report engines for user defined reporting. Data can be exported in a variety of formats (.csv .xls(x) etc......)
Support
24 hours a day, 7 days a week, 365 days a year and all hosted in a secure Tier3 facility
Working Time
Working Time compliance made easy
Follow the simple instructions to create users and start recording right away.
Gives drivers their own sign on and allow them to complete their own timesheets remotely, via the internet.
Download all your information for a given period to an Excel spreadsheet.
Go a step further and download our simple and easy-to-use handheld software and record drivers hours in real-time.

Choose a vehicle tracking system that fits your business and improves your performance.
Benefits: • View all your vehicles from any computer in real-time
• Track your employees, vehicles and goods
• Have the ability to update your customers accurately
• Make better decisions when allocating jobs
Properly managed, delivery staff can be your company's biggest asset.
Without it they could be your biggest liability
Map displays showing:
• The position of all your vehicles refreshed every 10 minutes.
• The complete route for a specified vehicle on a specified date.
• The current position of a specified vehicle on demand.
See exactly what your vehicles and drivers are doing with TrackTrans.
It costs less than you might think, while reducing your operational costs and enabling you to provide an unparalleled service to your customers.
Specification
The vehicle tracking service is Internet based, all you need is a PC, an internet browser (Microsoft Internet Explorer, Mozilla Firefox etc...), and a broadband connection. No complicated installation to maintain; a ‘home spec’ PC bought and supported locally will be more than adequate.
• Time limited access to the displays for customers and the emergency services.
• Data kept for twelve months with the option to archive to DVD.
• Printed reports of all the data and the map displays are also available
XXX . V Logistics Strategies for Business
 the solution of study case logistics :
How to Develop a Winning Logistics Strategy
For any company that is in the business of providing a variety of products and services to costumers, it is of crucial importance to the health of that business to implement a logistics strategy that will help keep service levels at their highest at all times, no matter what changes might be happening in other areas of the business organization. This is an even bigger imperative for companies that are more complex in structure, or that may have a very fluid or fluctuating supply chain, or that have specific product lines, specific countries or specific customers to cater to.
the solution of study case logistics :
How to Develop a Winning Logistics Strategy
For any company that is in the business of providing a variety of products and services to costumers, it is of crucial importance to the health of that business to implement a logistics strategy that will help keep service levels at their highest at all times, no matter what changes might be happening in other areas of the business organization. This is an even bigger imperative for companies that are more complex in structure, or that may have a very fluid or fluctuating supply chain, or that have specific product lines, specific countries or specific customers to cater to.
But what exactly should logistics professionals focus on to improve their business’ effectiveness? Should you spend more time identifying structural improvements to increase speed of production? Should you focus primarily on minimizing logistics costs? Or should you first spend more of your focus on identifying the best high-level organizational objectives and determine whether your overall logistics strategy contributes to that objective? Which tactic is right for your business and in what circumstances?
To help you evaluate your choices and even come up with some new ideas, we’ve asked a panel of logistics strategy experts the following question:
“What’s your top tip or idea for a new business (or even an established organization) looking to create or improve their logistics strategy to make it more effective?”
We’ve collected and compiled their expert advice into this comprehensive guide to effective logistics management strategy. We hope it will help you maximize your company’s logistic resources and ultimately take your logistics strategy to the next level.
1. we also championed the concept of applying logistics technology to all aspects of supply chain management, from the largest ERP systems to the smallest SaaS solutions. When it comes to an effective logistics strategy . go to start practicing demand-driven logistics if you have not already done so.
The importance of better matching demand for your products to your supply goes far beyond reducing your transport spend.
When a company begins practicing inbound logistics or demand-driven logistics, transportation costs are reduced but the savings of replacing inventory with information, and providing better customer service to your customers, is even more important.
Beyond that important result, aligning your business to practice demand-driven logistics moves logistics management out of the functional silo and provides strategic benefits to the entire enterprise .
2. we are constantly monitoring the pulse of the supply chain industry for leading edge trends and best practices that Supply Chain Visions can bring to their clients. I can share with business professionals looking to create an effective logistics strategy…
Comes from many years working as a consultant to companies in the warehousing and supply chain areas. It is a rather simple, and extremely effective approach that is way too frequently overlooked, misunderstood, or simply not well executed.
New and existing companies should take time to understand the essence of Sales and Operations Planning or S&OP. Many times I see companies who “think” they know S&OP, and some who practices a form of S&OP without actually naming it. But I don’t see a lot of companies practicing it effectively.
S&OP simply defined is a strategy where all of the primary functions (Sales, Marketing, Product Management, Manufacturing, Warehousing, Procurement, Finance, Transportation) of the business come together as a team (face to face or via a communications link) to review, discuss and plan business activities. Note here that it does not simply include Sales and Operations, but must include all parties who impact, or are impacted by, the regular activities of the business.we all understanding a common set of goals (customer satisfaction, profitability, improved sales, etc.), and agreeing to work together to achieve those goals. The meeting should be held as frequently as practical, and the team should have a set of tools, KPIs and reports, to assist in regular checkups and notifications. Meetings should be focused and short, they should be about cooperation and strictly avoid confrontation. Yes, we will discuss what went wrong, but with a focus on the “why” and “how” of improvement and eliminating the issue. It should be more about planning for what is coming in the short and long term, and how the team will address it.
There must be commitment by all parties to move past the functional silos that continue to haunt companies. It must, over time, become an ingrained component of the company’s culture.
Properly executed, a solid S&OP process can do more than any other single logistics strategy to improve the odds of success. Once the “team” is in sync, the individual functional areas can turn to focusing on how to most effectively address their part of the process, understanding fully what the goals are.
Without S&OP it has been proven that most functions will create their own goals, but they are likely to not be aligned with the rest of the business. For example; A DC achieving a high fill rate for customer orders may not be good for the business if doing so comes at a high cost to the rest of the business. S&OP can help ensure that all of the logistics related activities are tuned to getting the highest fill rate possible in the most economic and efficient manner.
3. we have to various logistics positions of increasing responsibility in inventory management, order processing, and transportation and distribution center operations management . the solution we must is to acquire an experienced logistician who has great interpersonal skills, is well connected to the logistics/supply chain world (a CSCMP member of course!), is a proven leader, and has solid financial acumen.
4. this now the
international companies on Logistics and Supply Chain projects in all sectors including pharmaceutical, retail, automotive, high technology, food, drink and professional services .
Logistics and supply chain strategy can be summarized as the operational execution of the business mission.
So firstly understand the business mission, reflect on the Corporate strategy of the organization and plan accordingly. Secondly, recognize an “average” supply chain means 50% of customers are sick of your service and 50% you are spending to much money on! A focused competitive strategy is required so liaise and discuss with the marketing and sales functions of your business. So you need to segment your customers and products so that you can develop individual supply chains to create maximum value at the lowest possible cost for each of these groups. Thirdly, now for a supply chain strategy to really work, four areas need to be designed.
Your supply chain processes, the supply chain infrastructure including where you locate facilities and also what equipment is used, your supply chain information systems, and finally the supply chain organization. This is how you organize your people.
So in summary, start with the corporate strategy, identify how you compete in various markets and understand the competitive strategy, develop the supply chain strategy to serve these markets by tailoring your Supply Chain Processes, infrastructure, information systems and organization and people.
5. The most important idea about a business’ logistics plan is…
that it should always be subordinate to corporate strategy. For example:
- If your company’s strategy is to always be the low price leader, then the prime goal of the logistics strategy is to move stuff at the lowest possible cost.
- If your corporate strategy is based on agility and the movement of goods faster than competitors, then logistics strategy is based on speed rather than cost.
- If your company sets the standard for quality, then the logistics goal is to have100% perfect orders and to do whatever it takes to correct any error.
- If your company is growing by merger, one logistics strategy is to integrate the operations of the new acquisition into the existing logistics program.
- If your corporation is judged by its return on invested capital, then the logistics strategy is to remain as free of assets as possible by finding short term leases for warehouse real estate and transport equipment.
6. for creating an effective logistics strategy is…
First define what you are trying to accomplish, what goals you are trying to achieve. Your logistics / supply chain strategy supports the goals of the business, so your supply chain strategy must align with and help achieve the organization’s goals. The second step is to articulate how the supply chain strategy works to achieve the higher level goals.
For example, if speed to market is a goal, the supply chain strategy will look different than one where the goal is to be the low cost supplier.
7. When it comes to any company’s logistics management strategy…
There is a critical need in today’s hyper-fast, online environment to meet the expectations of clients. Finding a faster, more efficient means of handling products is important for supporting a successful organization, and a well-run supply chain is vital to the success of a business. Starting with a great solution or upgrading the supply chain management system is essential in order to compete and can provide a substantial boost to productivity. The potential for supply chain disruption comes from unexpected weather, natural disasters, political upheaval, economic crises and other “black swan” or unique events that can ruin a start up and cripple an existing business.
The most important tip in mitigating the potential negative outcomes of supply chain disruptions is doing effective and careful pre-planning. Benjamin Franklin said, “An ounce of prevention is worth a pound of cure.” That quote absolutely applies to supply chain logistics. Each company has a special “finger print” with its products; some are sensitive to spoilage, some are fragile electronics and others require more human labor. In order to react swiftly and decisively, a plan supported by the right solution is critical to an organization. With corporations, suppliers and manufacturers situated in different parts of the globe, you need technology that can link everyone together in a way that provides consistency, streamlines processes and enhances visibility to meet challenges in real time. A business is only as successful as its supply chain. Pre-planning now and elevating this to the executive team in an organization today can eliminate the majority of customer service issues tomorrow.
Finding the right solution can be game-changing in today’s frantic, uncertain market. Potential problems lie within mismanaged warehouse processes, inadequately tracked fleets and their inventory, scattered inventory, lackluster transportation management or some other supply chain conundrum.. Many warehouses handle massive numbers of shipments every year and in an economy that has seen less frequent hiring of additional help, much of the focus has been placed on maximizing the potential of the workforce. Having fewer hands to help receive and move shipments places an increased premium on accuracy and speed. This applies closely to organizations that deal with perishable and time-sensitive products, such as food, beverages or anything that involves the cold chain. Within these organizations, careful tracking of shipments is essential.
Many organizations still rely on “tribal knowledge” for this sort of information, but even the best memories fail. Manual processes tend toward error, but a system that centralizes information and helps automate the supply chain provides a level of support and real-time access to information that can help a business reach its maximum potential with minimum investment of time, planning and solution implementation.
Planning for the future with innovation is the key, whether it’s through whipping your company fleet into shape with fleet management software, keeping close tabs on product through inventory management solutions or maximizing every square foot of space with improved warehouse management. Innovation is hitting the market as solutions centralize data and provide real-time access to what you need to know, whether you’re in the office, down the street or several continents away.
Technology is linking vendors to customers and customers to shippers through an interlinked web that promotes the sort of fast, adaptable response that sets a business ahead of its competitors. Today’s logistics is mobile-enabled, connected and requires much more than the pencil-and-clipboard style of management from years past. Google CEO Eric Schmidt has said the world now creates as much data in a span of 48 hours as all of human civilization managed to produce from the beginning of history until 2003. Planning and leveraging that Big Data to better understand and propel a business means building a sustainable future.
8 . logistics management explain has included transportation planning and process management, engineering, continuous improvement and Transportation Management System (TMS) process design and integration.
The best idea I can share with business professionals for better understanding how logistics strategies work is…
Logistics strategy is the science of evaluating the most cost effective methodology of distributing goods to market while achieving service level objectives. When establishing an effective logistics strategy, you need to understand to what degree logistics impacts your operations and your customers’ operations. How crucial is timely delivery to your inbound and outbound deliveries, and what constraints exist, such as budget, resources and existing network of providers. If you choose to outsource your logistics operations, make sure you use an organization that will work with you hand-in-hand to co-manage your logistics, so that you keep all your front-line carrier relationships and control. Work with an organization that doesn’t see you as a “project” but as a “partner” who will share with you their best practices and understanding of emerging trends. This partnership-type relationship ensures success within your logistics operations.
9. in future at the opportunity to work in virtually every logistics vertical including CPG, Automotive, 3PL/4PL, Manufacturing, and International Freight Forwarding.
One of my most important tips for maximizing the effectiveness of your business logistics strategy is…
Focus on your competencies. Many companies think they need to “do it all” when it comes to logistics, but in reality there are many options available to organizations that are looking to develop effective and efficient logistics processes. Depending on the complexity of your reader’s shipping needs, for example, in some cases it may be easier to outsource logistics domestically to a 3PL or a global freight forwarder. And, even start ups that lack established IT departments can create effective logistics strategies by using an affordable SaaS-based transportation management solution (TMS). These platforms allow organizations to plan, execute and track freight without the concerns of managing software applications and computer hardware.
10 . come on focused on creating consumer-like business applications that make it simpler for businesses to run their company.
The best way to increase the effectiveness of your logistics plan is through…
Utilizing the technology available to you. My own company, Lettuce, has innovated a way for small business owners to cut costs by consolidating the entire sales, processing, accounting, inventory, forecasting, fulfillment and shipping process into the click of just one button – let that sink in a bit. It’s taken a task that spans across multiple departments and translated it into a single click.
Tools like this are what I think are essential for maximizing your logistic process. Lettuce is an inventory management program accessible via the web portal and iPad app, cuts out the middle man and eliminates repetitive data entry, saving businesses money by cutting overhead costs and brings in more profit by allowing salespeople to secure more sales because they’re not wasting time with back-end order processing. Not to mention it helps small companies go a little bit greener (like Lettuce) by replacing pen and paper, the traditional sales method, with an iPad. Companies can utilize this app to create instant digital catalogs, validate credit card info on the spot (perfect for trade shows), calculate shipping charges, sync with QuickBooks, forecast inventory needs and give wholesalers 24/7 access and ordering capability, slashing countless hours off the back-end fulfillment process.
11. When it comes to creating an effective, yet realistic, logistics strategy…
Plan to give the decision away.
I don’t mean that you have to use a 3PL or necessarily outsource your logistics in any way, but if you are an executive of your company, no matter how small, then make plans now to intentionally stay away from the logistics decision making. Smart executives hire smart managers to take care of inefficiencies in logistics and information flow, and then stay out of the way. Dumb logistics are sometimes the result of bad spreadsheets and bad logic, but that’s only a symptom of the disease. The real cause of dumb logistics is internal company politics. The “people with influence” want this or that, and the logistics get hammered. Spend your time making sure that your logistics managers, whether in-house or outsourced, are both (1) totally on-board with how logistics supports your strategy, and (2) totally empowered to make decisions without asking permission. You have bigger fish to fry.
12. 1 way to increase the effectiveness of your logistics strategy is to…
Have absolute clarity on the purpose of the logistics function in the organization. Investing in developing and clearly articulating the vision of logistics in support of the overall operation are foundational steps in defining optimum logistics strategies.
13.
When it comes to logistics planning and strategies…
Within the supply chain, there is the constant challenge to optimize service and cost performance. There are more tools and challenges than ever before; but at the end of the day, for supply chain professionals, it’s all about delivering low cost and great service. To accomplish this, companies need to gain end-to-end visibility of their network and analyze service and cost performance. It starts with building a solid transaction and information foundation. Often this means partnering with a third party logistics provider (3PL) who has the people, processes and technology needed to execute, gain visibility, track and report cost and service performance.
Secondly, companies need to make sure they have the right people planning, executing and optimizing their transportation network. Do you have a team of transportation professionals with a mix of real world experience and solid academic and analytical skills? Are they trained in Lean or Six Sigma? Can they communicate? Communication is critical across the supply chain – to internal stakeholders, customers, suppliers, carrier partners or others in the industry – and managing those relationships.
Once you have a solid base of information, you need to analyze the data then optimize their freight. There are two levels of optimization: strategic and tactical. Strategic optimization looks at procurement processes, mode selection and overall network design. Tactical optimization is considering if you’re using right carriers, if deliveries and pickups on-time, etc. Shippers need to analyze cost of service daily to see where they’re having carrier performance or other service issues.
The next step is reporting and continuous improvement. You’ve built that solid foundation of data accuracy and visibility and have the right team in place and made changes to optimize your freight; then it’s time to report track and seek continuous improvement. By creating executive dashboards and actionable reports, quarterly business reviews, and continuous ad-hoc reporting it’s possible to examine trends over time and how you’re trending versus a prior period.
Gaining visibility and leveraging the data can help companies identify opportunities to take cost and inefficiency out of their supply chain. Logistics should to be a resource to the entire company and help the organization meet its strategic objectives and drive value for shareholders and customers.
14 . the logistics transportation must be the best trained employees and arms them with brand new technology that combines vast operational experience with the latest advances in optimization and applied probability sciences.
The most important tip I can share with logistics professionals…
Would be to always remember your core competency. Focus on it. Ingrain it into your culture. Then, align your logistics strategy around that competency, and segment out your products, customers, and vendors.If your company is renowned for producing an industry-leading product, then focus on the innovation, quality and consistency that your customers expect. Your supply chain / logistics strategy should have a high-touch, value adding service component that keeps quality high.
If your product is commoditized and price is the only thing that differentiates you from your competitors, your supply chain / logistics strategy should focus on economies of scale and innovative ways to reduce waste.
Customers can then also be segmented by level of “importance” — focus on the ones that impact your business the most. These customers may or may not be the largest ones in your portfolio in terms of revenue. They may be middle of the pack customers who are collaborative and drive improvement in your business that can be replicated across other customers. Prioritizing these customers should be part of your logistics strategy.
Vendors can also be segmented by level of “importance” and again, it’s the collaborative ones — the ones that will work with you to improve your business and grow together — that you should include in your supply chain strategy.
Often times, start-up companies will try to differentiate themselves and win business by providing high levels of logistics service. If this is part of your strategy, then you know you have several options, from operating your own fleet to paying for premium service from an asset based or non-asset-based 3PL. This is why it is important to first understand your core competency. Are you a transportation company? Then yes, you should probably operate your own fleet. Do you make the best damn cupcakes in North America? Maybe you would consider outsourcing logistics…
Now, if you don’t want to be at the mercy of a logistics provider that treats you as the “little fish in a big pond,” one approach might be to seek a longer-term, contractually bound, collaborative relationship with a 3PL. By entrenching yourself into the 3PL’s business, a small or medium-sized start-up company encourages the logistics provider to invest in network development and build its capacity around the start-up company’s market. It’s the long-term commitment that builds stability for both the shipper and the carrier. With a strong collaborative relationship established, you can then work with the 3PL for additional value-adding and differentiating services down the road, such as custom software development, reporting and analytics, etc
15 . One of my most important tips for maximizing the effectiveness of your logistics strategy is…
Begin and end with customers and how they use your offerings! Logistics is about optimizing costs while providing outstanding service. And, not all customers are created equal! A segmented logistics strategy that considers the requirements of your most valuable customers first and designed accordingly wins! Business is about growing exceptional current results while building a strong base for the long term. Logistics is the capability that can orchestrate all of that to happen, by starting with an intimate understanding of product and service needs of every customer segment and linking them to the steps that provide breakthrough satisfaction to customers. Logistics is the external link between suppliers, production, customer interface, and results. It is the internal link between product development, marketing, sales, procurement, production, finance, and executive leadership. An effective logistics strategy will contribute to the financial health of the company and fuel its growth. When it starts with customer segment needs and expectations and understands the value you create for the customer, only then can it produce exhilarating customer response through delivery of knockout value.
16 . The truth about logistics strategy is that…
An effective logistics strategy at its core, is nothing more than the process of moving and positioning inventory to meet customer requirements at the lowest possible total cost to serve. For a business leader, it’s their responsibility to design and administer a system to control the flow and positioning of materials to support the business strategy. Every firm should adopt a strategic initiative to align suppliers and distributors into collaborative relationships to gain a competitive advantage. When this synchronization takes place, it’s called an integrated logistics model. There are a few key factors that comprise a successful integrated logistics model and they are: asset minimization, lowest total cost, and supply chain connectivity.
Since the business of logistics has become big business in the U.S., it’s also important to have a solid logistics structure in place. Critical components of a logistics structure that an organization should encompass are as follows: facility network, warehousing and material handling packaging, order management, transportation and inventory.
All of these things have one goal and that is to ensure customer success. No longer will excellent service and customer satisfaction lead to loyalty. For companies to now be competitive and successful, they will have to evolve their philosophy towards ensuring customer success. They will have to ask: “How can I enhance my customers’ performance?” This entails understanding customer requirements, processes and their total costs.
A successful logistics strategy will be a customer focused strategy. This will allow for a stronger franchise with best customers and lower logistics costs. It should also result in higher inventory turns and reduced expediting because you will be in a true partnership and not a tactical relationship with your customer base. The logistics value proposition for any company will focus on configuring in a customer relevant way while concurrently enhancing quality, productivity and operational excellence. Any successful strategy cannot remain static. Business leaders need to stay atop of technology and trends as they impact and change the scope of business faster than ever before.
17 . When it comes to logistics strategy success :
Employ an experienced transportation procurement specialist to vet and manage your vendors “in house”. Within these vendors, you want to work with a combination of asset based companies and at least 2 third-party logistics companies (3pl’s). 3pl companies have access to all modes of transportation throughout the entire market, and will be able to adapt to changes in the market throughout the year. Also, working with more than one of these companies will keep them in competition with one another and will usually net you the lowest price for their services.
18.
If I had one fundamental piece of logistics management advice for a company, it would be to…
Conduct a complete risk and resilience assessment prior to establishing a new supply chain. Unfortunately, resilience does not come in a box, and cannot be purchased just when you need it. While designing and building a resilient supply chain from the very beginning is much more cost-effective than trying to change the supply chain in mid-stream, many organizations must redesign them as they live with the results of one or more disasters or shocks.A resilient supply chain is one that is flexible in the face of disruptive events. For example, an inbound supply chain that uses Just-In-Time delivery of parts is lean and cost-effective in the short term, but may be easily disrupted by events beyond the control of its managers. Resilience means having the flexibility of being able to choose from multiple suppliers, several backup modes of transport, or keeping 24-48 hours of parts on hand to smooth out the parts flow during disruptive events. This type of built-in resilience can give operational managers the time to react should the event prove to be a longer-term disruption.
Although logistics systems are called supply chains, they are not linear chains as the name suggests. Rather, supply chains are very often complex webs or networks of infrastructure, suppliers, supplies and services. Managers can’t use linear thinking when determining the weaknesses and risks in a complex system. Therefore, using systems thinking to map and quantify the movement of goods and services, and the dependencies between the parts of the supply chain, is a much more effective way to identify risks in a modern logistics network. This map or model can then be used to demonstrate to company decision-makers where vulnerabilities exist, and by extension which parts of the network are at greatest risk.
Large firms with their own planning departments run scenarios to determine the most costly and the most vulnerable nodes in the network, and use the results of the scenarios to mitigate the risks ahead of time. Until now, smaller firms did not have that ability. However, new software tools are enabling small and medium-sized companies to run their own planning scenarios, and recover more quickly from known events.
Identifying vulnerabilities and mitigating the supply chain risks ahead of time is critical to your survival when the disruptive event hits. This extra time can mean the difference between collapse and the ability to save money, recover faster and with less impact on the business and, most importantly, its customers.
A resilient supply chain is the product of thorough analysis and careful planning. Tomorrow`s resilience is the product of the smart decisions made today. Risk discovery, risk analysis and risk mitigation are complex and potentially costly. Our company, RiskLogik, provides the skilled professionals, proven techniques and leading edge tools to help your company build resilience quickly and cost effectively. RiskLogik’s software is being used by the Government of Ontario to analyze and plan for critical infrastructure risk events, and also by the Government of New Brunswick to map supply chain risks and vulnerabilities within the province
19. “Today, freight transportation management is more than just about price. But how do shippers put together a transportation and supplier sourcing strategy that will…”
Earn them the capacity that they need at a price that works for all parties involved?
Tip: Consider Big Data
When asked to identify the trend with the greatest potential impact on the way procurement does it job over the next decade, the majority of the study participants chose predictive analytics or forecasting.
Analysts observe that as procurement’s role matures in transportation management from transactional facilitator to trusted business advisor, proficiency with the next generation of analytics—Big Data—will be a key enabler. Big Data may also add significant value when it comes to customer analytics, bringing more agility to model massive volumes of structured and unstructured data from multiple sources.
20.transportation management provides that delivers engineering, technology, and sustainability solutions to a customer base of established global organizations. a consultative approach with some of the largest high tech and telecom companies around the world and helps them meet objectives in improved customer service, efficiency gains, increased market penetration, and revenue growth. also focuses on managing customer solutions inclusive of supply chain deign, business process re-engineering, and technology solutions.
“There’s no doubt that supply chain and logistics issues are critical to any company’s success. But dramatic improvements don’t always involve…”
Large-scale strategic overhauls or process changes that require months to implement.
Small parcel carriers can often provide a cost savings on multi-piece shipments that don’t involve a full pallet or multiple pallets. Look at small parcel vs. LTL carrier or LTL vs. truckloads to understand the price differentials for various weight and zone break points. Changing the routing or mode of shipments can pay off, especially for midmarket shippers.
Make sure your A and B movers are properly located to allow for minimum processing time and distance to the outbound shipping lanes. Place those fast movers carefully. If they are all in the same aisle or location, you can create a bottleneck as employees run into each other doing the pick.
Companies shipping from more than one location would want A & B movers in each, but D movers in just one, to keep inventory carrying costs down. If you decide you need to have 100 D movers, put them where the warehouse space and labor costs are lowest. That can reduce your inbound shipping cost, too.
21.
… the companies that are the most customer-centric have ten characteristics:
- Clarity of purpose for the buyer
- Take ownership of the channel: drive reliability and excitement
- Build segmented customer strategies: tie strategy to policy/execution
- Cost-to-serve with data-driven discussions
- The supply chain has a clear focus on outcomes
- Alignment between operations and commercial teams
- Build outside-in processes
- Hands-free and reliable order processes
- Cross-functional listening
- Execute at the moments of truth
22. “What we find is that the better aligned your strategies are – from supply chain to transportation to carrier strategies – and the better aligned they are with execution, the better able and more effective you are at…”
Managing both cost and service at the same time. Being able to benchmark allows you to identify your supply chain performance and the positioning of your supply chain within the business – both critical factors in determining what kind of shipper you are.
[The key to enabling alignment and synchronization across a broader supply chain strategy is] the people, process, and technology that allow you to hook everything together and make sure there’s alignment over time. Processes and technologies that are designed to provide transparency, visibility, and data are critical to ensuring an alignment between the various levels of strategy. We talk about a waterfall from the carrier to the supply chain strategy to the transportation strategy to the carrier strategy and then to the execution. There’s also a feedback loop forward that allows you to understand whether your strategies are aligned, and what impact changes have on your overall performance. An example would be, what is your carrier performance telling you about your supply chain strategy? If you have a significant change in your on-time or cost performance, what is that telling you about your supply chain strategy? Having that feedback loop ensures alignment.
XXX . V0 Example Products for efficient transportation & logistics
TRANSPOREON is a web-based logistics platform that links industrial and commercial companies with their logistics service providers. It allows cost-saving, transparent online handling of all workflows related to the transportation management process. The Transporeon product portfolio includes automated shipment execution, dock scheduling, visibility, reporting and much more. More than 1000 shippers and over 57,000 carriers currently benefit from TRANSPOREON's solutions.

Live demo for prospects (industry & trade)
Request a free live demo session with our experts to see our innovative software solutions in action.
Learn how the TRANSPOREON Cloud will drive efficiencies into your logistics and supply chain processes.

Shipment execution
Automated, flexible shipment processing - The TRANSPOREON Way
Companies can use TRANSPOREON shipment execution to assign transport orders to carriers. Conversely, carriers have the ability to provide their shipping customers with the suitable product offer. Through electronic assignment, both parties save freight, process and telephone costs and improve their delivery quality. Using TRANSPOREON, companies benefit from various options of shipment execution, adapted to individual needs and cost-effective basic conditions.
Dock scheduling
Control your docks. Eliminate detention charges.
Book time slots online, arrive, load/unload on-time and be back on the road quickly – this is how TRANSPOREON dock scheduling works. Dock scheduling ensures less idle time during loading and unloading, equalizes peak times and reduces waiting time. Shippers can provide their goods in a timely manner and use their shipping team to their optimal capacity.


Visibility
"Where are my goods?" Track reliably using shipment tracking
TRANSPOREON visibility brings more transparency to your transportation process. By means of status messages, all goods can be tracked: From pickup to delivery to the end customer. Delays are reported immediately, even before the customer asks. Each step is documented. Carriers use this information as proof of delivery; shippers use it as a performance measurement or supplier evaluation.

Reporting
Optimize company performance through reliable key performance indicators
Using the reporting module from TRANSPOREON , important key performance indicators can be determined easily and evaluations can be created at any time at the press of a button. Thus, all relevant information is up-to-date and available quickly. For example, on the performance of the transport company, adherence to deadlines, scheduling quotas or the ratio of supply and demand.
XXX . V00 Transportation Economics/Costs
Costs
Introduction
Price, cost and investment issues in transportation garner intense interest. This is certainly to be expected from a sector that has been subject to continued public intervention since the ninteenth century. While arguments of market failure, where the private sector would not provide the socially optimal amount of transportation service, have previously been used to justify the economic regulations which characterized the airline, bus, trucking, and rail industries, it is now generally agreed, and supported by empirical evidence, that the move to a deregulated system, in which the structure and conduct of the different modes are a result of the interplay of market forces occurring within and between modes, will result in greater efficiency and service.
Many factors have led to a reexamination of where, and in which mode, transportation investments should take place. First, and perhaps most importantly, is the general move to place traditional government activities in a market setting. The privatization and corporatization of roadways and parts of the aviation systems are good examples of this phenomenon. Second, there is now a continual and increasing fiscal pressure exerted on all parts of the economy as the nation reduces the proportion of the economy’s resources which are appropriated by government. Third, there is increasing pressure to fully reflect the environmental, noise, congestion, and safety costs in prices paid by transportation system users. Finally, there is an avid interest in the prospect of new modes like high speed rail (HSR) to relieve airport congestion and improve in environmental quality. Such a major investment decision ought not be made without understanding the full cost implications of a technology or investment compared to alternatives.
This chapter introduces cost concepts, and evidence on internal costs. The chapter on Negative externalities reviews external costs.
Supply
In imperfectly competitive markets, there is no one-to-one relation between P and Q supplied, i.e., no supply curve. Each firm makes supply quantity decision which maximises profit, taking into account the nature of competition (more on this in pricing section).
Supply function (curve). specifies the relationship between price and output supplied in the market. In a perfectly competitive market, the supply curve is well defined. Much of the work in transportation supply does not estimate Supply-curve. Instead, focus is on studying behaviour of the aggregate costs (in relation to outputs) and to devising the procedure for estimating costs for specific services (or traffic). Transport economists normally call the former as aggregate costing and the latter as disaggregate costing. For aggregate costing, all of the cost concepts developed in micro-economics can be directly applied.

Types of Costs
There are many types of costs. Key terms and brief definitions are below.
- Fixed costs (): The costs which do not vary with output.
- Variable costs (): The costs which change as output levels are changed. The classification of costs as variable or fixed is a function of both the length of the time horizon and the extent of indivisibility over the range of output considered.
- Total costs (): Total expenditures required to achieve a given level of output ().
- Total costs = fixed costs + variable costs. = a + bQ
- Average costs: The total cost divided by the level of output.
- Average Cost for a single product firm: ,
- Average fixed cost =
- Average variable cost =
- Average Cost for a multi-product firm is not obvious (i.e. which output), two methods
- Ray average cost: Fix the output proportion and then examine how costs change as the scale of output is increased along the output 'ray'. Like moving out along a ray in output space - thus 'ray' average cost; multiproduct scale economies exists if there is DRAC (declining ray average cost). (Fixity or Variability depends on the time horizon of the decision problem and is closely related to the indivisibility of production (costs).)
- Incremental average cost: Fix all other output except one, and then examine the incremental cost of producing more ith output - thus, incremental average cost; product-specific scale economies exist if there is DAIC (declining average incremental cost).
- Average Cost for a single product firm: ,
- Marginal (or incremental) cost: The derivative (difference) of Total Cost with respect to a change in output.
- Marginal Cost MC =
- Incremental Cost IC =
- Opportunity costs: The actual opportunities forgone as a consequence of doing one thing as opposed to another. Opportunity cost represents true economics costs, and thus, must be used in all cases.
- Social cost: The cost the society incurs when its resources are used to produce a given commodity, taking into account the external costs and benefits.
- Private cost: The cost a producer incurs in getting the resources used in production.


The production of transport services in most modes involves joint and common costs. A joint cost occurs when the production of one good inevitably results in the production of another good in some fixed proportion. For example, consider a rail line running only from point A to point B. The movement of a train from A to B will result in a return movement from B to A. Since the trip from A to B inevitably results in the costs of the return trip, joint costs arise. Some of the costs are not traceable to the production of a specific trip, so it is not possible to fully allocate all costs nor to identify separate marginal costs for each of the joint products. For example, it is not possible to identify a marginal cost for an i to j trip and a separate marginal cost for a j to i trip. Only the marginal cost of the round trip, what is produced, is identifiable.
Common costs arise when the facilities used to produce one transport service are also used to produce other transport services (e.g. when track or terminals used to produce freight services are also used for passenger services). The production of a unit of freight transportation does not, however, automatically lead to the production of passenger services. Thus, unlike joint costs, the use of transport facilities to produce one good does not inevitably lead to the production of some other transport service since output proportions can be varied. The question arises whether or not the presence of joint and common costs will prevent the market mechanism from generating efficient prices. Substantial literature in transport economics (Mohring, 1976; Button, 1982; Kahn, 1970) has clearly shown that conditions of joint, common or non-allocable costs will not preclude economically efficient pricing.
- Traceable cost (untraceable cost): A cost which can (cannot) be directly assigned to a particular output (service) on a cause-and-effect basis. Traceable (untraceable) costs may be fixed or variable (or indivisible variable). Traceability is associated with production of more than one output, while untraceable costs possess either (or both) common costs and joint costs. The ability to identify costs with an aggregate measure of output supplied (e.g. the costs of a round trip journey) does not imply that the costs are traceable to specific services provided.
- Joint cost: A cost which is incurred simultaneously during the production for two or more products, where it is not possible to separate the contributions between beneficiaries. These may be fixed or variable (e.g. cow hides and cow steaks).
- Common cost: A cost which is incurred simultaneously for a whole organization, where it cannot be allocated directly to any particular product. These may be fixed or variable (e.g. the farm's driveway).
External and Internal Costs
External costs are discussed more in Negative externalitiesEconomics has a long tradition of distinguishing those costs which are fully internalized by economic agents (internal or private costs) and those which are not (external or social costs). The difference comes from the way that economics views the series of interrelated markets. Agents (individuals, households, firms and governments) in these markets interact by buying and selling goods are services, as inputs to and outputs from production. A firm pays an individual for labor services performed and that individual pays the grocery store for the food purchased and the grocery store pays the utility for the electricity and heat it uses in the store. Through these market transactions, the cost of providing the good or service in each case is reflected in the price which one agent pays to another. As long as these prices reflect all costs, markets will provide the required, desirable, and economically efficient amount of the good or service in question.
The interaction of economic agents, the costs and benefits they convey or impose on one another are fully reflected in the prices which are charged. However, when the actions of one economic agent alter the environment of another economic agent, there is an externality. An action by which one consumers purchase changes the prices paid by another is dubbed a pecuniary externality and is not analyzed here further; rather it is the non-pecuniary externalities with which we are concerned. More formally, "an externality refers to a commodity bundle that is supplied by an economic agent to another economic agent in the absence of any related economic transaction between the agents" (Spulber, 1989). [1] Note that this definition requires that there not be any transaction or negotiation between either of the two agents. The essential distinction which is made is harm committed between strangers which is an external cost and harm committed between parties in an economic transaction which is an internal cost. A factory which emits smoke forcing nearby residents to clean their clothes, cars and windows more often, and using real resources to do so, is generating an externality or, if we return to our example above, the grocery store is generating an externality if it generates a lot of garbage in the surrounding area, forcing nearby residents to spend time and money cleaning their yards and street.
There are alternative solutions proposed for the mitigation of these externalities. One is to use pricing to internalize the externalities; that is, including the cost which the externalities impose in the price of the product/service which generate them. If in fact the store charged its customers a fee and this fee was used to pay for the cleanup we can say the externality of ‘unsightly garbage’ has been internalized. Closer to our research focus, an automobile user inflicts a pollution externality on others when the car emits smoke and noxious gases from its tailpipe, or a jet aircraft generates a noise externality as it flies its landing approach over communities near the airport. However, without property rights to the commodities of clean air or quiet, it is difficult to imagine the formation of markets. The individual demand for commodities is not clearly defined unless commodities are owned and have transferable property rights. It is generally argued that property rights will arise when it is economic for those affected by externalities to internalize the externalities. These two issues are important elements to this research since the implicit assumption is that pricing any of the externalities is desirable. Secondly, we assume that the property rights for clean air, safety and quiet rest with the community not auto, rail and air users. Finally, we are assuming that pricing, meaning the exchange of property rights, is possible. These issues are considered in greater detail in Chapter 3 where the broad range of estimates for the costs of the externalities are considered.
Other terms
- Sunk costs: These are costs that were incurred in the past. Sunk costs are irrelevant for decisions, because they cannot be changed.
- Indivisible costs: Do not vary continuously with different levels of output or must expenditures, but be made in discrete "lumps". Indivisible costs are usually variable for larger but not for smaller changes in output
- Escapable costs (or Avoidable costs): A cost which can be avoided by curtailing production. There are both escapable fixed costs and escapable variable costs. The escapability of costs depends on the time horizon and indivisibility of the costs, and on the opportunity costs of assets in question.
Time Horizon
Once having established the cost function it must be developed in a way which makes it amenable to decision-making. First, it is important to consider the length of the planning horizon and how many degrees of freedom we have. For example, a trucking firm facing a new rail subsidy policy will operate on different variables in the short run or a period in which it cannot adjust all of its decision variables than it would over the long run, the period over which it can adjust everything.Long run costs, using the standard economic definition, are all variable; there are no fixed costs. However, in the short run, the ability to vary costs in response to changing output levels and mixes differs among the various modes of transportation. Since some inputs are fixed, short run average cost is likely to continue to fall as more output is produced until full capacity utilization is reached. Another potential source of cost economies in transportation are economies of traffic density; unit cost per passenger-kilometer decreases as traffic flows increase over a fixed network. Density economies are a result of using a network more efficiently. The potential for density economies will depend upon the configuration of the network. Carriers in some modes, such as air, have reorganized their network, in part, to realize these economies.
In the long run, additional investment is needed to increase capacity and/or other fixed inputs. The long run average cost curve, however, is formed by the envelope of the short run average cost curves. For some industries, the long run average cost often decreases over a broad range of output as firm size (both output and capacity) expands. This is called economies of scale. The presence of economies at the relevant range of firm size means that the larger the size of the firm, the lower the per-unit cost of output. These economies of scale may potentially take a variety of forms in transportation services and may be thought to vary significantly according to the mode of transportation involved.
Time horizon in economic theory
- Short run: the period of time in which the input of one or more productive agents is fixed
- Long run: the period of time in which all inputs are variable
- the type of decision: when do the costs and benefits occur ?
- the expected life time of assets involved
- the time horizon for major transportation projects tends to be lengthy relative to that in other industries
In the diagram below the relationship between average and marginal costs for four different firm sizes is illustrated. Note that this set of cost curves was generated from a non-homogeneous production function. You will note that the long run average cost function (LAC) is U-shaped thereby exhibiting all dimensions of scale economies.

Mathematically


where: provides the optimal plant size.

Indicators of Aggregate Cost Behavior
Scale economies is the behavior of costs when the AMOUNT of an output increases while scope economies refers to the changes in costs when the NUMBER of outputs increases.Economies of Scale
Economies of scale refer to a long run average cost curve which slopes down as the size of the transport firm increases. The presence of economies of scale means that as the size of the transport firm gets larger, the average or unit cost gets smaller. Since most industries have variable returns to scale cost characteristics, whether or not a particular firm enjoys increasing, constant or decreasing returns to scale depends on the overall market size and the organization of the industry.The presence or absence of scale economies is important for the industrial structure of the mode. If there were significant scale economies, it would imply fewer larger carriers would be more efficient and this, under competitive market circumstances, would naturally evolve over time. Scale economies are important for pricing purposes since the greater are the scale economies, the more do average and marginal costs deviate. It would, therefore, be impossible to avoid a deficit from long run marginal [social] cost pricing.
Another note of terminology should be mentioned. Economics of scale is a cost concept, returns to scale is a related idea but refers to production, and the quantity of inputs needed. If we double all inputs, and more than double outputs, we have increasing returns to scale. If we have less than twice the number of outputs, we have decreasing returns to scale. If we get exactly twice the output, then there are constant returns to scale. In this study, since we are referring to costs, we use economies of scale. The presence of economies of scale does not imply the presence of returns to scale.
Scale measures long-run (fully adjusted) relationship between average cost and output. Since a firm can change its size (network and capacity) in the long run, Economies of Scale (EoS) measures the relationship between average cost and firm size. EoS can be measured from an estimated aggregate cost function by computing the elasticity of total cost with respect to output and firm size (network size for the case of a transport firm).
Returns to Scale (Output Measure)
Increasing Returns to Scale (RtS)
Decreasing RtS

Economies of Scale (Cost Measure)
Economies of scale (EoS) represent the behavior of costs with a change in output when all factors are allowed to vary. Scale economies is clearly a long run concept. The production function equivalent is returns to scale. If cost increase less than proportionately with output, the cost function is said to exhibit economies of scale, if costs and output increase in the same proportion, there are said to be 'constant returns to scale' and if costs increase more than proportionately with output, there are diseconomies of scale.- if cost elasticity < 1, or -> increasing EoS
- if cost elasticity = 1, or -> constant EoS
- if cost elasticity > 1, or -> decreasing EoS


Economies of Density
There has been some confusion in the literature between economies of scale and economies of density. These two distinct concepts have been erroneously used interchangeably in a number of studies where the purpose was to determine whether or not a particular mode of transportation (the railway mode has been the subject of considerable attention) is characterized by increasing economies or diseconomies of scale. There is a distinction between density and scale economies. Density economies are said to exist when a one percent increase in all outputs, holding network size, production technology, and input prices constant, increase the firm’s cost by less than one percent. In contrast, scale economies exist when a one percent increase in output and size of network increases the cost by less than one percent, with production technology and input prices held constant.Economies of density, although they have a different basis than scale economies, can also contribute to the shape of the modal industry structure. It can affect the way a carrier will organize the delivery of its service spatially. The presence of density economies can affect the introduction of efficient pricing in the short term, but generally not over the long term since at some point density economies will be exhausted. This, however, will depend upon the size of the market. In the air market, for example, deregulation has allowed carriers to respond to market forces and obtain the available density economies to varying degrees.
Returns to Density similar to returns to a capacity utilization when capacity is fixed in the short run. Since the plant size (network size for the case of transportation firms) is largely fixed in the short run, RTD measures the behavior of cost when increasing traffic level (output) given the plant size (network size). It is measured by the cost elasticity with respect to output.
- if cost elasticity < 1, or -> increasing EoD
- if cost elasticity = 1, or -> constant EoD
- if cost elasticity > 1, or -> decreasing EoD


Economies of Capacity Utilization
A subtle distinction exists between economies of density, which is a spatial concept, and economies of capacity utilization, which may be aspatial. As a fixed capacity is used more intensively, the fixed cost can be spread over more units or output, and we have declining average cost, economies of scale. However, as the capacity is approached, costs may rise as delays occur. This gives a u-shaped cost curve.While economies of scale refer to declining average costs, for whatever reason, when output increases; and economies of density refer to declining costs when output increases and the network mileage is held constant; economies of capacity utilization refers to declining costs as the percentage of capacity which is used increases, where capacity may be spatial or aspatial.
While density refers to how much space is occupied, capacity refers to how much a capacitated server (e.g. a bottleneck, the number of seats on a plane) is occupied, and may incorporate economies of density if the link is capacitated, such as a congesting roadway. However if a link has unlimited (or virtually unlimited) capacity, such as intercity passenger trains on a dedicated right-of-way at low levels of traffic, then economy of density is a more appropriate concept. Another way of viewing the difference is that economies of density refers to linear miles, while economies of utilization refer to lane miles.
Economies of Scope
Typically, the transport firm produces a large number of conceptually distinct products from a common production facility. In addition, the products of most transportation carriers are differentiated by time, space and quality. Because a number of distinct non-homogeneous outputs are being produced from a common production facility, joint and common costs arise. The presence of joint and common costs give rise to economies of scope. There has been some confusion in the multi-product literature among the concepts of sub-additivity of the cost function, trans-ray convexity, inter-product complementarity and economies of scope. Sub additivity is the most general concept and refers to a cost function which exhibits the characteristic that it is less costly to produce different amounts of any number of goods in one plant or firm than to sub divide the products or service in any proportion among two or more plants. Trans-ray convexity is a somewhat narrower concept. It refers to a cost function which exhibits the characteristic that for any given set of output vectors, the costs of producing a weighted average of the given output vectors is no greater than the weighted average of producing them on a stand alone basis. Economies of scope refers to the cost characteristic that a single firm multi-product technology is less costly than a single product multi-firm technology. It, therefore, is addressing the issue of the cost of adding another product to the product line. Inter-product complementarity is a weak test of scope economies. It refers to the effect on the marginal cost of one product when the output of some other product changes. It, therefore, is changing the amount of output of two or more products and not the number of products. Whether scope economies exist and the extent to which they exist depend upon both the number of products and the level of each output. There have not been definitive empirical estimates of economies of scope for transportation modes which are based on reliable data and undertaken in a theoretically consistently fashion.
Thought Question: Most firms produce multiple products. Why do multiple product firms exist ?
It must be cheaper to have one firm to produce multiple products than have separate firms produce each type of product.
Economies of scope arise from shared or jointly utilised inputs, e.g., imperfectly divisible plant which if used to produce only one product would have excess capacity (freight and passenger services using same airplane, forward-back haul production using a truck or rail car, etc.).It must be cheaper to have one firm to produce multiple products than have separate firms produce each type of product.
This can be represented graphically as in the diagram on the right. In production space an isoquant would link two outputs and would have the interpretation of an isoinput line, that is, it would be the combination of outputs which are possible with a given amount of inputs. If there were economies of scope, the line would be concave to the origin, if there were economies of specialization it would be convex and if there were no scope economies it would be a straight line at 45 degrees.
Let , = number of different outputs.


Economies of scope exists if

That is, it is cheaper to have one firm produce all outputs than to have n separate firms produce each output , where is the cost for a firm to produce output .


Scope economies are a weak form of 'transray convexity' and are said to exist if it is cheaper to produce two products in the same firm rather than have them produced by two different firms. Economies of scope are generally assessed by examining the cross-partial derivative between two outputs, how does the marginal cost of output one change when output two is added to the production process.
Changes in Cost
Costs can change for any number of different reasons. It is important that one is able to identify the source of any cost increase or decreases over time and with changes in the amount and composition of output. The sources of cost fluctuations include:- density and capacity utilization; movements along the short run cost function
- scale economies; movements along the long run cost function
- scope economies; shifts of the marginal cost function for one good with changes in product mix
- technical change which may alter the level and shape of the cost function
Characterizing Transportation Costs
All modes of transport experience:- economies of vehicle size up to a point
- increasing returns in provision of way and track capacity
- economies of longer distance travelled
- rapidly rising average cost with increased speed;
- exponentially increasing energy consumption with speed
- difficultly in identifying the costs associated with particular traffic because of indivisibilities in production and heterogeneity of output
- declining unit costs over a range of output because of indivisibilities,
- e.g. the backhaul problem, increase in traffic on the backhaul will reduce the average costs of the round trip operation
- indivisibilities in production give rise to "kinked" average cost curves and discontinuous marginal costs
Costing
Costing is the method or process of ascertaining the relationship between costs and outputs in a way which is useful for making decisions (managerial, strategic, regulatory policy etc.). There are numerous examples where detailed cost information is necessary for carriers' management decisions and government's regulatory decisions. Also there are many carrier and government decisions requiring information about the behaviour of aggregate costs of a firm.Carrier Management Decisions
Requiring disaggregate cost info:- rates and rate structure decisions;
- rate setting
- shipper-carrier negotiations
- financial viability of specific services; e.g.,
- rail passenger operations,
- rail branch lines
- decision to launch a specific service
- application of subsidies
- compensation for running rights;
- passenger trains
- leased right of way
- carrier network plan
- plan for mergers and acquisitions
- strategic plan
- major investment decisions
Policy Decisions
Requiring disaggregate cost info:- enforcing pricing regulation
- decisions on public subsidies
- branchline abandonment decision - "short-line" sales
- user charges for government-owned infrastructure
- decision on price and entry regulation;
- natural monopoly question - scale and density economies
- effect of regulation on efficiency;
- allocative efficiency
- X-efficiency
- approval of mergers and acquisition - scale and density economies
- decisions on transport infrastructure investment
- licensing of competitive services
Aggregate Cost Analysis
Econometric cost functions are estimated to study the behaviour of aggregate costs in relation to the aggregate output level (economies of scale) and output mix (economies of scope). The aggregate cost function also allows one to estimate the changes in productive efficiency over time. This allows inference about the effect of regulation on productivity of an industryWhich Costs
Economic theory suggests that costs are a function of at least factor prices and outputs. In practice, calculating costs, prices, or outputs can be tricky. For example, how should capital costs be determined ?Capital costs may occur over one year but it is likely to be used over a long period of time. So we should use the opportunity costs which includes depreciation and interest costs. The capital stock of a firm will vary year to year.
Accountants tend to use historical costs which do not account for inflation. The point is that in the real world get all sorts of complications.
Prices and Outputs
For prices and outputs, a firm may use many inputs and provide many different outputs. Transportation outputs are produced over a spatial network. An appropriate definition of outputs is the movement of a commodity/passenger from an origin to a destination - a commodity/passenger trip. A trip from A to B is different from a trip from C to D (or B to A) even if the same distance. Ideally, a transport cost model should account for this multiproduct nature. But cannot specify thousands of outputs -some aggregate is necessary. Often. lack of data requires aggregation to a single output measure like ton-kilometres or passenger-kilometres.Attribute Variables
To account for the multidimensional heterogeneous nature of outputs, one can use attribute variables such as average length of haul or average stage length. They will vary by firms. Operating characteristics such as average shipment size, average load factor, etc., also affect costs. For example, if plane or truck is not full, there is unused capacity; adding a commodity trip may incur little marginal cost; longer distances can lower AC by spreading terminal costs or takeoff fuel costs.Estimation
Cost function Estimation requires decisions on:- short run vs. long run cost function
- short run cost functions from time series data;
- long run cost functions from cross-section data;
- variable vs. total cost function;
- variable cost functions are estimated by fixing some inputs such as physical plants (rail roadbed and track; aircraft fleet, etc)
- the choice of functional form
- the choice of output measure;
- single vs. multiple output measures
- revenue output vs. available output
- the choice of the level of aggregation of cost accounts
- the choice of attribute variables to account for heterogeneous nature of outputs being produced over time or across different firms in the sample data.
Difficulties with Costing
- multi-dimensionality and heterogeneous nature of outputs
- indivisibilities in production
- costs may not occur at the same time as the outputs being produced. eg. capital costs may over one year but it is likely to be used over several years, and some expenses occur some time after the increases in outputs (expenses occur less frequently than changes in (train) trips), etc
- ambiguity in cost standards
- difficulty of relating past to future
- input price changes
- changes in production technology
- changes in operating conditions
Disaggregate Costing
Disaggregate costing can be used to estimate the variable cost of a block of traffic, or traffic on a particular line,etc. it is useful for setting rates, investment decisions, subsidy determinations, etc. by companies themselves or governmentDeductive (economic) vs inductive (engineering) approaches are used in transportation modeling, and analysis. The deductive approach uses modeling and prior relationships to specify a functional relationship which is then examined statistically. An inductive approach is based on a detailed understanding of physical processes.
Inductive Approaches
- Use of Engineering Relationships
- Average Cost Calculation using Accounting Info
- Statistical Costing
Engineering Costing
Engineering costing focuses on the amount of each input required to produce a unit of output, or the technical coefficients of production. combining such coefficients with the costs of the inputs yields the cost function for the particular output.There are two approaches to engineering costing:
- to derive the technical coefficients from physical laws or precise engineering relationships.
- to empirically establish the technical relationship by controlled experiment.
- advantage
- Accuracy ? Precision?
- shortcomings:
- data- and time-intensive costly
- nonstochastic
- must have well defined production processes
Accounting Costing
- compiles the cost accounts categories relevant to the output or service in question, and use that information to estimate the costs associated with a specific movement.
- advantages:
- relatively cheap
- convenient
- shortcomings:
- data/information must exist
- the recorded values of assets may not be a reliable indicator of the actual opportunity costs of those assets
- the cost accounts may not distinguish fixed vs. variable costs Y over estimation of the marginal cost.
- the accounts are classified by the types of expenses, not by output type, it is difficult to uncover the true relations between cost and outputs
- the aggregation in the accounts may prevent identifying the costs which can be related to the production of particular outputs
Statistical Costing
Statistical costing employes statistical techniques (usually multiple regression analysis) to infer cost-output relationships from a sample of actual operating experiences. It makes use of accounting information.Basic steps in statistical costing are:
(1) Decompose and identify the intermediate work units associated with the specific traffic. For example, costing 500 tons of coal from point a to b, intermediate work units may consist of line haul, switching, terminal activities, administration, etc. Explanatory variables for these activities would include ton-miles, car-miles, yard-switching miles, train-hours, gallons of fuel, etc.
(2) Establish relationship between factor inputs and the intermediate process. This can be done by direct assignment of an expense category to the work unit, if causal relation is clear. Often, expenses are common to several types of traffic, so estimate statistical relationship with regression analysis.
For example, regression of track and roadway maintenance (TRM)

(3) Apply the marginal/unit costs of the intermediate work units estimated in step (2) to the work units identified in step (1).
(4) Sum all expenses in step (3) to calculate the total avoidable cost of a block of traffic.
Evidence on Carrier Costs
How do the long run concepts of economies of scale and economies of scope and the short run concepts of economies of density and economies of capacity utilization influence costs? Why are they important to our discussion of transport infrastructure pricing? These questions will be addressed in the following section.Air Carriers
A considerable number of studies, Douglas and Miller (1974) [2], Keeler (1974) [3], Caves, Christensen and Tretheway (1984) [4], Caves, Christensen, Tretheway and Windle (1985)[5], McShan and Windle (1989)[6], and Gillen, Oum, and Tretheway (1985, 1990)[7][8], have been directed at determining the functional relationship between total per-unit operating costs and firm size in airlines. All studies have shown that economies to scale are roughly constant; thus, size does not generate lower per-unit costs. However, generally, the measures of economies of density illustrate that unit cost would decrease for all carriers if they carried more traffic within their given network. In other words, the industry experienced increasing returns to density. The results also indicated that the unexploited economies of density are larger for low density carriers. Caves, Christensen, and Tretheway (1984) have shown that it is important when measuring costs to include a network size variable in the cost function, along with output, which would allow for the distinction between economies of scale and economies of density. McShan and Windle (1989) utilize the same data set as that used by Caves et al., and explicitly account for the hub and spoke configuration that has developed in the US since deregulation in 1978. They estimate a long run cost function which employs all the variables included in Caves et. al., and found economies to density of about 1.35. The hubbing variable indicates that, ceteris paribus, a carrier with 1% more of its traffic handled at hub airports expects to enjoy 0.11% lower cost than other similar carriers.Intercity Buses
Gillen and Oum (1984)[9] found that the hypothesis of no economies of scale can be rejected for the intercity bus industry in Canada; there are diseconomies of scale at the mean of the sample (0.91). Large firms were found to exhibit strong diseconomies of scale, and small and medium sized firms exhibit slight departures from constant returns. No cost complementarities are found to exist between the three outputs, namely, number of scheduled passengers, revenue vehicle miles of charter, tour and contract services, and real revenue from freight. These results, however, may be biased since no network measure was included in the estimating equations. The scale economy measure will, therefore, contain some of the influence of available density economies.Since deregulation of the intercity bus industries in the US and the UK., the number of firms has been significantly reduced. In the absence of scale economies, the forces leading to this industry structure would include density economies. We have, for example, observed route reorganization to approximate hub-and-spoke systems and the use of smaller feeder buses on some rural routes. The industry reorganization is similar to what occurred in the airline industry. The consolidation of firms was driven by density and not scale economies. One significant difference between these two industries, however, is airline demand has been growing while intercity bus demand is declining.
Railway Services
The structure of railway costs is generally characterized by high fixed costs and low variable costs per unit of output. The essential production facilities in the railway industry exhibit a significant degree of indivisibility. As with other modes, the production of railway services give rise to economies of scope over some output ranges. For example, track and terminals used to produce freight services are also used to produce passenger services.Caves, Christensen and Tretheway (1980)[10] have found that the US railway industry is characterized by no economies of scale over the relevant range of outputs. However, their sample does not include relatively small railroads, firms with less than 500 miles of track. Griliches (1972)[11] and Charney, Sidhu and Due (1977)[12] have found economies scale for such small US railroads. Friedlaender and Spady (1981) [13] suggested that there may be very small economies of scale with respect to firm size. Keeler (1974)[14], Harris (1977)[15], Friedlaender and Spady (1981) and Levin (1981)[16] have all shown that there are large economies of traffic density in the US railroad industry. They show that, allowing all factors of production except route mileage to vary, a railway producing 10 million revenue ton-miles per mile of road, for example, will have substantially lower average costs than will a railway producing only 5 million revenue ton-miles per mile of road. Harris (1977) estimated that approximately one-third of density economies were due to declining average capital costs, and two-thirds due to declining fixed operating costs, such as maintenance, and administration. Friedlaender and Spady (1981) estimate a short run cost function with five variable inputs, one quasi-fixed factor (structures) and two outputs which take the form of hedonic functions, accounting for factors such as low density route miles and traffic mixes. The study found no economies of scale. Caves, Christensen, Tretheway and Windle (1985) have examined economies of scale and density in the US railroads. Their basic result demonstrates that there are substantial economies of density in the US railway operations.
Evidence on Infrastructure Costs
As early as 1962, Mohring and Harwitz[17] demonstrated that the financial viability of an infrastructure facility, under optimal pricing and investment, will depend largely upon the characteristics of its cost function. To quote Winston (1991)[18]: “ If capacity and durability costs are jointly characterized by constant returns to scale, then the facility’s revenue from marginal cost pricing will fully cover its capital and operating costs. If costs are characterized by increasing returns to scale, then marginal cost pricing will not cover costs; conversely, if costs are characterized by decreasing returns to scale, marginal cost pricing will provide excess revenue.”The objective of this section is to provide a summary of the theoretical and empirical literature on the cost characteristics of modal infrastructure. The discussion will deal with the following types of infrastructure: airports, highways, and railways.
In developing a set of socially efficient prices for modes of intercity transport, it is not just the carrier’s cost structure which is important. Airports, roadways and harbors all represent public capital which is used by the carriers in the different modes to produce and deliver their modal services. This capital must also be priced in an efficient way to achieve the economic welfare gains available from economically efficient pricing. As with the carriers, the ability to apply first best pricing principles to infrastructure and still satisfy cost recovery constraints will depend upon the cost characteristics of building and maintaining the infrastructure.
As with carriers, the cost characteristics for infrastructure providers include scale economies, scope economies, density economies and utilization economies. Scale economies refer to the size of a facility; for example, is it cheaper to build three runways than it is to provide two runways? If so, there are economies of scale in the provision of runways. Scope economies encompass similar concepts as with carriers. Small, Winston and Evans (1989)[19] refer to scope economies in highways when both capacity and durability are supplied. Capacity refers to the number of lanes while durability refers to the ability to carry heavier vehicles. A similar concept would apply to airports: small and large aircraft, VFR and IFR traffic, and to harbors: large ships and small ships. Although rail infrastructure is currently supplied by the same firms operating the trains, there have been moves to separate infrastructure and carrier services. This separation will mean the track and terminals will have to be priced separately from carrier services.
Density economies should also, in principle, be evident in the provision of infrastructure. It is, for example, possible to expand outputs and all inputs for highways while holding the size of the network fixed.
Utilization economies refer to the short run cost function. They describe how quickly average and marginal costs will fall as capacity utilization approaches capacity. Although not of direct interest, they are important to consider in any cost estimation since failure to consider capacity utilization can bias upward the measures of both long run average and marginal costs.
Airports
Economists have typically assumed that capacity expansion is divisible. Morrison (1983)[20], in his analysis of the optimal pricing and investment in airport runways, has shown that airport capacity construction is characterized by no economies of scale, and, therefore, under perfect divisibility of capacity expansion, the revenue from tolls will be exactly equal to the capital cost of capacity investment (Mohring and Harwitz, 1962). Morrison’s results, however, were based on a sample of 22 of the busiest airports in the US and did not include any small airports. In the literature, there is no empirical evidence on the cost characteristics of capacity construction of new small airports or capacity expansion of existing small airports (e.g. one runway).Highways
In general, highways produce two outputs: traffic volume which requires capacity in terms of the number of lanes, and standard axle loading which require durability in terms of the thickness of the pavement. Prior to determining economies of scale in this multi-product case, the measure of economies of scale for each output, or the product specific economies of scale, must be examined. Small, Winston, and Evans (1989) reported the existence of significant economies of scale associated with the durability output of roads, the ability to handle axle loads. This is because the pavement’s ability to sustain traffic increases proportionally more than its thickness. They also found evidence that there are slight economies of scale in the provision of road capacity; i.e. the capacity to handle traffic volume. However, they reported diseconomies of scope from the joint production of durability and capacity because as the road is made wider to accommodate more traffic, the cost of any additional thickness rises since all the lanes must be built to the same standard of thickness. They conclude that these three factors together result in highway production having approximately constant returns to scale. In other words, the output-specific scale economies are offset by the diseconomies of scope in producing them jointly.Railways
An important difference between rail and other modes of transportation is that most railroads provide the infrastructure themselves and the pricing is undertaken jointly for carrier services and infrastructure. However, in a few cases, ownership and/or management of the trackage has been separated from carriers. Sweden is a good example but even in the US there have been joint running rights on tracks. This creates a situation whereby one firm may be responsible for the provision of trackage and another for carrier services. It is, therefore, legitimate to ask if there are any scale economies in the provision of railway infrastructure. There are no empirical estimates but it may be possible to use some of the Small, Winston and Evans (1988) work for roads to shed some light on the issue.Small et al. argue road infrastructure produces two outputs, durability and capacity. The former refers to the thickness of roads and the latter to their width. They found economies with respect to durability, but this is less likely to occur with a rail line since there would be a relatively broad range of rail car axle loading for a given level of durability of rail, ballast and ties. Thus, there may be some minor economies. The authors found diseconomies of scope from the joint production of durability and capacity for highways. These diseconomies are less likely to be evident in rail due to the broad range of durability noted above and the ability to restrict usage to specific tracks. On balance, it may be there are generally constant or minor economies in the provision of rail line infrastructure. The output specific scale economies seem to be minor as do the diseconomies of producing them jointly.
Factors affecting Transportation Costs
Transportation costs seem to be rising, There are many factors which might explain this. These are listed below. This list is no doubt incomplete, but may serve as a point of discussion.- Standards
- Standards have risen - Society now demands safety, features, environmental protection, access for the disabled, and quality that drive up the cost. Engineering design is often 20% of project costs. Does the firetruck really need to do a 360 degree turn on the cul-de-sac, or can it back out?
- Smith's Man of System - The man of system . . . is apt to be very wise in his own conceit; and is often so enamoured with the supposed beauty of his own ideal plan of government, that he cannot suffer the smallest deviation from any part of it. He goes on to establish it completely and in all its parts, without any regard either to the great interests, or to the strong prejudices which may oppose it. He seems to imagine that he can arrange the different members of a great society with as much ease as the hand arranges the different pieces upon a chess-board. He does not consider that the pieces upon the chess-board have no other principle of motion besides that which the hand impresses upon them; but that, in the great chess-board of human society, every single piece has a principle of motion of its own, altogether different from that which the legislature might chuse to impress upon it. If those two principles coincide and act in the same direction, the game of human society will go on easily and harmoniously, and is very likely to be happy and successful. If they are opposite or different, the game will go on miserably, and the society must be at all times in the highest degree of disorder. -- Adam Smith, The Theory of Moral Sentiments, 1759
- Gold-plating - Adding needless or useless features to projects. The costs of gold plating are several. Money spent on project X cannot be spent on project Y. This is the monetary opportunity cost of misallocation. Land devoted to project X cannot be devoted to project Y. More land also means greater distances to traverse. This is a spatial opportunity cost. There is a tension between the risk of gold plating (focus on benefits to the exclusion of cost) and of corner cutting (focusing on costs to the exclusion of benefits). But there is available to us a balance, building something which maximizes the difference between benefits and costs, not just looking at benefits or costs. Insufficient attention is placed on the trade-off, too much on the ends by advocates of one side or the other.
- Design for forecast.
- The State Aid system and associated standards - Funds are collected at the state and federal levels for transportation and then a portion of that money is transferred back to local governments for transportation. Along with the money comes requirements that dictate how that money is to be used. These include engineering requirements for things such as lane width, degree of road curvature and design speed and planning requirements for things like maintaining a hierarchical road network.
- Doing construction on facilities still in operation. - Aside from the rare bridge, it is unnecessary to keep facilities opening and operating while doing construction. This reduces construction space, reducing time, increases set-up/break-down costs, and otherwise adds to total costs. Construction is much faster (and thus cheaper) if rebuilding could be done on a closed facility. the Tube Lines as the classic example of the high cost of doing construction only at night and weekends, but keeping the line in operation. The system as a whole must be reliable, meaning I can get from here to there, but that does not mean every segment must be open 24/7/365. One reason the reconstruction of the I-35W bridge was so fast as that they contractors did not need to worry about existing traffic, (and it was design/build).
- Environmental Impact Statements (Reports) lead to "lock-in"
- Open government/costs of democracy - The planning process is required by law to bring in as many stakeholders as possible. This has (potentially) led to transportation investment being sought and justified for non-transportation concerns. Transportation investment is now used for social, moral and economic goals that are not directly related to mobility.
- Climate change adaptation is increasing the costs of projects.
- Scale economies
- There are in-sufficient economies of scale - When everything is bespoke, there is no opportunity for standardization and economies of scale. While many rail against cookie-cutter design, it is only with cookie-cutters that we get lots of cookies.
- Thin markets - There is no online department store for public works. I cannot go online and buy a transit bus or an interchange. The internet has not driven down prices in this field the way it has in so many others. As a result a few vendors can collude or orchestrate higher prices than would be faced in a more competitive market.
- Peaking - Transportation agencies attempt to provide high levels of peak capacity to accommodate the demand that results from un-priced roads and highways. This is very costly capacity to provide. If tolls were charged that reflected true costs people would drive less, especially during peak hours. It would therefore cost much less to provide the economically optimal amount of peak system capacity.
- Change of scope
- Projects are scoped wrong - We have investments that don't match actual demands. And this is not just for megaprojects. We have big buses serving few passengers. We have overgrown highways. We have a fear of building too small and having congestion or crowding so we build too big.
- Project creep - Side-payments in project development: noise walls hither and thither, etc. Side-payments are a required part of the politics of getting something built.
- "Starchitecture",
- Fragmented governance leads to large and meandering projects rather than centralized projects. Politicians have to "share the wealth" of projects. This is perhaps a cause of "project creep."
- Principal-agent problems
- Other people's money - Public works agencies are spending Other People's Money, and so are less motivated to get value for dollar than an individual consumer on their own. This principal-agent problem prevails in lots of organizations, but especially so in public works where the bias is not to have a failure. There was an old saying in business, no one ever got fired for buying IBM. The same holds in public works, where rocking the boat with new or innovative technologies is not sufficiently rewarded.
- Benefits are concentrated, costs are diffuse - As a result, the known beneficiaries lobby hard for projects, but not just to build it, but to build it in a way that is expensive. Costs are diffuse, it is seldom worth the taxpayer's time to oppose a project just because of its costs, which are spread among millions of other taxpayers.
- Decision-makers are remote - Remote actors cannot have precise information about local conditions, and in the absence of a free market in transportation (there is generally one buyer, who is generally a government agency), prices are not clear. As a result these remote actors misallocate because they are misinformed.
- Benefit cost analysis is only as good as the integrity of the data and the analysts.
- B/C analysis is not used to affect project outcomes.
- Planners and engineers are paid as percentage of total project cost.
- Formula spending reduces the incentive or need to worry much about costs. This is obviously related to many of the other hypotheses already considered but I think deserves it's own number.
- Lack of user fee funding - projects funded out of user fees are more likely to be efficient, partly because the agencies or private parties receiving those fees know the fees are limited and partly because they want to spend them in ways that will generate more fees (which means in ways that benefit users enough that the users are willing to pay for them).
- Federal funds favor capital-heavy technologies and investments. - Federal funding programs create perverse incentives that lead to very costly capital projects. Almost any project looks good if somebody else is paying for most of it. For example every year billions of dollars are spent on passenger rail projects that would never be funded were it not for generous Federal grants. Just look at the high speed rail program or the FTA New Starts program. There are examples on the highway side too, such as bridges to nowhere and freeways in rural areas with little traffic. These Federal programs, no matter how well intentioned, tip the local decision making process in favor of expensive capital projects and discourage consideration of lower cost options and policy reforms.
- Public ownership - Most of the transportation system is owned, planned, and managed by public agencies. These entities have many objectives but efficiency and cost-effectiveness are rarely a high priority. The public sector does some things well but it doesn't usually do them very efficiently. As a result transportation revenues are not always efficiently converted to transportation user benefits.
- Multi-jurisdiction - Because transportation involves a large number of public agencies with overlapping or intertwined responsibilities planning is complex and inefficient. Projects end up with all the bells and whistles needed to satisfy the agencies and constituencies that could block a proposal. Local elected officials often load up regional plans with pet projects that do little to improve transportation system performance. There is a whole science to how public agencies bargain with each other and interact, unfortunately the results are rarely optimal from a cost-effectiveness perspective. The principal/agent problem is part of the reason for this, but only a part. In nearly every metropolitan area in the United States institutional structure results in transportation plans and policies that fall far short of the cost-effectiveness that could be achieved.
- Graft.
- Poor commissioning - Contracts determining who does what on a project are poorly written, and affect outsourced projects.
- Separation of design and build - Different firms are responsible for engineering and construction, creating high communication costs.
- Union work rules (not wages) that inhibit productivity gains through new technologies.
- Public-private partnerships trade additional up front costs for faster construction.
- Project Duration
- Paralysis by analysis - The bureaucratic requirement to do analysis delays projects and adds costs
- Lack of upfront funds - Delays projects adds to ultimate costs.
- Lack of consensus - Political requirements for consensus add delays.
- Mismanagement and graft add to delays.
- Other
- The highest demand areas for maintenance and new stock occur in places that are expensive.
- Envy - is a much bigger problem in public works than in personal life. - I pay taxes for those things, why does Jurisdiction X get an LRT when my neighborhood/district doesn’t? It’s a recipe for political hostages at budget time, as few political leaders have any reason to say "You know, the benefit cost on a project in my district just shows the project makes no sense." It’s leads to two problems: projects that make no sense to serve some notion of geo-political equity, and project creep because if Jurisdiction X’s light rail stations had public art and golden knobs and a fountain, then my district’s light rail should have those and more. Combined with the Other People’s Money problem, this type of envy is a recipe for project creep.
- Materials are scarcer (and thus more expensive).
- Stop/start investment.
- w:Ratchet effect - Interest groups are attracted to a particular public issue and pressure the legislative body to increase spending on that issue, but make it impossible to decrease spending on the issue.
- w:Baumol's cost disease - The rise of wages in jobs without productivity gains is caused by the necessity to compete for employees with jobs that did experience gains and hence can naturally pay higher salaries.
- Transit investment isn't realizing any productivity gains from labor. - Every dollar spent on public transportation yields 70% more jobs than a dollar spent on highways. This is used to bolster the argument that we should spend more on transit, but instead suggests we are much better at building roads than at building transit. As labor is a large proportion of total cost, transit investment has not realized productivity gains that have occurred in road building. This could be explained in part by lack of competition, low levels of total investment haven't brought new producers into the market, or a number of other reasons. I don't think the relatively high number of jobs per dollar spent necessarily means that transit investment is more virtuous. It may just be more inefficient. This is a problem with treating transport investment as industrial policy.
- Utility works are uncharged.
- Experience and Competence - The US has no experience with high-speed rail, so there is no domestic expertise.
- Ethos, training and prestige - Transportation engineering is more prestigious in other countries.
- Government power - Governments have more power to implement in other countries.
- Legal system - Legal systems are more amenable to infrastructure construction, including liability, bonds, and insurance.
XXX . V000 Why Benchmarking Alone Isn’t Enough for Proper Transportation Cost Analysis
a transportation management consultancy. Given that our proprietary TMS, the Cerasis Rater, provides multiple reports, giving our shippers' many insights, this post is quite appropriate, just like getting the data that is meaningful, in order to make the best decisions for your business possible.
Carriers in the trucking industry and also shippers today are actively looking for ways to combat the rising costs of operating their businesses, but they often do not fully understand proper benchmarking, transportation cost analysis, and profit management are intertwined. Without understanding true costs and using benchmarks as just that – benchmarks – carriers and shippers will struggle to effectively analyze and reduce their costs.Benchmarking as a Hard Rule within Transportation Cost Analysis Can Be Damaging
A popular, and possibly overly-stressed, component of profit management is benchmarking. Although it is certainly important for carriers and shippers to review industry averages in comparison with their own costs and profits, many may use these averages – or benchmarks – without proper conjunctive analysis and without fully understanding their costs and profits. For a trucking company, shipper, or logistics provider to be profitable, owners must understand their cost of purchased transportation and expenses need to be in line with desired profitability. Using only industry averages in your transportation cost analysis to gauge business successes can not only be inaccurate, but can also be ineffective and even damaging.The following categories represent a major portion of a carrier’s operating cost and a shipper's direct transportation cost; the average cost per mile for the industry over the last year, according to industry experts is as follows:
- LTL – $1.79 per mile
- Specialized – $1.73 per mile
- Truckload – $1.51 per mile
- Fuel costs represent 39% of a total carrier’s cost
- Driver wages represent 26% of costs
- Payments on leased/purchased trucks and trailers represent 11% of costs
- Maintenance repair was the next most expensive line item expense
- Freight cost per unit shipped
- Outbound freight costs as percentage of net sales
- Inbound freight costs as percentage of purchases
- On-time pickups
- And more.....for a full list, see our White Paper on Transportation Metrics.
Fortunately there are several sources on benchmarking information available for carriers, two of which include the American Trucking Associations and the American Transportation Research Institute. The ATRI provides an analysis of operational cost of trucking and update the report once each year; the report is available online on a donation basis. The ATA can also provide you with specific materials on the subject.
Profits Need More than Benchmarking in your Transportation Cost Analysis
While benchmarking is a valuable tool to gauge costs and profits overall, it is critical to also utilize effective profit management skills as well. In order for a business to be successful, you must plan your expenses to your profits, treat every truck, and sometimes, your inbound freight management practice as a profit center, and know prior to dispatching every truck or executing your routing guide whether or not you’ll make a profit each time it is dispatched or picked up.One of the reasons why benchmarking alone isn’t enough to properly measure profits is that there are constant changes that influence the industry and affect costs and profits. Furthermore, each change that comes about impacts every business in a unique way; no two businesses are exactly alike, and fluctuations in the industry are never going to impact two companies in exactly the same way. Some of those changes come about as a result of changes in laws; currently, there are more than 20 laws pending that will impact the cost of transportation – not to mention CSA compliance, Hours of Service, e-logs, and changes in other areas as well. Oh, and have you heard of the doozy of a bill called the "Driver Coercion Law." You should follow this law as it could drastically change the freight shipping world. JOC.com reports:
Under a driver coercion regulation now on the federal drawing board, that shipper or consignee could be accused of “coercing” the truck driver to violate federal safety rules in order to make that on-time delivery, and coercion will carry stiff financial penalties.
“The driver coercion rule-making could be the most significant change we’ve seen in transportation in our lifetime,” Mike Regan, chief relationship officer at TranzAct Technologies, told the more than 200 shippers, carriers and brokers at the conference.
“How many of you are now prepared to verify that when a truck driver pulls up to your dock, he has the hours available to move your freight?” Regan asked. No one in the audience, which included more than a few receivers and shippers of freight, raised their hand.
Not being prepared could be costly. The rule-making in question would hit offenders, including motor carriers, logistics operators and shippers, with penalties of up to $11,000 per incident, and possible revocation of the operating authority of a carrier, freight broker or forwarder.
Focus on the Future, but not at the Expense of Today
Regardless of how your numbers stack against benchmarked industry averages, it is important to not only think about the future, but also to deal with the complexity of today. Today there are too few drivers, costs are rising, and staying ahead of the technology curve while being one way to grow a business is often overwhelming. Staying on top of today’s developments in the industry will provide you with a roadmap to the future. With sound awareness of benchmarking and diligent, accurate profit performance management, you will be on the right path to a proper transportation cost analysis that allows you to operate acontinually profitable business not only today but in the future as well. For help with effective cost analysis and management for your company.XXX . V0000 Logistics and Transportation Expenses: Understanding Their Role in the Cost of Doing Business

As logistics and transportation expenses take a larger bite out of every sales dollar, companies must continually analyze their freight expense relationship to their overall cost of doing business. Unfortunately, many companies lack the technical expertise to accomplish these analyses and therefore usually end up spending more on transportation services then they really need to. To add insult to injury, they also rarely have reporting mechanisms to properly monitor those expenses.
Transportation Expenses Correlate Directly to Business Changes
This is especially true when companies consider revising sales and marketing programs by reducing or eliminating freight costs to their customers in exchange for larger sales order dollars. Take for instance a real life example of a company whose sales and marketing team decided they would begin to prepay and absorb all transportation expenses for any customer orders over $1500.00. The goal obviously is to entice their customers to buy more product and in return receive what would in effect be “Free Shipping.” Certainly a great marketing concept as long as all of the pieces fit nicely together.Upon discussions with the sales and marketing team, the client’s transportation and logistics group immediately drafted a list of issues it felt needed to be addressed in order to make a good business decision, one that would ensure the company would not negatively impact its overall profit margin.
 First, there would now be a significant increase in the number of freight invoices the company would have to process through its Accounts Payable Department. The transportation and logistics group determined the increase in the number of invoices to be processed for payment would be in excess of 250% when compared to what the payables group was currently processing. Secondly, how would the Accounts Payable Department handle such a huge increase in volume without increasing its staff? The answer was clear, there was no way they could handle the increase in invoice processing volume with its current staff; clearly additional trained staff resources would be required.
That led to another discussion; perhaps it was time to finally outsource the freight bill audit and payment process to a third party. When that analysis was completed the ultimate decision to outsource freight audit and payment was truly a “no-brainer.” You see no one in the company had any expertise in freight bill auditing and therefore the company could not be assured of payment accuracy on such large volumes of freight invoices. In addition, the shipment data the company would receive as a by-product of the outsourced audit and payment process would be invaluable in making good business decisions in the future. And finally, the company determined the costs to outsource the freight bill audit and payment process would be less than half of what the company had budgeted to perform the function in house with an increased and knowledgeable audit staff.
Everything seemed to be falling into place until several months into the process the company realized they were having a serious problem with spiraling transportation expenses. You see the company’s shipment data which came directly from the Outsourced Freight Audit and Payment firm revealed increasing freight expenses that the company had not anticipated, nor budgeted for. How was this possible? The company was on a mission to find out why.
Expert Transportation Expenses Analysis Tells the Whole Story to the Cost of Doing Business
After exhaustive analysis our team of experts uncovered the following facts that led to the significant increase in the client’s transportation expenses.- When the company established their base rate levels with their freight carriers, they did not take into account impending Annual General Rate Increases by their parcel carriers. These increases averaged around 7% based on the shipping characteristics of the company.
- The company also did not take into account the Annual General Rate Increase implemented by their preferred motor carriers. While the freight carriers indicated their average rate increase was in the 5.5% to 6% range what we found was the company shipped its products out of the NY Metropolitan region and therefore the ACTUAL increase this company incurred was more like 14% overall.
- The company also began shipping larger volumes of product to their customers’ homes through their new on-line retail operation. Now their transportation expenses were not only being impacted by the General Rate Increases, but also by Residential Delivery Charges as well.
- Finally, the company added new items to its product line that drastically changed their former shipment characteristics. The new product line was lighter and bulkier and the products took up more space in the carrier’s vehicles and therefore immediately equated to higher transportation expenses. The fact is for these new and bulkier items, the company’s freight expenses increased by a whopping 50%.
So what’s the moral of the story? Before a company makes a decision to change current sales and marketing programs; before it decides to add new items to its product line; before it decides to move into home deliveries, there should be a serious discussion with those in the know of these business decisions effect transportation expenses. The focus of these discussions is to question every thought process, by every stake holder to make sure all possible contingencies have been thoroughly thought out and properly analyzed. If the company does not have the expertise in house to identify and question these issues, there are certainly many transportation and logistics services providers who make their living walking their client’s through the maze of transportation and logistics operations, expenses and strategies to ensure they make the right decision.
XXX . V000000 Estimated Costs for Production, Storage and Transportation of Switch grass
The bio economy is the focus of research and discussion as a way to reduce dependence on imported oil, provide some relief from green house gas emissions and increase the use of agricultural products. Biofuels are a significant component of the bioeconomy. Ethanol and biodiesel are the primary biofuels used today.
In the United States, ethanol is primarily produced from corn. However, there is a considerable amount of research and development occurring to develop the capability to produce ethanol from cellulous material.
Switchgrass is one of the major plants considered in discussions of cellulous ethanol. Switchgrass (Panicum virgatum L.) is a perennial warm-season grass native to Iowa. In the past, it has been evaluated as an energy crop but primarily to replace coal. Using switchgrass to produce ethanol is a new use.
This report updates earlier production cost estimates for switchgrass. The earlier estimations were completed as a part of the study using switchgrass to replace coal. This information is available in Iowa State University (ISU) Extension publication Costs of Producing Switchgrass for Biomass in Southern Iowa, PM 1866). For more information on the agronomic aspects of switchgrass production, see the ISU Extension publication Switchgrass (AG 200).
The estimated costs of production are presented here in two sections. The first is the estimated costs. This is followed by a discussion of what could happen if we change the initial assumptions used to estimate the costs. Switchgrass costs are presented in three categories. The first is the production costs, which include establishment, reseeding and annual production. Next are the transportation costs; the final cost category considered here is storage.
Production Establishment
We make several assumptions based on 2001 research findings, with costs updates using 2007 estimates. The Information File 2007 Iowa Farm Custom Rate Survey was used to compute machinery costs. Other costs come from the Information File Estimated Costs of Crop Production in Iowa - 2007. Seed and chemical prices come from expert opinion.Assumptions
(Note that these assumptions will be relaxed later, but they are used for the illustration that follows)
- The switchgrass is frost-seeded with a 25 percent probability of needing to reseed the stand
- The land charge assumed is $80 per acre
- Switchgrass yield is 4 tons per acre
- The switchgrass stand is assumed to last 11 years
- The reseed is assumed to last 10 years
- The interest rate used for prorating the establishment costs is 8 percent, while the operating interest rate is 9 percent
- Operating costs are assumed to be borrowed for six months
- The field is initially prepared by adding phosphorous and potassium. There is also an application of lime assumed.

It is assumed that a field needs to be reseeded 25 percent of the time. Basic ground preparation and lime are not included for the reseeding.

Assumptions
- A 4 ton per acre yield.
- 100 pounds of nitrogen (N) is used. The herbicides listed are examples. Phosphorus and potassium are at removal rates.
- Harvesting is done in mid to late November. It will be mowed, raked and baled, using a large square baler. Bales are 3x4x8 feet, with a weight of 950 pounds.
- The bottom of Table 3 also presents the total estimated costs for producing switchgrass. Production costs are the sum of the establishment costs, the prorated reseeding costs and the annual production costs.

Storage
Previous studies estimated the costs for storing switchgrass. The options considered include storing in: an open field, an open field on crushed rock covered with a tarp, an enclosed structure, and a pole building with open sides. These studies found that the enclosed building is the most expensive type of storage, but, because maintaining quality of switchgrass is very important for ethanol production, it is the method selected here. (Note that if switchgrass is used as a coal replacement, the quality consideration is not as critical and another storage option might be considered.)The costs of storing include not only the cost for the facility or method used but also include the value of the switchgrass in storage and dry matter loss associated with the various storage methods.
The estimated storage costs are presented in Table 4 for an enclosed building. (These cost assumptions are relaxed in later discussions.)

Since there are various types of enclosed buildings, we make several assumptions.
Assumptions
- The structure is a tarped hoop type structure and holds 5,454 bales or 2,591 tons.
- Assume a cost of $12 per square foot for the finished building.
- Dimensions are 100x300 feet (30,000 square feet).
- The bales weigh 950 pounds or 0.475 tons and are 3x4x8 feet.
- The bales are stacked 20 feet high or six bales high.
- The building and area are assumed to take two acres. The extra space is for building edging, driveways and turnaround space for semi-trucks.
Transportation and Handling
Transportation and storage logistics will vary depending on the situation, so again, we make some assumptions.Assumptions
- For these estimates, the switchgrass bales are staged along the edge of the field. This cost is included in the production budget. A farmer with a typical tractor and bale fork can perform these duties.
- Another transportation cost is collecting, delivering and unloading the bales into a storage facility. A semi-trailer holding 20 tons (or 42 bales) is used to haul the switchgrass. Estimated times are 30 minutes to load the truck and 20 minutes to unload. The charge for the semi is $70 per hour.
- A typical tractor and bale hauler will not work to stack large square bales 20 feet high. More specialized equipment is needed for this task. Estimated costs of such a tractor were $20 per hour and $10.78 worth of fuel per hour. The operator charge is $12 per hour.

There are two comments regarding these cost estimates. The loading and travel time to take the semi from field to field and then to a storage facility may be underestimated. It is possible, too, that if enough farmers raise switchgrass, they can haul it to the facilities themselves. This would change the cost estimates. However, the estimates used here present the opinions of several farmers who grow switchgrass.
Table 6 shows the total estimated costs for switchgrass. This includes production, storage and transportation.

Alternative Assumptions
Estimating the cost of producing any crop will vary depending upon the assumptions made. Making assumptions is necessary, however, because we can’t model each individual farm, field, and situation. By varying some of the key assumptions we can determine areas that are the most critical in estimating the costs of production.


The Future
The future of switchgrass production depends upon its potential commercial uses. If switchgrass is used as a feedstock for ethanol, replacement for coal or other technologies, further research is needed to increase yields.As shown in Figure 1, increasing yield will have the biggest impact on reducing the costs of switchgrass for any energy use.
The Conservation Reserve Program (CRP) may also play a role in the future of switchgrass. If green payments would be added to a switchgrass rotation on CRP land, there would be a larger economic incentive for producers. Switchgrass is a good alternative because it can be grown on marginal land and offers erosion control as well as other environmental benefits.
For switchgrass to become a commercially viable crop, there must be available markets. For cropland, there must be a sufficient economic incentive for producers to change their rotation systems. More efficient harvesting and transportation methods must be adapted to improve profitability. In addition, logistical issues must be addressed and, perhaps most important, the issues of handling and storage must be addressed.
Switchgrass can become a viable bioenergy crop. The engineering is being refined. But, before switchgrass can become viable commercially, key farmer issues must be addressed.
XXX . V000000 Transportation Costs
Introduction
The cost of transportation infrastructure and services influences the ability to provide and
maintain facilities and services. Ultimately, it impacts the cost of using those facilities and
potentially the demand for travel and ultimately the contribution of travel to the quality of life.
Thus, transportation costs are a critical consideration in transportation planning and decision making.
For example, if costs preclude constructing sufficient capacity, it can lead to congestion
which ultimately impacts quality of life and business competitiveness in Florida. A road not
properly maintained could lead to unsafe driving conditions affecting travel safety. An increase
in fuel prices may hinder personal travel choices and impact household spending. In a word,
transportation costs directly and indirectly influence congestion levels, business competitiveness,
travel safety, and household spending.
This report is part of a series of reports on
transportation funding. The Transportation Resources
and Transportation Investments reports portray the
nature of transportation funding by various entities.
They provide the reader with an overall picture of
transportation revenue sources and investments. The purpose of this report, Transportation
Costs, is to compile and report on trends in various components of costs associated with
transportation infrastructure and services.
It is important to distinguish between transportation costs (amounts paid or charged for inputs)
and transportation spending (amounts expended by a firm or agency through its capital and
operating budget). Transportation costs generally include such inputs as raw materials,
equipment, fuel, or labor. Transportation spending categories within the Florida Department of
Transportation (FDOT), for example, include product/product delivery, product support,
operations and maintenance, and administration. Although the two are related and spending
levels can influence actual costs (as supply and demand for services interrelate), changes in
transportation spending are much more related to available revenues than to changes in costs.
This report focuses on typical costs incurred by FDOT and some other public-sector
transportation agencies in Florida. While such items as fuel costs impact transportation users as
well as transportation providers, this report does not include detailed statistics about vehicle
operating costs, motor fuel taxes and registration fees, other transportation fees such as tolls,
the value of time lost to congestion, crash-related costs or other components of user costs.
These costs are beyond the scope of this report and are well documented in other reports .
Motion planning with movement primitives for cooperative aerial transportation in obstacle environment
this presents a motion planning approach for cooperative transportation using aerial robots. We describe a framework based on Parametric Dynamic Movement Primitives (PDMPs) for coordinating multiple aerial robots and their manipulators quickly in an environment cluttered with obstacles. In order to emulate the optimal motion, we combine PDMPs and Rapidly Exploring Randomized Trees star (RRT*) by using the results of RRT* as demonstrations for PDMPs. For efficient description of the motions corresponding to the environment, we utilize Gaussian Process Regression (GPR) to acquire of the explicit relationship between environmental parameters and style parameters of PDMPs which decide the motions. Simulation and experiment results are attached to validate the proposed framework.
Introduction mini transportation to compare :
Aerial robots are promising research platforms as bodies of mobile manipulators due to their wide workspace through the air. Among the various types of aerial platforms, multi-rotor based aerial manipulators are developed to cope with complex, narrow workspace. The advantage that comes from their small dimension enables the multi-rotors to perform tasks such as daily-life manipulations as well as operations at high altitudes.
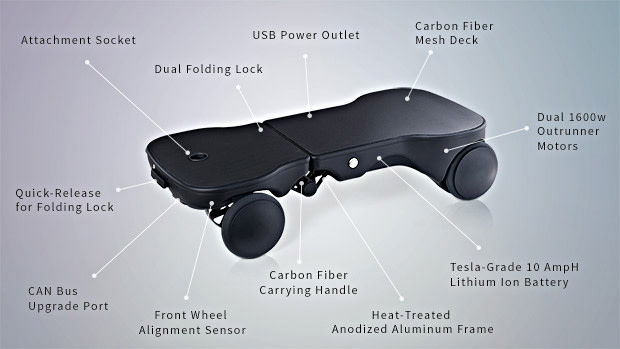
With a unique drive system often used in robotics, the Moboster doesn't require tilting, shifting, or balancing to steer, making it extremely stable and easy to master. All maneuvering is done through a specially-designed remote control.

You don't even need to be on the Moboster to drive it.

When you power up, the dual-motor back wheels auto-start in brake mode, so you can step on with confidence. Anyone can learn to ride the Moboster in SECONDS.

Lightweight and foldable, the Moboster goes where you go. You’ll never have to worry about where to leave your vehicle again.

Above deck add-ons and hardware upgrades allow Moboster to be more than just a one-use vehicle, but instead, a multi-purpose moving platform.

*The handlebar in the image is a sample design and will be redesigned before final production.
Handlebars, seats, cargo containers, camera stabilizers, and whatever you can think of, can all be attached in place with the Attachment Socket. We personally would love to make the Go-Kart seats when we can.
The Upgrade Port, situated at the front of Moboster, allows future hardware add-ons to fully utilize the vehicle's robotic drive system, unleashing its true potential. Here are some examples:
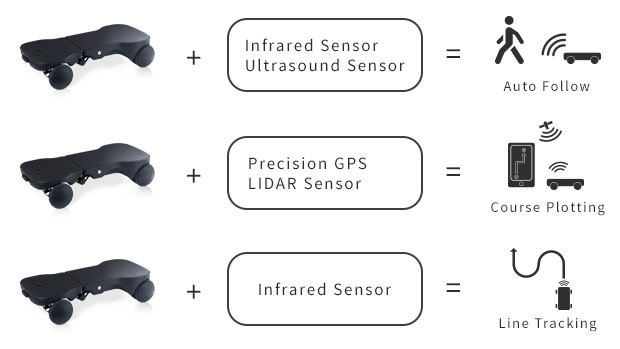
We believe the upgrades and add-ons as the true value of Moboster and is working hard to bring them to our users as quickly as possible. With your support, Moboster can start auto-following you in no time!
The 5V USB Power Output designed to charge the remote control can also charge all your electronic goodies. The high capacity battery can charge an iPhone 7 from empty to full 22 times. Your phone will never run out of juice again.

Quick Specs
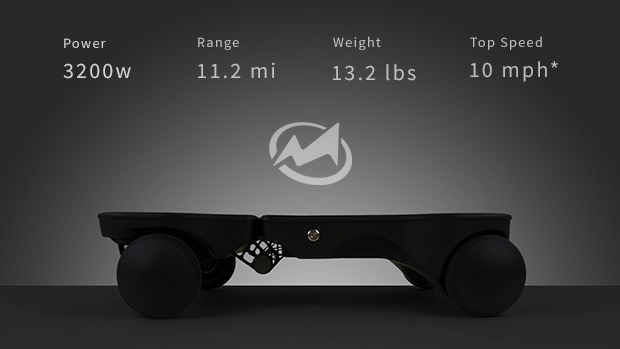
*We limited the top speed and diverted power to torque to keep Moboster safe and highly maneuverable in urban environments.
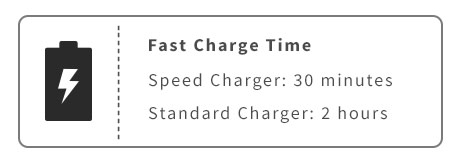


What can Moboster do for you now?
- Daily commuters can easily carry Moboster onto buses or subways without bumping into someone with their vehicle.
- Students can save time and energy from walking around big campuses. Moboster can easily be stored in lockers or under your seats.
- Drivers can leave Moboster in the trunk in case of unexpected empty gas, or when you can't find a good parking space.
- Carrying heavy groceries to your car will be a breeze.
- Kids will have a blast sitting on the Moboster and ride it like a giant RC car.

What makes the Moboster so easy to ride?
Riding on four wheels, the Moboster has an obvious advantage towards stability. But unlike skateboards, the robotic drive system maneuvers by using wheel speed differentiation and it's controlled by a precision Bluetooth remote, eliminating the need to shift your balance to turn. Moboster stays parallel to the ground at all times.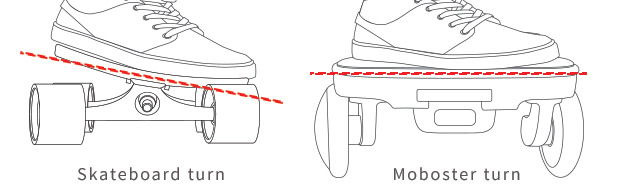

The Remote-Controller also have a Crusie Control button for those wide open roads.
While riding, the front wheel sensors constantly monitor alignment, and through advanced algorithms, adjust individual motor speed accordingly to eliminate front wheel drag and misalignment.
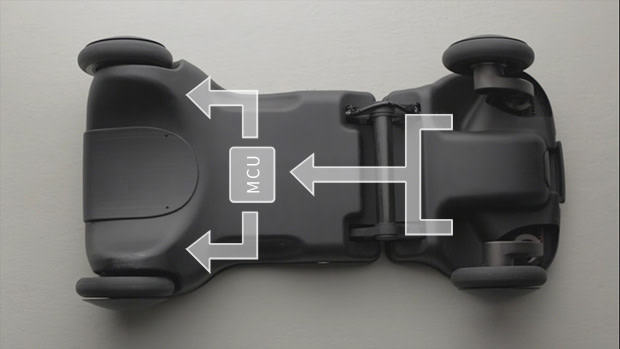
Portability is practicality
In order to blend seamlessly with each rider’s commuting preferences, keeping the Moboster portable was crucial. We want the Moboster to be right there whenever you need it. By using premium materials such as carbon fiber and heat-treated aluminum, combined with amazing engineering, the Moboster weighs less than half of a hoverboard but can carry weights up to 330 lbs.
The foldable body allow easy storage and carrying without sacrificing standing space. While riding, the dual-lock mechanism keeps Moboster flat and away from unexpected folding. The locks can be quickly disengaged with a simple lever at the front of the Moboster.
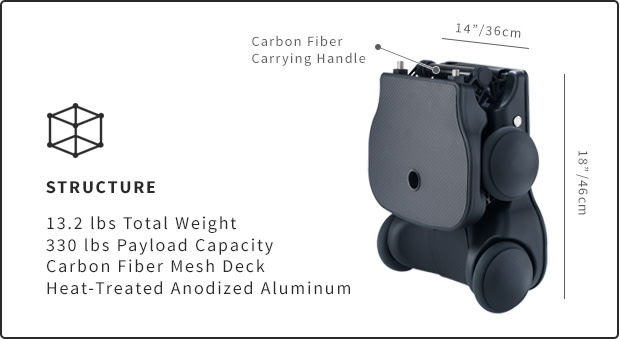
Small socket, big revolution
The on-deck attachment socket can house various add-on accessories like handlebars, seats, and much more. The Moboster’s unique drive system, flat stable surface, and its 330-lbs payload capacity together ensure that you are no longer confined to use your vehicle one way, instead, it comes with endless possibilities.
Smart vehicles get smarter
With its robot-like maneuverability, the true potential of the Moboster lies in the capacity to take on additional hardware and sensors so it can continuously evolve and transform itself. The CAN Bus Upgrade Port would allow multiple sensors to communicate with the microcontroller through a single pathway, and custom software API will ensure easy integration. Moboster will become the core platform for a new generation of modular transportation. We plan to work with the developer community to create a fascinating future for the Moboster.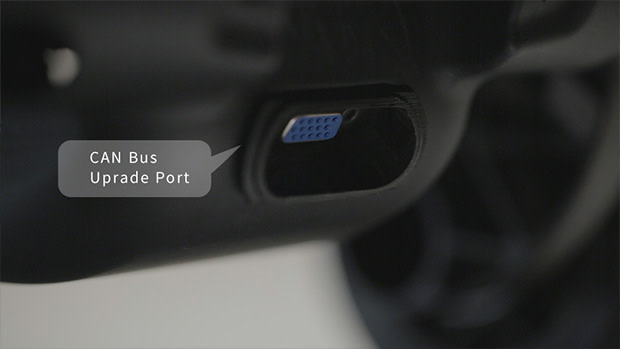

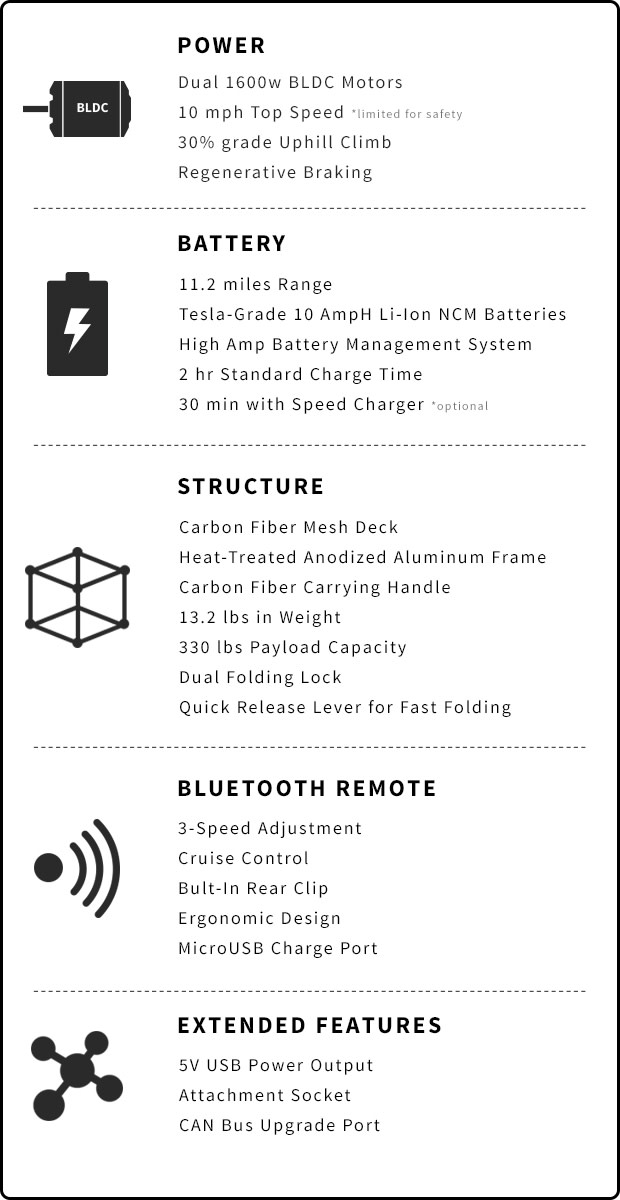

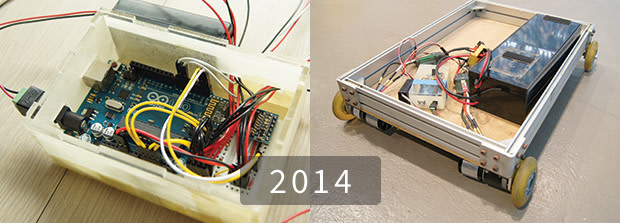

Moboster is currently a fully functional prototype built with mass production specifications. Our team of engineers has extensive manufacturing and sourcing experience, so we are very confident that the Moboster can and will be produced. The challenge will be to match our quality standards with the timeline for development and tooling, and this is where funding becomes most necessary. With substantial funding, we can accomplish more by using advanced tooling methods and shorten the adjustment time, meaning there will be more time to ensure the final product is on par with our quality standards. The biggest risk will be during the manufacturing process, where delays could happen due to reasons outside of our control.


Q. Is Moboster an electric skateboard?
A. Not at all. Moboster was designed from the ground up and relies on a very different drive system to maneuver when compared to an electric skateboard.
Q. What makes Moboster different from other electric rideables?
A. Moboster is a unique platform that utilizes a robotic drive system very similar to ones you see in most wheeled robots (like the ones you see in battlebots).
Q. What’s so good about robotic drive systems?
A. The system uses wheel speed differentiation to turn left and right, which means Moboster stays parallel to the ground at all times.
Electronics factory isometric composition with engineer monitoring robotic conveyor and workers stacking production into boxes vector illustration :
Similar images
Tidak ada komentar:
Posting Komentar