

Hybrid Networking

With the ever-increasing growth of media-rich applications from traditional video to virtual meeting/classrooms to tactile internet, the future networking paradigm will go away from a networking concept based on single-technology, single-flow, single-route model of information transfer, pushing the issues of usage prediction, integrated resource utilization and parallelism to all layers of protocol stack. Recent successful approaches, such as multi-homing, overlay networking, and distributed storage, deviate from this paradigm by using intelligent control to take advantage of redundancy and path diversity that already exists in the modern networks to provide a better experience to end-users.
Rather than treating the heterogeneous nature of the network and diversity of access technologies as an afterthought, this proposal considers an integrated approach that systematically takes advantage of various hybrid networking techniques to improve upon the network experience in general, and in particular upon latency in media-rich applications. These techniques include content caching, multicasting, multi-homing, multi-user coding, as well as braiding satellite+wifi+cellular technologies.
Introduction To Data Communications

Network Management
The Three Faces of Networking

Circuits (Data Communications and Networking)

Circuit Configuration
Circuit configuration is the basic physical layout of the circuit. There are two fundamental circuit configurations: point-to-point and multipoint. In practice, most complex computer networks have many circuits, some of which are point-to-point and some of which are multipoint.
Figure 3.1 illustrates a point-to-point circuit, which is so named because it goes from one point to another (e.g., one computer to another computer). These circuits sometimes are called dedicated circuits because they are dedicated to the use of these two computers. This type of configuration is used when the computers generate enough data to fill the capacity of the communication circuit. When an organization builds a network using point-to-point circuits, each computer has its own circuit running from itself to the other computers. This can get very expensive, particularly if there is some distance between the computers.

Figure 3.1 Point-to-point circuit
Figure 3.2 shows a multipoint circuit (also called a shared circuit). In this configuration, many computers are connected on the same circuit. This means that each must share the circuit with the others. The disadvantage is that only one computer can use the circuit at a time. When one computer is sending or receiving data, all others must wait. The advantage of multipoint circuits is that they reduce the amount of cable required and typically use the available communication circuit more efficiently. Imagine the number of circuits that would be required if the network in Figure 3.2 was designed with separate point-to-point circuits. For this reason, multipoint configurations are cheaper than point-to-point circuits. Thus, multipoint circuits typically are used when each computer does not need to continuously use the entire capacity of the circuit or when building point-to-point circuits is too expensive. Wireless circuits are almost always multipoint circuits because multiple computers use the same radio frequencies and must take turns transmitting.
Data Flow
Circuits can be designed to permit data to flow in one direction or in both directions. Actually, there are three ways to transmit: simplex, half-duplex, and full-duplex (Figure 3.3).
Simplex is one-way transmission, such as that with radios and TVs.
Half-duplex is two-way transmission, but you can transmit in only one direction at a time. A half-duplex communication link is similar to a walkie-talkie link; only one computer can transmit at a time.

Figure 3.2 Multipoint circuit

Figure 3.3 Simplex, half-duplex, and full-duplex transmissions
Computers use control signals to negotiate which will send and which will receive data. The amount of time half-duplex communication takes to switch between sending and receiving is called turnaround time (also called retrain time or reclocking time). The turnaround time for a specific circuit can be obtained from its technical specifications (often between 20 and 50 milliseconds). Europeans sometimes use the term simplex circuit to mean a half-duplex circuit.
With full-duplex transmission, you can transmit in both directions simultaneously, with no turnaround time.
How do you choose which data flow method to use? Obviously, one factor is the application. If data always need to flow only in one direction (e.g., from a remote sensor to a host computer), then simplex is probably the best choice. In most cases, however, data must flow in both directions.
The initial temptation is to presume that a full-duplex channel is best; however, each circuit has only so much capacity to carry data. Creating a full-duplex circuit means that the available capacity in the circuit is divided—half in one direction and half in the other. In some cases, it makes more sense to build a set of simplex circuits in the same way a set of one-way streets can speed traffic. In other cases, a half-duplex circuit may work best. For example, terminals connected to mainframes often transmit data to the host, wait for a reply, transmit more data, and so on, in a turn-taking process; usually, traffic does not need to flow in both directions simultaneously. Such a traffic pattern is ideally suited to half-duplex circuits.
Multiplexing
Multiplexing means to break one high-speed physical communication circuit into several lower-speed logical circuits so that many different devices can simultaneously use it but still "think" that they have their own separate circuits (the multiplexer is "transparent"). It is multiplexing (specifically, wavelength division multiplexing [WDM], discussed later in this section) that has enabled the almost unbelievable growth in network capacity discussed in last topic; without WDM, the Internet would have collapsed in the 1990s.
Multiplexing often is done in multiples of 4 (e.g., 8, 16). Figure 3.4 shows a four-level multiplexed circuit. Note that two multiplexers are needed for each circuit:

Figure 3.4 Multiplexed circuit
The primary benefit of multiplexing is to save money by reducing the amount of cable or the number of network circuits that must be installed. For example, if we did not use multiplexers in Figure 3.4, we would need to run four separate circuits from the clients to the server. If the clients were located close to the server, this would be inexpensive. However, if they were located several miles away, the extra costs could be substantial.
There are four types of multiplexing: frequency division multiplexing (FDM), time division multiplexing (TDM), statistical time division multiplexing (STDM), and WDM.
Frequency Division Multiplexing Frequency division multiplexing (FDM) can be described as dividing the circuit "horizontally" so that many signals can travel a single communication circuit simultaneously. The circuit is divided into a series of separate channels, each transmitting on a different frequency, much like series of different radio or TV stations. All signals exist in the media at the same time, but because they are on different frequencies, they do not interfere with each other.
Figure 3.5 illustrates the use of FDM to divide one circuit into four channels. Each channel is a separate logical circuit, and the devices connected to them are unaware that their circuit is multiplexed. In the same way that radio stations must be assigned separate frequencies to prevent interference, so must the signals in a FDM circuit. The guardbands in Figure 3.5 are the unused portions of the circuit that separate these frequencies from each other.
With FDM, the total capacity of the physical circuit is simply divided among the multiplexed circuits. For example, suppose we had a physical circuit with a data rate of 64 Kbps that we wanted to divide into four circuits. We would simply divide the 64 Kbps among the four circuits and assign each circuit 16 Kbps. However, because FDM needs guardbands, we also have to allocate some of the capacity to the guardbands, so we might actually end up with four circuits, each providing 15 Kbps, with the remaining 4 Kbps allocated to the guardbands. There is no requirement that all circuits be the same size, as you will see in a later section. FDM was commonly used in older telephone systems, which is why the bandwidth on older phone systems was only 3,000 Hz, not the 4,000 Hz actually available—1,000 Hz were used as guardbands, with the voice signals traveling between two guardbands on the outside of the channel.
 circuit")
Figure 3.5 Frequency division multiplex (FDM) circuit
Time Division Multiplexing Time division multiplexing (TDM) shares a communication circuit among two or more terminals by having them take turns, dividing the circuit vertically, so to speak. Figure 3.6 shows the same four terminals connected using TDM. In this case, one character is taken from each computer in turn, transmitted down the circuit, and delivered to the appropriate device at the far end (e.g., one character from computer A, then one from B, one from C, one from D, another from A, another from B, and so on). Time on the circuit is allocated even when data are not being transmitted, so that some capacity is wasted when terminals are idle. TDM generally is more efficient than FDM because it does not need guardbands. Guardbands use "space" on the circuit that otherwise could be used to transmit data. Therefore, if one divides a 64-Kbps circuit into four circuits, the result would be four 16-Kbps circuits.
Statistical Time Division Multiplexing Statistical time division multiplexing (STDM) is the exception to the rule that the capacity of the multiplexed circuit must equal the sum of the circuits it combines.
 circuit")
Figure 3.6 Time division multiplex (TDM) circuit
STDM allows more terminals or computers to be connected to a circuit than does FDM or TDM. If you have four computers connected to a multiplexer and each can transmit at 64 Kbps, then you should have a circuit capable of transmitting 256 Kbps (4 x 64 Kbps). However, not all computers will be transmitting continuously at their maximum transmission speed. Users typically pause to read their screens or spend time typing at lower speeds. Therefore, you do not need to provide a speed of 256 Kbps on this multiplexed circuit. If you assume that only two computers will ever transmit at the same time, 128 Kbps would be enough. STDM is called statistical because selection of transmission speed for the multiplexed circuit is based on a statistical analysis of the usage requirements of the circuits to be multiplexed.
The key benefit of STDM is that it provides more efficient use of the circuit and saves money. You can buy a lower-speed, less-expensive circuit than you could using FDM or TDM. STDM introduces two additional complexities. First, STDM can cause time delays. If all devices start transmitting or receiving at the same time (or just more than at the statistical assumptions), the multiplexed circuit cannot transmit all the data it receives because it does not have sufficient capacity. Therefore, STDM must have internal memory to store the incoming data that it cannot immediately transmit. When traffic is particularly heavy, you may have a 1- to 30-second delay. The second problem is that because the logical circuits are not permanently assigned to specific devices as they are in FDM and TDM, the data from one device are interspersed with data from other devices. The first message might be from the third computer, the second from the first computer, and so on. Therefore, we need to add some address information to each packet to make sure we can identify the logical circuit to which it belongs. This is not a major problem, but it does increase the complexity of the multiplexer and also slightly decreases efficiency, because now we must "waste" some of the circuit’s capacity in transmitting the extra address we have added to each packet.
Wavelength Division Multiplexing Wavelength division multiplexing (WDM) is a version of FDM used in fiber-optic cables. When fiber-optic cables were first developed, the devices attached to them were designed to use only one color of light generated by a laser or LED. With one commonly used type of fiber cable, the data rate is 622 Mbps (622 million bits per second). At first, the 622-Mbps data rate seemed wonderful. Then the amount of data transferred over the Internet began doubling at fairly regular intervals, and several companies began investigating how we could increase the amount of data sent over existing fiber-optic cables.
The answer, in hindsight, was obvious. Light has different frequencies (i.e., colors), so rather than building devices to transmit using only one color, why not send multiple signals, each in a different frequency, through the same fiber cable? By simply attaching different devices that could transmit in the full spectrum of light rather than just one frequency, the capacity of the existing fiber-optic cables could be dramatically increased, with no change to the physical cables themselves.
WDM works by using lasers to transmit different frequencies of light (i.e., colors) through the same fiber-optic cable. As with FDM, each logical circuit is assigned a different frequency, and the devices attached to the circuit don’t "know" they are multiplexed over the same physical circuit.
NASA’s Ground Communications Network
MANAGEMENT FOCUS
NASA’s communications network is extensive because its operations are spread out around the world and into space. The main Deep Space Network is controlled out of the Jet Propulsion Laboratory (JPL) in California. JPL is connected to the three main Deep Space Communications Centers (DSCCs) that communicate with NASA spacecraft. The three DSCCs are spread out equidistantly around the world so that one will always be able to communicate with spacecraft no matter where they are in relation to the earth: Canberra, Australia; Madrid, Spain; and Goldstone, California.
Figure 3.7 shows the JPL network. Each DSCC has four large-dish antennas ranging in size from 85 to 230 feet (26 to 70 meters) that communicate with the spacecraft. These send and receive operational data such as telemetry, commands, tracking, and radio signals. Each DSCC also sends and receives administrative data such as e-mail, reports, and Web pages, as well as telephone calls and video.
The three DSCCs and JPL use Ethernet local area networks (LANs) that are connected to multiplexers that integrate the data, voice, and video signals fortransmission. Satellite circuits are used between Canberra and JPL and Madrid and JPL. Fiber-optic circuits are used between JPL and Goldstone.
Dense WDM (DWDM) is a variant of WDM that further increases the capacity of WDM by adding TDM to WDM. Today, DWDM permits up to 40 simultaneous circuits, each transmitting up to 10 Gbps, giving a total network capacity in one fiber-optic cable of 400 Gbps (i.e., 400 billion bits per second). Remember, this is the same physical cable that until recently produced only 622 Mbps; all we’ve changed are the devices connected to it.
DWDM is a relatively new technique, so it will continue to improve over the next few years. As we write this, DWDM systems have been announced that provide 128 circuits, each at 10 Gbps (1.28 terabits per second [1.28 Tbps]) in one fiber cable. Experts predict that DWDM transmission speeds should reach 25 Tbps (i.e., 25 trillion bits per second) within a few years (and possibly 1 petabit [Pbps], or 1 million billion bits per second)—all on that same single fiber-optic cable that today typically provides 622 Mbps. Once we reach these speeds, the most time-consuming part of the process is converting from the light used in the fiber cables into the electricity used in the computer devices used to route the messages through the Internet. Therefore, many companies are now developing computer devices that run on light, not electricity.
Inverse Multiplexing Multiplexing uses one high-speed circuit to transmit a set of several low-speed circuits. It can also be used to do the opposite. Inverse multiplexing (IMUX) combines several low-speed circuits to make them appear as one high-speed circuit to the user (Figure 3.8).
One of the most common uses of IMUX is to provide T1 circuits for WANs. T1 circuits provide data transmission rates of 1.544 Mbps by combining 24 slower-speed circuits (64 Kbps). As far as the users are concerned, they have access to one highspeed circuit, even though their data actually travel across a set of slower circuits.
Until recently, there were no standards for IMUX. If you wanted to use IMUX, you had to ensure that you bought IMUX circuits from the same vendor so both clients or hosts could communicate.

Figure 3.7 NASA’s Deep Space Communications Centers ground communications network. MUX = multiplexer
Several vendors have recently adopted the BONDING standard (Bandwidth on Demand Interoperability Networking Group). Any IMUX circuit that conforms to the BONDING standard can communicate with any other IMUX circuit that conforms to the same standard. BONDING splits outgoing messages from one client or host across several low-speed telephone lines and combines incoming messages from several telephone lines into one circuit so that the client or host "thinks" it has a faster circuit.
The most common use for BONDING is for room-to-room videoconferencing. In this case, organizations usually have the telephone company install six telephone lines into their videoconferencing room that are connected to the IMUX. (The telephone lines are usually 64-Kbps ISDN telephone lines.) When an organization wants to communicate with another videoconferencing room that has a similar six-telephone-line IMUX configuration, the first IMUX circuit uses one telephone line to call the other IMUX circuit on one of its telephone lines. The two IMUX circuits then exchange telephone numbers and call each other on the other five lines until all six lines are connected. Once the connection has been established, the IMUX circuits transmit data over the six lines simultaneously, thus giving a total data rate of 6 x 64 Kbps = 384 Kbps.

Figure 3.8 Inverse multiplexer
Get More Bandwidth for Less
MANAGEMENT FOCUS
Upstart network provider Yipes is among the first to offer metropolitan area network services based on wavelength division multiplexing (WDM). It offers circuits that range from 1 Mbps up to 1 Gbps in 1-Mbps increments and costs anywhere between 10 percent and 80 percent of the cost of traditional services. The challenge Yipes faces is to expand its WDM services beyond the MAN.
How DSL Transmits Data
The reason for the limited capacity on voice telephone circuits lies with the telephone and the switching equipment at the telephone company offices. The actual twisted-pair wire in the local loop is capable of providing much higher data transmission rates. Digital subscriber line (DSL) is one approach to changing the way data are transmitted in the local loop to provide higher-speed data transfer. DSL is a family of techniques that combines analog transmission and FDM to provide a set of voice and data circuits. There are many different types of DSL, so many in fact that DSL is sometimes called xDSL, where the x is intended to represent one of the many possible flavors.
With DSL, a DSL modem (called customer premises equipment [CPE]) is installed in the customer’s home or office and another DSL modem is installed at the telephone company switch closest to the customer’s home or office. The modem is first an FDM device that splits the physical circuit into three logical circuits: a standard voice circuit used for telephone calls, an upstream data circuit from the customer to the telephone switch, and a downstream data circuit from the switch to the customer. TDM is then used within the two data channels to provide a set of one or more individual channels that can be used to carry different data. A combination of amplitude and phase modulation is used in the data circuits to provide the desired data rate (the exact combination depends on which flavor of DSL is used).2 One version of DSL called G.Lite ASDL provides one voice circuit, a 1.5-Mbps downstream circuit, and a 384-Kbps upstream channel.
What Does a Data Center Do in computer communication networking
In recent years, Internet companies such as Google, Microsoft, Facebook, and Amazon (as well as their counterparts in Asia and Europe) have built massive data centers, each housing tens and thousands of hosts, and concurrently supporting many distinct applications (e.g., search, mail, social networking, and e-commerce). Each data center has its own data center network that interconnects its hosts with each other and interconnects the data center with the internet. In this section, we provide a brief introduction to data center networking for cloud applications.
The cost of a large data center is huge, exceeding $12 million per month for a 100,000 host data center . Of these costs, about 45 percent can be attributed to the hosts themselves (which need to be replaced every 3-4 years); 25 percent to infrastructure, including transformers, uninterruptable power supplies (UPS) systems, generators for long-term outages, and cooling systems; 15 percent for electric utility costs for the power draw; and 15 percent for networking, including network gear (switches, routers, and load balancers), external links, and transit traffic costs. (in these percentages, cost for equipment are amortized so that a common cost metric is applied for one-time purchases and ongoing expenses such as power). While networking is not the largest cost, networking is the key to reducing overall cost and maximizing performance.
The worker bees in a data center are the hosts: They serve content (e.g web pages and videos), store emails and documents, and collectively perform massively distributed computations (e.g. distributed index computations for search engines). The hosts in data centers, called blades and resembling pizza boxes, are generally commodity hosts that include CPU, memory, and disk storage.
The hosts are stacked in racks, with each rack typically having 20 to 40 blades. At the top of each rack there is a switch , aptly named the Top of Rack (TOR) switch, that interconnects the hosts in the rack with each other and with other switches in the data center. Specifically, each host in the rack has a network interface card that connects to its TOR switch, and each TOR switch has additional ports that can be connected to other switches. Although today hosts typically have 1 Gbps Ethernet connections to their TOR switches, 10 Gbp connections may become the norm. Each host is also assigned its own data center internal IP address.
The data center network supports two types of traffic : traffic flowing between external clients and internal hosts and traffic flowing between internal hosts. To handle flows between external clients and internal hosts, the data center network includes one or more border routers, connecting the data center network to the public internet. The data center network therefore interconnects the racks with each other and connects the racks to the border routers. The figure below (5.30) shows an example of a data center network.

Data center network design, the art of designing the interconnection network and protocols that connect the racks with each other and with the border routers, has become an important branch of computer networking research in recent years.
Load Balancing
A cloud data center, such as Google or Microsoft data center, provided many applications concurrently, such as search, email, and video applications. To support requests from external clients, each application is associated with a publicly visible IP address to which clients send their requests and from which they receive response.
Inside the data center, the external requests are first directed to a load balancer whose job is to distribute requests to the hosts, balancing the load across the hosts as function of their current load.
A large data center will often have several load balancers, each one devoted to a set of specific cloud applications. Such a load balancer is sometimes referred to as a “layer-4 switch” since it makes decision based on the destination port number (layer 4) as well as destination IP address in the packet. Upon receiving a request for a particular application, the load balancer, forwards it to one of the hosts that handles the application. (A host may then invoke the services of others hosts to help process the request). When the host finishes processing the request, it sends its response back to the load balancer, which in turn relays the response back to the external client. The load balancer not only balances the work load across hosts, but also proves a NAT-like function, translating the public external IP address to the internal IP address of the appropriate host, and then translating back for packets traveling in the reverse direction back to the clients. This prevents clients from contacting hosts directly, which has the security benefit of hiding the internal network structure and preventing clients from directly acting with the hosts.
Hierarchical Structure
For a small data center housing only a few thousand hosts, a simple network consisting of a border router, a load balancer, and a few tens of racks all interconnected by a single Ethernet switch could possibly suffice. But to scale to tens to hundreds of thousands of hosts, a data center often employs a hierarchy of routers and switches, as shown in the figure above.
At the top of the hierarchy , the border router connects to access routers (you can see only two in the figure, but there can be many more). Below each access router there are three tiers of switches. Each access router connects to a top-tier switch, and each top-tier switch connects to multiple second-tier switches and a load balancer. Each second-tier switch in turn connects to multiple racks via the racks’ TOR switches (third-tier switches). All links typically use Ethernet for their link-layer and physical-layer protocols, with a mix of copper and fiber cabling. With such a hierarchical design, it is possible to scale a data center to hundreds of thousands of hosts.
Link Layer
We know that network layer provides a communication service between any two network hosts. Between the two hosts, datagrams travel over a series of communication links, some wires and some wireless, starting at the source host, passing through a series of packet switches (switches and routers) and ending at the destination host.
As we continue down the protocol stack, from the network layer to the link layer, we naturally wonder :
- How packets are sent across the individual links that make up the end-to-end communication path.
- How are the network-layer datagrams encapsulated in the link layer frames for transmission over a single link?
- Are different link layer protocols used in the different links along the communication path?
- How are transmission conflicts in broadcast links resolved?
- Is there addressing at the link layer and, if so, how does the link layer addressing operate with the network layer addressing.
- And what exactly is the difference between a switch and a router?
We’ll answer these and other important questions in this tutorial.
Understanding Link Layer with Example
It will be convenient, in this tutorial, to refer to any device that runs a link layer protocol as a node. Nodes include hosts, routers, switches, and WiFi access points.
We’ll also refer to the communication channels that connect adjacent nodes along the communication path as links. In order for a datagram to be transferred from source host to destination host, it must be move over each of the individual links in the end-to-end path.
As an example, in the company network shown in the figure below (5.1), consider sending a datagram from one of the wireless hosts to one of the servers.

This datagram will actually pass through six links:
- a WiFi link between sending host and a WiFi access point,
- an Ethernet link between the access point and a link layer switch;
- a link between the link layer switch and the router,
- a link between two routers;
- an Ethernet link between the router and a link layer switch; &
- finally an Ethernet link between the switch and the server.
Over a given link, a transmitting node encapsulates the datagram in a link layer frame and transmits the frame into the link.
In order to gain further insight into the link layer and how it relates to the network layer, let’s consider a transportation analogy. Consider a travel agent who is planning a trip for a tourist traveling from Princeton, New Jersey, to Lausanne, Switzerland. The travel agent decides that it is most convenient for the tourist to:
- take a limousine from Princeton to JFK airport,
- then a plane from JFK airport to Geneva’s airport, and
- finally a train from Geneva’s airport to Lausanne’s train station.
Once the travel agent makes the three reservations,
- it is the responsibility of the Princeton limousine company to get the tourist from Princeton to JFK;
- it is the responsibility of the airline company to get the tourist from JFK to Geneva; and
- it is the responsibility of the Swiss train service to get the tourist from Geneva to Lausanne.
Each of the three segments of the trip is “direct” between two “adjacent” locations. Note that the three transportation segments are managed by different companies and use entirely different transportation modes (limousine, plane and train).
Although the transportation modes are different, they each provide the basic service of moving passengers from one location to an adjacent location. In this transportation analogy:
- The tourist is a datagram,
- Each transportation segment is a link,
- The transportation mode is a link layer protocol, and
- The travel agent is a routing protocol.
Where Is Link Layer Implemented
For the most part, the link layer is implemented in a network adapter, also sometimes known as a Network Interface Card (NIC).
At the heart of the network adapter is the link layer controller, usually a single, special purpose chip that implements many of the link layer services (framing, link access, error detection etc.). Thus, much of a link layer controller’s functionality is implemented in hardware.
For example, Intel’s 8254x controller implements the Ethernet protocols, the Atheros AR5006 controller implements the 802.11 WiFi protocols.
Until the late 1990s most network adapters were physically separate cards (such as PCMCIA card or a plug-in card fitting into a PC’s PCI card slot) but increasingly, network adapters are being integrated onto the host’s motherboard – a so called LAN-on-motherboard configuration.
On the sending side, the controller takes a datagram that has been created and stored in host memory by the higher layers of the protocol stack, encapsulates the datagram in a link layer frame (filling in the frame’s various fields), and then transmits the fame into the communication link, following the link access protocol. On the receiving side, a controller receivers the entire frame, and extracts the network layer datagram. If the link layer performs error detection , then it is the sending controller that sets the error detection bits in the frame header and it is the receiving controller that performs the error detection.
The figure below show a network adapter attaching to a host’s bus (e.g. a PCI or PCI-X bus), where it looks much like any other I/O device to the other host components.

The above figure also shows that while most of the link layer is implemented in hardware, part of the link layer is implemented in software that runs on the host’s CPU.
The software components of the link layer implement higher-level link layer functionality such as assembling link layer addressing information and activating the controller hardware.
On the receiving side, link layer software responds to controller interrupts (e.g. due to the receipt of one or more frames), handling error conditions and passing a datagram up to the network layer. Thus, the link layer is a combination of hardware and software – the place in the protocol stack where software meets hardware.
How Big is Big Data
Initially the term was being used to denote data that was too big for the existing computers to store and process.
Just to get a glimpse consider the following realities:
- Google needs to save more than 3 billion search it receives per day
- Facebook needs to store more than 10 million photo that users upload per hour
- Twitter needs to store the 400 million tweets per day.
Any of the above activities was not possible earlier. But now we have computers that far larger storage and processing capacities.
Processing data this bid has helped Google to predict the spread of disease in real time.
Hedge funds are processing the twitter data for trading purpose.
Now, with big data, you can do things that were impossible earlier.
Now we can see things that were hidden earlier.
What Can We Do With Big Data
The main purpose of big data is to predict things.
Public heath, finance & e-commerce are some of the areas where big data is already showing awesome results.
- Google can detect the spread of diseases
- Farecast could predict the price of flight tickets
- Twitter data is used to predict stock market movements
Not only that, big data has helped :
- Reduce crime in certain states by increasing patrolling in suspected areas
- Reduce fire cases
- Reduce bad loans
Future of Big Data
Big data is the future. It is going to be used enormously both in government & corporate agencies.
It has its won advantages & disadvantages.
I have already mentioned about the advantages, now let us have a look over the disadvantages as well.
- In the name of security, big data will be used to zero in people. It may be used to punish people even before the crime is committed.
- Bit data will be used by banks and insurance companies to charge higher loan interests & premiums on certain people.
- Big data may cause people to see correlations where correlations do not exist – the fooled by randomness phenomena.
The future holds both the benefits of bid data. One thing is for sure – the world will never be the same again. Most of the things in future, will be done on big data predictions.
IPv4 to IPv6 Conversion Method
Any IPv4 to IPv6 conversion method is not going to be easy as the changes are being made in the network layer. It is like changing the foundation of the house. However, two methods have been suggested. We will cover those methods shortly.
One option would be to declare a flag day – a given time and date when all internet machines would be turned off and upgraded from IPv4 to IPv6. The last major technology transition (from using NCP to using TCP for reliable transport service) occurred almost 25 years ago. Even back then [RFC 801], when the internet was tiny and still being administered by a small number of “wizards”, it was realized that such a flag day was not possible. A flag day involving hundreds of millions of machines and millions of network administrators and users is even more unthinkable today. RFC 4213 describes two approaches (which can be used either alone or together) for gradually integrating IPv6 hosts and routers into an IPv4 world (with the long-term goa, of course, of having all IPv4 nodes eventually transition to IPv6).
Dual Stack Approach
Probably the most straightforward way to introduce IPv6-capable nodes is a dual stack approach, where IPv6 nodes also have a complete IPv4 implementation.
Such a node, referred to as an IPv6/IPv4 node in RFC 421, has the ability to send and receive both IPv4 and IPv6 datagrams. When interoperating with an IPv4 node, and IPv6/IPv4 node can use IPv4 datagrams; when interoperating with IPv6 node, it can speak IPv6.
IPv6/IPv4 nodes must have both IPv6 and IPv4 addressed. They must therefore be able to determine whether another node is IPv6-capable or IPv4 only. This problem can be solved using the DNS, which can return an IPv6 address if the node name being resolved is IPv6 capable, or otherwise return an IPv4 address. Of course, if the node issuing the DNS request is only IPv4-capable, the DNS returns only an IPv4 address.
In the dual stack approach. If either the sender or the receiver is only IPv4-capable, an IPv4 datagram must be used. As a result, it is possible that two IPv6-capable nodes can end up, in essence, sending IPv4 datagrams to each other. This is illustrated in the figure below.

Suppose Node A is IPv6-capable and wants to send an IP datagram to Node F, which is also IPv6-capable. Nodes A and B can exchange an IPv6 datagram.
However, Node B must create an IPv4 datagram to send to C. Certainly, the data field of the IPv6 datagram can be copied into the data field of the IPv4 datagram and appropriate address mapping be done.
However, in performing the conversion from IPv6 to IPv4, there will be IPv6-specific fields in the IPv6 datagram (for example, the flow identifier field) that have no counterpart in IPv4. The information field will be lost. Thus, even though E and F can exchange IPv6 datagrams, the arriving IPv4 datagram at E and D do not contain all of the fields that were in the original IPv6 datagram sent from A.
Tunneling
An alternative to the dual stack approach, also discussed in RFC 4213, is known as tunneling . Tunneling can solve the problem noted above, allowing, for example, E to receive the IPv6 datagram originated by A.
The basic idea behind tunneling is the following. Suppose two IPv6 nodes (for example, B and E in the figure above) wan to interoperate using IPv6 datagrams but are connected to each other by intervening IPv4 routers. We refer to the intervening set of IPv4 routers between two IPv6 routers as a tunnel, as shown in the figure below (4.26).

With tunneling, the IPv6 node on the sending side of the tunnel (for example, B) takes the entire IPv6 datagram and puts it in the data (payload) field of an IPv4 datagram. This IPv4 datagram is then addressed to the IPv6 node on the receiving side of the tunnel (for example, E) and sent to the first node in the tunnel (for example C).
The intervening routers in the tunnel route this IPv4 datagram among themselves, just as they would any other datagram, blissfully unaware that the IPv4 datagram itself contains a complete IPv6 datagram.
The IPv6 node on the receiving side of the tunnel eventually receives the IPv4 datagram (it is the destination of the IPv4 datagram), determines that the IPv4 datagram contains an IPv6 datagram, extracts the IPv6 datagram, and then routes the IPv6 datagram exactly as it would if it had received the IPv6 datagram from a directly connected IPv6 neighbour.
Comparison Between PCM, DM, ADM and DPCM
we will compare Pulse Code Modulation (PCM), Delta Modulation (DM), Adaptive Delta Modulation (ADM) and Differential Pulse Code Modulation.Comparison between all these modulation techniques is shown in the table below.

XO__XO DIGITAL LINE CODING ON COMMUNICATION NETWORKING
Line Coding
Digital Line Coding is a special coding system used for the transmission of digital signal over a transmission line.
It is the process of converting binary data to a digital signal.
The data, text,numbers, graphical images, audio and video which are stored in computer memory are in the form of binary data or sequence of bits. Line coding converts these sequences into digital signal.
Properties of Line Coding
- Transmission bandwidth : For a line-code, the transmission bandwidth must be as small as possible.
- Power efficiency : For a given bandwidth and a specified detection error probability, the transmitted power for a line-code should be as small as possible.
- Probability of Error : The probability of error is much reduced.
- Error detection and correction capability : It must be possible to detect and preferably correct detection errors. For example, in a bipolar case, a signal error will cause bipolar violation and thus can easily be detected.
- Power density : It is desirable to have zero power spectral density (PSD) at ω =0 (i.e. , d.c) since ac coupling and transformers are used at the repeaters. Significant power in low-frequency components causes dc wander in the pulse stream when ac coupling is used.The a.c . coupling is required since the dc paths provided by the cable pairs between the repeater sites are used to transmit the power required to operate the repeaters.
- Adequate timing content : It must be possible to extract timing or clock information from the signal.
- Transparency : It must be possible to transmit a digital signal correctly regardless the pattern of 1’s and 0’s.
Types of Line Coding
There are 3 types of Line Coding
- Unipolar
- Polar
- Bi-polar
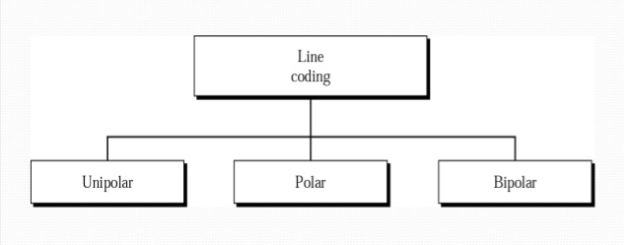
Fig.1 : Types of Line Coding
Unipolar Signaling
The Unipolar signaling is also known as On-Off Keying or simply OOK.
Here, a ‘1’ is transmitted by a pulse and a ‘0’ is transmitted by no pulse. i.e.,the presence of pulse represents a ‘1′ and the absence of pulse represents a ‘0′.
There are two common variations in Unipolar signaling :
- Non Return to Zero (NRZ)
- Return to Zero (RZ)
Unipolar Non-Return to Zero (NRZ)
In this type of unipolar signaling, a High (1)in data is represented by a positive pulse called as Mark, which has a duration T0 equal to the symbol bit duration. A Low(0) in data input has no pulse.
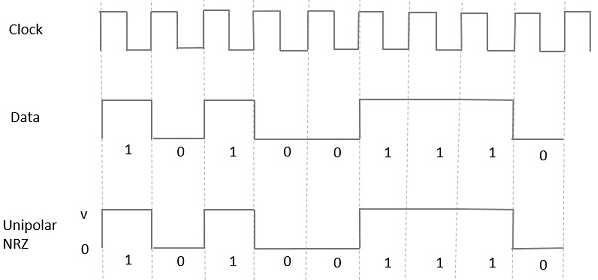
Fig.2 : Unipolar Non-Return to Zero (NRZ)
Advantages
The advantages of Unipolar NRZ are −
- It is simple.
- A lesser bandwidth is required.
Disadvantages
The disadvantages of Unipolar NRZ are −
- No error correction capability.
- Presence of low frequency components may cause the signal droop.
- No clock is present for the ease of synchronization.
- It is not transparent.Loss of synchronization is likely to occur especially for long strings of 1s and 0s.
Unipolar Return to Zero (RZ)
In this type of unipolar signaling, a High in data, though represented by a Mark pulse, its duration T0 is less than the symbol bit duration. Half of the bit duration remains high but it immediately returns to zero and shows the absence of pulse during the remaining half of the bit duration.
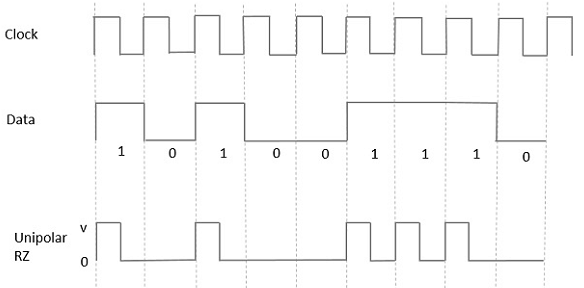
Fig.3: Unipolar Return to Zero (RZ)
Advantages
- simple to implement.
- The spectral line present at the symbol rate can be used as a clock.
Disadvantages
- No error correction capability.
- Occupies twice the bandwidth as unipolar NRZ.
- The signal droop is caused at the places where signal is non-zero at 0 Hz.
- Not transparent.
Polar Signaling
There are two methods of Polar Signaling. Such as:
- Polar NRZ
- Polar RZ
Polar NRZ
In this type of Polar signaling, a High (1)in data is represented by a positive pulse, while a Low (0) in data is represented by a negative pulse.
This is shown in fig.4 below.
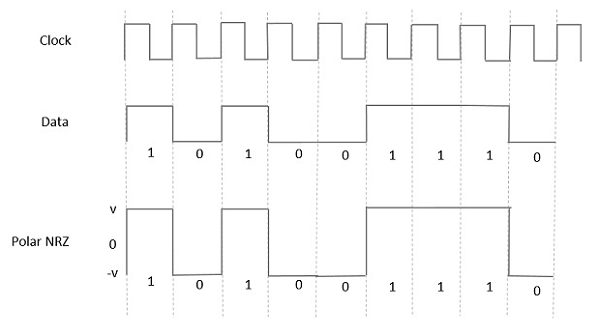
Fig.4 : Polar NRZ
Advantages
The advantages of Polar NRZ are −
- Simplicity in implementation.
- No low-frequency (DC) components are present.
Disadvantages
The disadvantages of Polar NRZ are −
- No error correction capability.
- No clock is present for the ease of synchronization.
- Signal droop is caused at the places where the signal is non-zero at 0 Hz.
- It is not transparent.
Polar RZ
In this type of Polar signaling, a High (1) in data, though represented by a Mark pulse, its duration T0 is less than the symbol bit duration. Half of the bit duration remains high but it immediately returns to zero and shows the absence of pulse during the remaining half of the bit duration.
However, for a Low (0) input, a negative pulse represents the data, and the zero level remains same for the other half of the bit duration.
This is shown in fig.5 below .
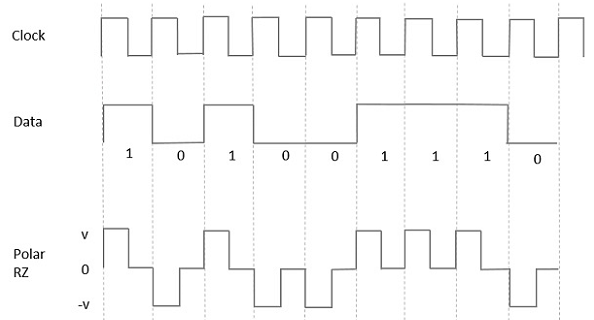
Fig.5 : Polar RZ
Advantages
The advantages of Polar RZ are −
- Simplicity in implementation.
- No low-frequency (DC) components are present.
Disadvantages
The disadvantages of Polar RZ are −
- No error correction capability.
- No clock is present for the ease of synchronization.
- Occupies twice the bandwidth of Polar NRZ.
- The signal droop is caused at places where the signal is non-zero at 0 Hz.
Bipolar Signaling
This is an encoding technique which has three voltage levels such as : +, – and 0. Such a signal is known as duo-binary signal.
An example of this type is Alternate Mark Inversion (AMI).
For a 1, the voltage level gets a transition from + to – or from – to +, having alternate 1s to be of equal polarity. A 0 will have a zero voltage level.
There are two types in this method. such as :
- Bipolar NRZ
- Bipolar RZ
As we have already discussed the difference between NRZ and RZ, the same way here too.
The following figure clearly describes this.
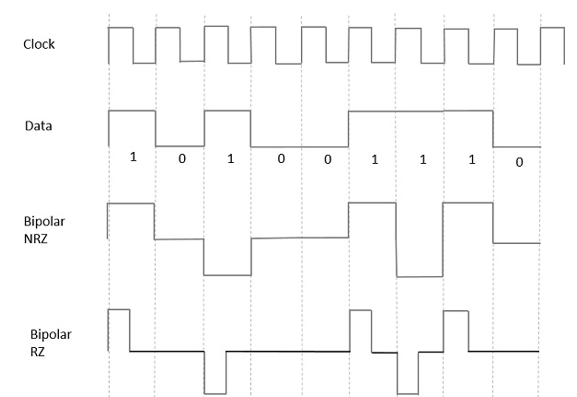
Fig.6
In the above fig.6, both the Bipolar NRZ and RZ waveforms are shown.
The pulse duration and symbol bit duration are equal in NRZ type, while the pulse duration is half of the symbol bit duration in RZ type.
Advantages
- Simplicity in implementation.
- No low-frequency(DC) components are present.
- Occupies low bandwidth than unipolar and polar NRZ techniques.
- Signal drooping doesn’t occur here, hence it is suitable for transmission over AC coupled lines.
- A single error detection capability is present here.
Disadvantages
- No clock is present.
- It is not transparent.i.e.,long strings of data causes loss of synchronization.
Power Spectral Density
The function which shows how the power of a signal got distributed at various frequencies, in the frequency domain is known as Power Spectral Density (PSD).
PSD is the Fourier Transform of Auto-Correlation . It is in the form of a rectangular pulse.
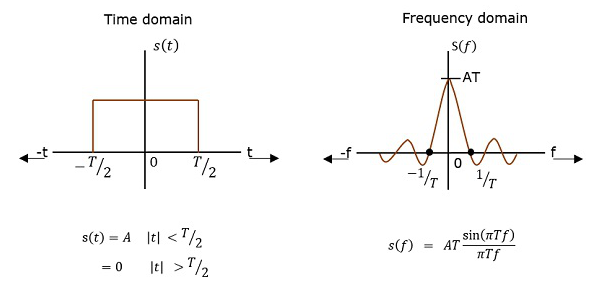
Fig.7
PSD Derivation
According to the Einstein-Wiener-Khintchine theorem, if the auto correlation function or power spectral density of a random process is known, the other can be found exactly.
Hence, to derive the power spectral density, we shall use the time auto-correlation (Rx(τ)) of a power signal x(t) as shown below.
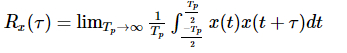
Since x(t) consists of impulses, (Rx(τ)) can be written as:
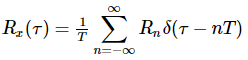
Where:
Getting to know that Rn = R-n , for real signals, we have
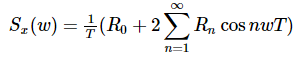
Since the pulse filter has the spectrum of (ω)↔f(t), we have
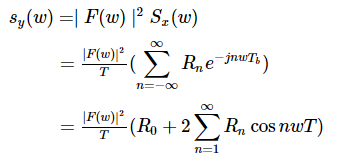
Now we can find the PSD of various line codes using this equation for Power Spectral Density .
XO ___XO ++DW How Hybrid Networks Work
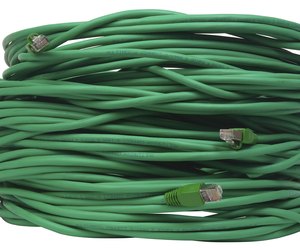
Wires are for work. Wireless is for play. A few years ago, that was the conventional wisdom on wired versus wireless networks. Wi-Fi was great for checking e-mail at Starbucks, but it wasn't fast enough or secure enough for an office setting -- even a home office. For speed and security, Ethernet cables were the only way to go.
Things are changing. Now people are viewing Ethernet and Wi-Fi as important components of the same local area network (LAN). Wires are great for linking servers and desktop computers, but Wi-Fi is ideal for extending that network seamlessly into the conference room, the lunch room, and yes, even the bathroom.
Think about the typical college or university LAN. According to a 2007 survey, 73.7 percent of college students own a laptop [source: Educause Center for Applied Research]. And they expect to be able to access the Internet and share files across the college network, whether they're in the physics lab or sunbathing in the quad. That's the role of a hybrid network.
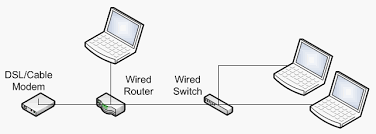
A hybrid network refers to any computer network that contains two or more different communications standards. In this case, the hybrid network uses both Ethernet (802.3) and Wi-Fi (802.11 a/b/g) standards. A hybrid network relies on special hybrid routers, hubs and switches to connect both wired and wireless computers and other network-enabled devices.
How do you set up a hybrid network? Are hybrid routers expensive? Is it hard to configure a Wi-Fi laptop to join an existing wired network? Read on to find out more about hybrid networks.
In a wired computer network, all devices need to be connected by physical cable. A typical configuration uses a central access point. In networking terms, this is called a star topology, where information must travel through the center to reach other points of the star.
The central access point in a wired network can be a router, hub or a switch. The access point's function is to share a network connection among several devices. All the devices are plugged into the access point using individual Ethernet (CAT 5) cables. If the devices want to share an Internet connection as well, then the access point needs to be plugged into a broadband Internet modem, either cable or DSL.

A router allows connections to be shared among devices.
In a standard wireless network, all networked devices communicate with a central wireless access point. The devices themselves need to contain wireless modems or cards that conform with one or more Wi-Fi standards, either 802.11 a, b or g. In this configuration, all wireless devices can share files with each other over the network. If they also want to share an Internet connection, then the wireless access point needs to be plugged into a broadband modem.
A standard hybrid network uses something called a hybrid access point, a networking device that both broadcasts a wireless signal and contains wired access ports. The most common hybrid access point is a hybrid router. The typical hybrid router broadcasts a Wi-Fi signal using 802.11 a, b or g and contains four Ethernet ports for connecting wired devices. The hybrid router also has a port for connecting to a cable or DSL modem via Ethernet cable.
When shopping for a hybrid router, you might not see the word "hybrid" anywhere. You're more likely to see the router advertised as a wireless or Wi-Fi router with Ethernet ports or "LAN ports" . Hybrid routers start at around $50 for a basic model with four Ethernet ports and a network speed of 54Mbps (megabits per second).
There are several different possible network configurations for a hybrid network. The most basic configuration has all the wired devices plugged into the Ethernet ports of the hybrid router. Then the wireless devices communicate with the wired devices via the wireless router.
But maybe you want to network more than four wired devices. In that case, you could string several routers together, both wired and wireless, in a daisy chain formation. You'd need enough wired routers to handle all of the wired devices (number of devices divided by four) and enough wireless routers -- in the right physical locations -- to broadcast a Wi-Fi signal to every corner of the network.
Computers aren't the only devices that can be linked over a hybrid network. You can now buy both wired and wireless peripheral devices like printers, Web cams and fax machines. An office worker with a laptop, for example, can print a document without plugging directly into the printer. He can send the document over the hybrid network to the networked printer of his choice.
Now let's look at the advantages and disadvantages of traditional wired and wireless networks and how hybrid networks offer the best of both worlds.
The chief advantage of a wired network is speed. So-called "Fast Ethernet" cables can send data at 100Mbps while most Wi-Fi networks max out at 54Mpbs . So if you want to set up a LAN gaming party or share large files in an office environment, it's better to stick with wired connections for optimum speed. Take note, however, that the upcoming 802.11n Wi-Fi standard claims throughput speeds of 150 to 300Mbps .
The chief advantage of a wireless network is mobility and flexibility. You can be anywhere in the office and access the Internet and any files on the LAN. You can also use a wider selection of devices to access the network, like Wi-Fi-enabled handhelds and PDAs.

To get the maximum speed for LAN parties, it's best to use a wired connection.
Another advantage of wireless networks is that they're comparatively cheaper to set up, especially in a large office or college environment. Ethernet cables and routers are expensive. So is drilling through walls and running cable through ceilings. A few well-placed wireless access points -- or even better, a wireless mesh network -- can reach far more devices with far less money.
Other than that, both wired and wireless networks are equally easy (or difficult) to set up, depending on the organization's size and complexity. For a small office or home network, the most popular operating systems -- Windows XP, Vista and Mac OS 10 -- can guide you through the process with a networking wizard. Installing and administering a large office or organizational network is equally tricky whether you're using wired or wireless. Although with wireless connections, you don't have to go around checking physical Ethernet connections.
As for security, wired is generally viewed as more secure, since someone would have to physically hack into your network. With wireless, there's always a chance that a hacker could use packet-sniffing software to spy on information traveling over your wireless network. But with new wireless encryption standards like WEP (Wired Equivalent Privacy) and WPA (Wi-Fi Protected Access) built into most Wi-Fi routers, wireless networking is nearly as secure as wired.
A hybrid wired/Wi-Fi network would seem to offer the best of both worlds in terms of speed, mobility, affordability and security. If a user needs maximum Internet and file-sharing speed, then he can plug into the network with an Ethernet cable. If he needs to show a streaming video to his buddy in the hallway, he can access the network wirelessly. With the right planning, an organization can save money on CAT 5 cable and routers by maximizing the reach of the wireless network. And with the right encryption and password management in place, the wireless portion of the network can be just as secure as the wired.

A hybrid computer communication network.
Hybrid Networking Topologies: Types, Uses & Examples
Physical design of a network requires proper planning which for certain cases requires multiple topologies being combined(hybrid topology) to address all organizational needs. This lesson explains hybrid network topologies, their examples and uses.
A hybrid network is any computer network that uses more than one type of connecting technology or topology. For example, a home network that uses both Wi-Fi and Ethernet cables to connect computers is a hybrid. In the early years of computer networking, hybrid networks often consisted of Token Ring or Star technologies, however these were quickly antiquated by Ethernet.
Hybrid Network Topologies
Hybrid topology is an interconnection of two or more basic network topologies, each of which contains its own nodes.
The resulting interconnection allows the nodes in a given basic topology to communicate with other nodes in the same basic topology as well as those in other basic topologies within the hybrid topology.
Advantages of a hybrid network includes increased flexibility as new basic topologies can easily be added or existing ones removed and increased fault tolerance.
Types of Hybrid Network Topologies
There are different types of hybrid network topologies depending on the basic topologies that makes up the hybrid and the adjoining topology that interconnects the basic topologies.
The following are some of the Hybrid Network Topologies:
Star-Wired Ring Network Topology
In a Star-Wired Ring hybrid topology, a set of Star topologies are connected by a Ring topology as the adjoining topology. Joining each star topology to the ring topology is a wired connection.
Figure 1 is a diagrammatic representation of the star-wired ring topology
 |
Figure 1: A Star-Wired Ring Network Topology
In Figure 1, individual nodes of a given Star topology like Star Topology 1 are interconnected by a central switch which in turn provide an external connection to other star topologies through a node A in the main ring topology.
Information from a given star topology reaching a connecting node in the main ring topology like A flows either in a bidirectional or unidirectional manner.
A bidirectional flow will ensure that a failure in one node of the main ring topology does not lead to the complete breakdown of information flow in the main ring topology.
Star-wired bus Network Topology
A Star-Wired Bus topology is made up of a set of Star topologies interconnected by a central Bus topology.
Joining each Star topology to the Bus topology is a wired connection.
Figure 2 is a diagrammatic representation of the star-wired bus topology
 |
Figure 2: A Star-Wired Bus Network Topology
In this setup, the main Bus topology provides a backbone connection that interconnects the individual Star topologies.
The backbone in this case is a wired connection.
Hierarchical Network Topology
Hierarchical Network topology is structured in different levels as a hierarchical tree. It is also referred to as Tree network topology.
Figure 3 shows a diagrammatic representation of Hierarchical network topology.
 |
Figure 3: A Tree Network Topology
Connection of the lower levels like level 2 to higher levels like level 1 is done through wired connection.
The top most level, level 0, contains the parent (root) node. The second level, level 1 contains the child nodes which in turn have child nodes in level 3. All the nodes in a given level have a higher parent node except for the node(s) at the top most level.
The nodes at the bottom most level are called leaf nodes as they are peripheral and are parent to no other node. At the basic level, a tree network topology is a collection of star network topologies arranged in different levels.
Each level including the top most can contain one or more nodes.
Uses of Hybrid Network Topologies
The decision to use the Hybrid network topology over a basic topology in a network is mostly based on the organizational needs to be addressed by the network envisioned. The following are some of the reasons that can make an organization pick on a hybrid as the preferred network topology:
Where there is need for Flexibility and Ease of network Growth
Network growth is when more network nodes are added to an existing network. A hybrid network easens addition of new nodes to the network as changes can be done at the basic network levels as well as on the main network.
For example, in a Campus set up, there could be different hostels each of which could be having its own network. The individual hostel networks have the liberty of adding new node to its network at any time without affecting the other hostels network.
Home Network Hybrids
Although Ethernet and Wi-Fi usually use the same router in a home network, this doesn't mean that the technology behind them is identical. Both have different specifications developed by the IEEE Standards Association. Ethernet cable networks use the 802.3 standards, while Wi-Fi networks use 802.11. These standards have different rules about how data is transferred. A home WiFi Ethernet router is a hybrid device that brings these two different technologies together. Without such a hybrid device, there would be no way to connect an Ethernet-based desktop to a Wi-Fi-based tablet on the same network.

An ethernet cable is hooked up to a laptop.
Business Network Hybrids
Business networks often rely on hybrid networks to ensure employees using different devices can access the same data, which may be stored in different locations. Since businesses seldom upgrade an entire network to the latest technology at the same time, a typical enterprise network today may include components from different eras. For example, two offices may be joined with an ATM fiber optic connection, with some people connecting to the network using Ethernet, others using Wi-Fi and home users connecting through the Internet or, more recently, 4G wireless. Technologies like Multi-Protocol Label Switching, or MPLS, allow businesses to route traffic from different technologies into the same network.
Advantages of Hybrids
The two main advantages of a hybrid network are cost-savings and accessibility. If you have an Ethernet network at home and buy a tablet, rather than replacing all of your Ethernet components with Wi-Fi, you can simply add a Wi-Fi router to your existing network. The same is true for business networks, but on a larger scale. Few businesses have the budget to replace an entire network all at once. Hybrids allow a business to bring in new networking technologies, while phasing out old technologies over the course of several years.
Disadvantages of Hybrids
The main disadvantage of hybrids are security and support costs. Each network technology introduces new security concerns. Having a router with a good firewall becomes meaningless, for example, if you add a Wi-Fi access point that hasn't been encrypted with a strong password. In business networks, supporting different types of network technologies can become expensive, since they usually need someone with expertise in each technology. Business hybrid networks are always the result of balancing the need for a fast, accessible network with the need for data e- Key Shifting .
LAN
Local Area Network" or LAN is a term meaning "private network." The dominant set of standards for the physical properties of LANs is called Ethernet. The Ethernet standards are published by the Institute of Electrical and Electronics Engineers and periodically updated to create better performing networks. The "100" LAN refers to one of these standards.
Ethernet
Ethernet was originally a proprietary networking system owned by Xerox. The early Xerox standards recommended the use of coaxial cable. In 1983, the responsibility for managing the standards was handed over to the IEEE, and Ethernet became an open standard. An open standard is available to all, either free of charge, or for a subscription fee. The IEEE has since produced a number of amendments to the Ethernet standards; each carries the code 802.3, followed by one or two letters to indicate a series.
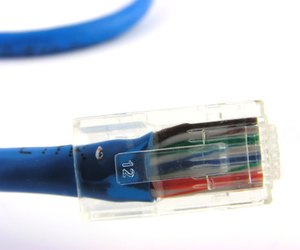
Unshielded Twisted Pair cable is the most common
Naming Convention
Although the IEEE uses the 802.3 code for all its Ethernet standards, the complete LAN systems it defines are given a different code. This naming system has three elements. The first is the data throughput speed. Originally, this was expressed in megabits per second, but later systems are given a code based on gigabits per second. The next part of the name gives its transmission method, which is either baseband or broadband. The final part is a code for the cable type of the network.
Fast Ethernet
The 100 Megabits per second version of Ethernet was released by the IEEE in 1995 with the publication of 802.3u. The standard defined three different cabling systems, each achieving the same performance levels. These networks types are called 100BASE-T4 and 100BASE-TX (which together are known as 100BASE-T) and 100BASE-FX. The "T" in the first two standards refers to twisted pair cable. The "F" of 100BASE-FX indicates that the standard used two strands of multi-mode fiber optic cable.
Twisted Pair
Twisted pair cable for networking comes in two forms: Unshielded Twisted Pair, or UTP, and Shielded Twisted Pair, or STP. Of the two, UTP is more widely implemented. Both types of cable contain eight wires configured as pairs, with the two wires of each pair twisted around each other. The twisting forms a protection against magnetic interference, making shielding unnecessary, although STP has additional shielding. Usually, only four of the eight wires inside the cable are used. UTP cable is categorized into grades and higher grades have better capabilities. The 100BASE-TX uses Cat-5 UTP cable, but that can replaced by the equivalent STP cable. The 100BASE-T4 allows for the employment of lower-grade UTP cable, which are called "Cat-3" and "Cat-4." These implementations use all the wires inside the cable, not just two pairs.
How Does a Wireless Adapter Work?
A wireless adapter, also called a wireless network adapter, has two primary functions: 1) convert data from its binary electronic form into radio frequency signals and transmit them and 2) receive RF signals and convert them into binary electronic data and pass them to a computer.
Essentially, a wireless adapter works much like a radio or television. These devices receive signals and convert them into an output: sound, sight or both. Similarly, wireless adapters convert signals into the electronic equivalent of data, sight and sound for either transmission as radio frequency signals or into data for a computer to process.
RF Signals
RF signals are vibrating electromagnetic waves transmitted through the air. When you use your cellular telephone, you are communicating by way of RF signals. Although seemingly unlimited, the air space in which RF signals are transmitted is divided into a variety of bands, nearly all of which are assigned to specific applications, industries or purposes. The frequencies used for wireless networking are reserved for that specific purpose. The frequencies used in wireless networking, primarily 2.4 Gigahertz and 5 GHz, are divided into fourteen channels, over which wireless network devices communicate.
Bandwidth
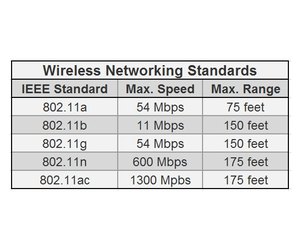
Bandwidth, or the data transfer rate, is the speed, measured in bits per second, at which a wireless device transmits data. Bandwidth depends on the particular wireless network standard implemented on a wireless network. The standards for wireless networking, the IEEE 802.11 standards, define a bandwidth range from 11 megabits per second (IEEE 802.11b) to 1300 Mbps (IEEE 802.11ac).
Range
Range is the straight-line distance defined by a wireless network standard in which a transmitted signal remains viable. Wireless signals are effected by distance. As a receiving wireless device moves away from a transmitting device, the signal becomes weaker. The highest bandwidth of a wireless standard is rarely available at the outer limit of its range. In addition to distance issues, the materials a signal must pass through can also weaken, or perhaps even block, a wireless signal. On a wireless network device, signal strength (the number of bars) is very important, just like it is on a cell phone.
Device Type
Wireless adapters come in a variety of shapes, sizes, technologies and even colors. The adapter that is right for your computer must meet certain criteria: the device to which it will attach, the wireless standard you want to use, which determines bandwidth and range and where and how you wish to connect to wireless (indoors vs outdoors). There are wireless adapters for notebooks, laptops, tablets, phones, cameras and, of course, desktop computers. A network adapter for a desktop computer is typically an expansion card that is installed inside the computer's system case. However, many network adapters connect through a USB port and some are external peripheral devices that connect to a computer through a cable.
Wireless Adapter Functions
So, what does a wireless adapter do? It facilitates the capability for interaction with wireless RF signals transmitted within its range. With a wireless adapter built in, installed in or attached to a computer or wireless communication device, you are able to join a wireless network to communicate with websites, other people or Internet resources.
Difference Between Wireless LAN & WiFi
Wi-Fi is the implementation of Wireless LAN. Wireless LAN describes the broader concept of wireless networked communications between machines. Wi-Fi is a trademark that can be used on devices that meet the 802.11 standards. Wi-Fi is used by a variety of devices to allow them to connect to wireless networks and the Internet.Wireless LAN
Wireless LAN or WLAN refers to Wireless Local Access Network. This is a somewhat broad term in that it describes wireless networks of machines through several means. One type of WLAN can be peer to peer, which is basically two machines setup to communicate directly with one another. Another form of WLAN is sometimes called infrastructure mode. This is the most common type of WLAN and involves two or more computers communicating through a bridge or or access point. This latter type is typically used for wireless Internet access using a wireless router.
Wi-Fi
Wi-Fi is a trademark of the Wi-Fi Alliance an organization that sets standards for Wi-Fi and certifies devices. Wi-Fi is a widely used standard and as such Wi-Fi devices can be used across the world without difficulty. Wi-Fi, basically, describes the implementation of WLAN. Wi-Fi is a technology and set of standards that allows for the implementation of WLANs.

Wi-Fi allows Internet access nearly anywhere
The Same
In practical terms there really isn't a difference between WLAN and Wi-Fi, because Wi-Fi is WLAN. WLAN is a broader concept but Wi-Fi is so widespread in its use that it is effectively the only technology for WLAN in use. Wi-Fi itself is broad as it represents a set of standards for technology for accessing WLANs but isn't an explicit product or service offered by a single company. Multiple companies are associated with the Wi-Fi Alliance and set the standards. Wi-Fi is separate from certain other wireless networking technologies worth noting.
Cellular Phones
Cellular phone data networks are neither WLAN nor Wi-Fi. WLAN refers to networks covering a limited area and number of devices. Cellular phone data networks are Wide Area Networks (WAN), meaning they cover a broad area and a large number of devices in that area. Wi-Fi offers data advantages over cellular data networks, because Wi-Fi is a more broadly used and higher bandwidth delivery of wireless access. There are a broad range of cellular data networks from EVDO and GPRS to LTE. These all interact with different devices without any crossover limiting access to only particular devices for each network. In contrast, Wi-Fi is used the same all over the world and a Wi-Fi device from one country will easily access a Wi-Fi WLAN in another.
Bluetooth
Bluetooth differs from Wi-Fi and WLAN in that it is designed to encourage specific interactions through devices that are communicating directly with one another. This is called a Wireless Personal Area Network (WPAN) and differs from WLAN, because it is designed to wirelessly unite the use of otherwise incompatible devices. While one could use Bluetooth for internet access through an internet access point broadcasting a Bluetooth signal, Wi-Fi offers the advantage of more network range and potentially higher speeds of data transfer.
Wireless Networks
As shown there are several types of wireless networks that differ from Wi-Fi. WLAN is not one of them as Wi-Fi is essentially the practical application of WLAN. Wi-Fi offers advantages over other wireless technologies that can offer some of the same things as WLAN and Wi-Fi but in a more limited capacity.
Wan/Lan Protocols
"Local Area Networks," or LANs, and "Wide Area Networks," or WANs, can both be defined by the network protocols that constitute them. Protocols are standards that define how data is ultimately transferred from one system to another. The difference between a LAN and a WAN is the distance the data travels, with a LAN typically serving a single building and a WAN usually covering different geograph locations.LAN Protocols
LAN protocols are distinguished by their capability to efficiently deliver data over shorter distances, such as a few hundred feet, through various mediums, such as copper cabling. Different protocols exist for different purposes and exist in different "layers" of the "Open Systems Interconnect," or OSI, model. Typically when using the word "LAN" to describe a protocol, the intent is to describe lower level, or physical, layers. Some of the most common LAN protocols are "Ethernet," "Token Ring" and "Fiber Distributed Data Interface," or "FDDI."
"Ethernet" is by far the most common type of LAN protocol. It is found in homes and offices throughout the world and is recognizable by its common "CAT5" copper cable medium. It uses a switch or hub to which all systems connect to exchange data.
Two systems must be using the same LAN or WAN
Token Ring" is an older LAN technology that is not prevalent anymore. The basic premise of "Token Ring" is a single "token" is passed from system to system, or through a hub, and only the intended recipient reads the token.
"FDDI" defines how LAN traffic is transmitted over fiber cabling. Fiber cabling is used when longer distances, usually between floors or buildings, are required, or where heightened security is required.
WAN Protocols
WAN protocols are distinguished by their capability to efficiently deliver data over longer distances, such as hundreds of miles. This is generally required to bridge data between multiple LANs. The Internet is the world's largest WAN. Routers, modems and other WAN devices are used to transmit the data over various mediums, commonly fiber cabling. Some of the most common WAN protocols in use today are "Frame Relay," "X.25," "Integrated Services Digital Network," or "ISDN," and "Point-to-Point Protocol," or "PPP."
"Frame Relay" and "X.25" are similar in that they are both packet-switching technologies for sending data over large distances. "Frame Relay" is newer and faster, whereas "X.25" delivers data more reliably.
"PPP" is a protocol that is used to transmit data for other protocols over mediums that they would not normally support, such as sending the "Internet Protocol," or IP, over serial lines.
"ISDN" is a method of combining multiple dial-up lines on a public telephone network into a single data stream.
Wireless LAN Protocols
Wireless LANs, sometimes referred to as "WLAN" or "Wi-Fi," are becoming increasingly prevalent. They operate essentially the same as a traditional LAN, but use wireless signals between antennas as the medium, rather than cabling. Most of the wireless protocols in use today are based on the 802.11 standard and are differentiated by the letter appearing after the number. The four main protocols are "802.11a," "802.11b," "802.11g" and "802.11n."
"802.11a" is designed to carry data over shorter distances at higher speeds of up to 54 megabits per second, or Mbps. "802.11b" does the opposite, operating at lower speeds of up to only 11 Mbps but with higher reliability at longer distances and with more obstructing objects in the environment.
"802.11g" combines the best of the previous two protocols, operating at up to 54 Mbps over longer distances. "802.11n" is the latest wireless protocol to be released. It can operate at speeds of greater than 150 Mbps over longer distances than the other protocols.
Hybrid system simulation of computer control applications over communication networks
Discrete event-driven simulations of digital communication networks have been used widely. However, it is difficult to use a network simulator to simulate a hybrid system in which some objects are not discrete event-driven but are continuous time-driven. A networked control system (NCS) is such an application, in which physical process dynamics are continuous by nature. We have designed and implemented a hybrid simulation environment which effectively integrates models of continuous-time plant processes and discrete-event communication networks by extending the open source network simulator NS-2. To do this a synchronisation mechanism was developed to connect a continuous plant simulation with a discrete network simulation. Furthermore, for evaluating co-design approaches in an NCS environment, a piggybacking method was adopted to allow the control period to be adjusted during simulations. The effectiveness of the technique is demonstrated through case studies which simulate a networked control scenario in which the communication and control system properties are defined explicitly.
Wire communication network combining wireless communication, a hybrid network communication system applied in NC system is proposed. Operation mode of the upper computer combining the lower computer is adopted in NC system to create wire communication network. Many functions, including CAD, CAM, Graph automatic programming, cutter location calculating, NC code generation and so on, are achieved in upper computer. The lower computer is only as motion control system. Some fault signals in NC machine tool are transmitted from lower computer to upper computer. The lower computer is connected with the upper computer by the network cables and Ethernet switchboard based on TCP / IP protocol. The industrial Ethernet network is adopted as the platform. Otherwise, NC system is connected with PDA by virtual serial port technology to create Piconet and diagnose the no-alarm fault in virtual of Bluetooth technology. Virtual serial port in PC is directly accessed with NT port software. The information of NC machine, including NC code, cutter location data and so on, is regularly accessed from top-level application program by Bluetooth wireless communication module with timer component in C++Builder6. The information of NC machine is saved as the Access file in PDA database by ActiveSync software. The Upper computer communication program and the lower computer communication program is designed in virtual of Winsock technology in C++Builder6. The PDA receiving data module program is compiled by evb3.0. In the experiment based on the method above, Many functions, including CAD, CAM, Graph automatic programming, cutter location calculating, NC code generation and so on, are achieved in upper computer to increase functions in NC system while the lower computer normally running. When the lower computer is connected with PDA, process information is successfully transferred to PDA to increase maintainable efficiency while NC system is running. The hybrid network communication system applied in NC system to increase functions and maintainable efficiency.
Client (computing)
A client is a piece of computer hardware or software that accesses a service made available by a server. The server is often (but not always) on another computer system, in which case the client accesses the service by way of a network.The term applies to the role that programs or devices play in the client–server model.
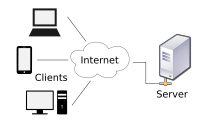
A computer network diagram of client computers communicating with a server computer via the Internet
Overview
A client is a computer or a program that, as part of its operation, relies on sending a request to another program or a computer hardware or software that accesses a service made available by a server(which may or may not be located on another computer). For example, web browsers are clients that connect to web servers and retrieve web pages for display. Email clients retrieve email from mail servers. Online chat uses a variety of clients, which vary depending on the chat protocol being used. Multiplayer video games or online video games may run as a client on each computer. The term "client" may also be applied to computers or devices that run the client software or users that use the client software.
A client is part of a client–server model, which is still used today. Clients and servers may be computer programs run on the same machine and connect via inter-process communication techniques. Combined with Internet sockets, programs may connect to a service operating on a possibly remote system through the Internet protocol suite. Servers wait for potential clients to initiate connections that they may accept.
The term was first applied to devices that were not capable of running their own stand-alone programs, but could interact with remote computers via a network. These computer terminals were clients of the time-sharing mainframe computer.
Types
| Relies on local storage | Relies on local CPU | |
|---|---|---|
| Fat client | Yes | Yes |
| Hybrid client | No | Yes |
| Thin client | No | No |
In one classification, client computers and devices are either thick clients, thin clients, or hybrid clients.
Thick
A Thick client, also known as a rich client or fat client, is a client that performs the bulk of any data processing operations itself, and does not necessarily rely on the server. The personal computer is a common example of a fat client, because of its relatively large set of features and capabilities and its light reliance upon a server. For example, a computer running an Art program (such as Krita or Sketchup) that ultimately shares the result of its work on a network is a thick client. A computer that runs almost entirely as a standalone machine save to send or receive files via a network is by standard called a workstation.
Thin

A thin client is a minimal sort of client. Thin clients use the resources of the host computer. A thin client generally only presents processed data provided by an application server, which performs the bulk of any required data processing. A device using web application (such as Office Web Apps) is a thin client.
Hybrid
A hybrid client is a mixture of the above two client models. Similar to a fat client, it processes locally, but relies on the server for storing persistent data. This approach offers features from both the fat client (multimedia support, high performance) and the thin client (high manageability, flexibility). A device running an online version of the video game Diablo III is an example of hybrid client.
Types of Network Topology
Network Topology is the schematic description of a network arrangement, connecting various nodes(sender and receiver) through lines of connection.
BUS Topology
Bus topology is a network type in which every computer and network device is connected to single cable. When it has exactly two endpoints, then it is called Linear Bus topology.
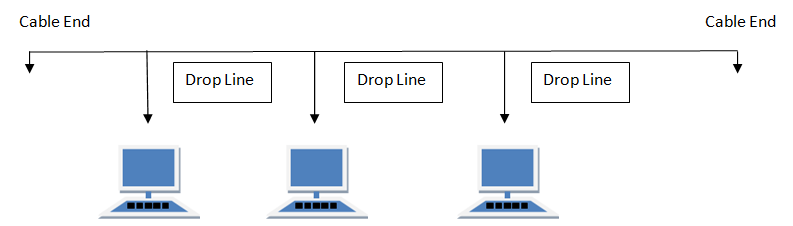
Features of Bus Topology
- It transmits data only in one direction.
- Every device is connected to a single cable
Advantages of Bus Topology
- It is cost effective.
- Cable required is least compared to other network topology.
- Used in small networks.
- It is easy to understand.
- Easy to expand joining two cables together.
Disadvantages of Bus Topology
- Cables fails then whole network fails.
- If network traffic is heavy or nodes are more the performance of the network decreases.
- Cable has a limited length.
- It is slower than the ring topology.
RING Topology
It is called ring topology because it forms a ring as each computer is connected to another computer, with the last one connected to the first. Exactly two neighbours for each device.
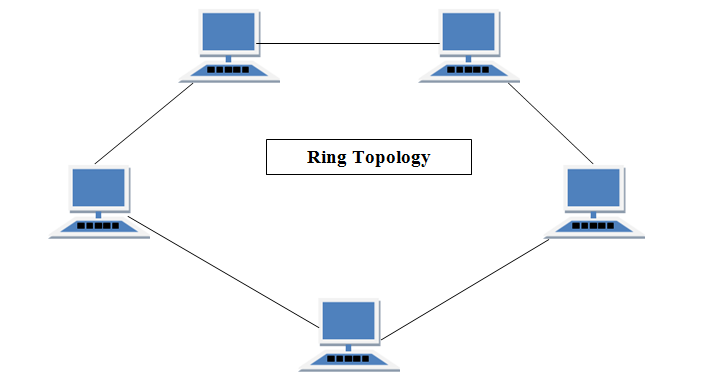
Features of Ring Topology
- A number of repeaters are used for Ring topology with large number of nodes, because if someone wants to send some data to the last node in the ring topology with 100 nodes, then the data will have to pass through 99 nodes to reach the 100th node. Hence to prevent data loss repeaters are used in the network.
- The transmission is unidirectional, but it can be made bidirectional by having 2 connections between each Network Node, it is called Dual Ring Topology.
- In Dual Ring Topology, two ring networks are formed, and data flow is in opposite direction in them. Also, if one ring fails, the second ring can act as a backup, to keep the network up.
- Data is transferred in a sequential manner that is bit by bit. Data transmitted, has to pass through each node of the network, till the destination node.
Advantages of Ring Topology
- Transmitting network is not affected by high traffic or by adding more nodes, as only the nodes having tokens can transmit data.
- Cheap to install and expand
Disadvantages of Ring Topology
- Troubleshooting is difficult in ring topology.
- Adding or deleting the computers disturbs the network activity.
- Failure of one computer disturbs the whole network.
STAR Topology
In this type of topology all the computers are connected to a single hub through a cable. This hub is the central node and all others nodes are connected to the central node.
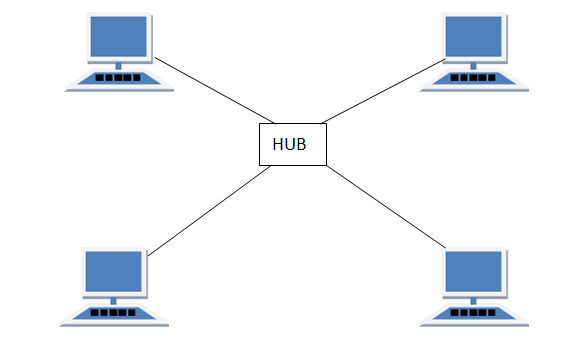
Features of Star Topology
- Every node has its own dedicated connection to the hub.
- Hub acts as a repeater for data flow.
- Can be used with twisted pair, Optical Fibre or coaxial cable.
Advantages of Star Topology
- Fast performance with few nodes and low network traffic.
- Hub can be upgraded easily.
- Easy to troubleshoot.
- Easy to setup and modify.
- Only that node is affected which has failed, rest of the nodes can work smoothly.
Disadvantages of Star Topology
- Cost of installation is high.
- Expensive to use.
- If the hub fails then the whole network is stopped because all the nodes depend on the hub.
- Performance is based on the hub that is it depends on its capacity
MESH Topology
It is a point-to-point connection to other nodes or devices. All the network nodes are connected to each other. Mesh has
n(n-1)/2 physical channels to link n devices.
There are two techniques to transmit data over the Mesh topology, they are :
- Routing
- Flooding
MESH Topology: Routing
In routing, the nodes have a routing logic, as per the network requirements. Like routing logic to direct the data to reach the destination using the shortest distance. Or, routing logic which has information about the broken links, and it avoids those node etc. We can even have routing logic, to re-configure the failed nodes.
MESH Topology: Flooding
In flooding, the same data is transmitted to all the network nodes, hence no routing logic is required. The network is robust, and the its very unlikely to lose the data. But it leads to unwanted load over the network.
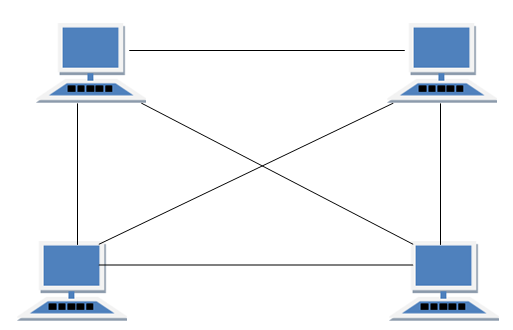
Types of Mesh Topology
- Partial Mesh Topology : In this topology some of the systems are connected in the same fashion as mesh topology but some devices are only connected to two or three devices.
- Full Mesh Topology : Each and every nodes or devices are connected to each other.
Features of Mesh Topology
- Fully connected.
- Robust.
- Not flexible.
Advantages of Mesh Topology
- Each connection can carry its own data load.
- It is robust.
- Fault is diagnosed easily.
- Provides security and privacy.
Disadvantages of Mesh Topology
- Installation and configuration is difficult.
- Cabling cost is more.
- Bulk wiring is required.
TREE Topology
It has a root node and all other nodes are connected to it forming a hierarchy. It is also called hierarchical topology. It should at least have three levels to the hierarchy.
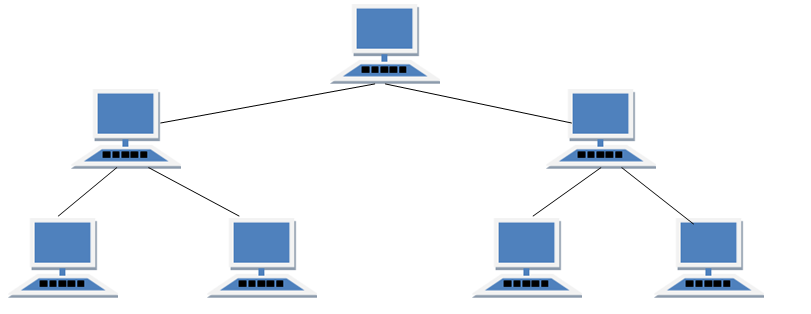
Features of Tree Topology
- Ideal if workstations are located in groups.
- Used in Wide Area Network.
Advantages of Tree Topology
- Extension of bus and star topologies.
- Expansion of nodes is possible and easy.
- Easily managed and maintained.
- Error detection is easily done.
Disadvantages of Tree Topology
- Heavily cabled.
- Costly.
- If more nodes are added maintenance is difficult.
- Central hub fails, network fails.
HYBRID Topology
It is two different types of topologies which is a mixture of two or more topologies. For example if in an office in one department ring topology is used and in another star topology is used, connecting these topologies will result in Hybrid Topology (ring topology and star topology).
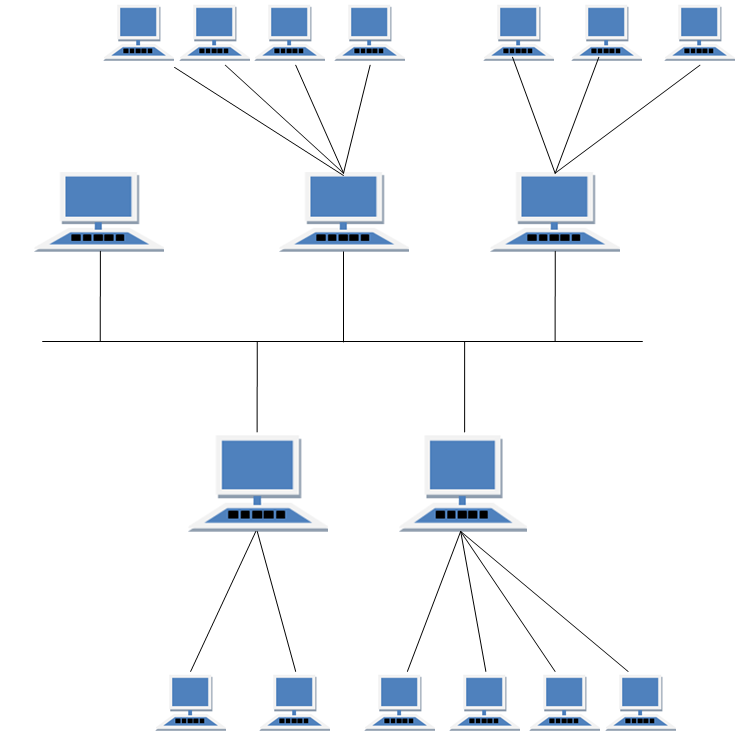
Features of Hybrid Topology
- It is a combination of two or topologies
- Inherits the advantages and disadvantages of the topologies included
Advantages of Hybrid Topology
- Reliable as Error detecting and trouble shooting is easy.
- Effective.
- Scalable as size can be increased easily.
- Flexible.
Disadvantages of Hybrid Topology
- Complex in design.
- Costly.
Transmission Modes in Computer Networks
Transmission mode refers to the mechanism of transferring of data between two devices connected over a network. It is also called Communication Mode. These modes direct the direction of flow of information. There are three types of transmission modes. They are:
- Simplex Mode
- Half duplex Mode
- Full duplex Mode
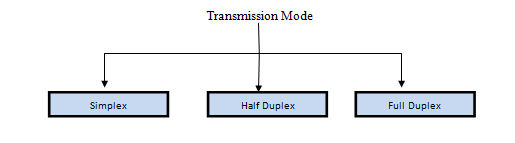
SIMPLEX Mode
In this type of transmission mode, data can be sent only in one direction i.e. communication is unidirectional. We cannot send a message back to the sender. Unidirectional communication is done in Simplex Systems where we just need to send a command/signal, and do not expect any response back.
Examples of simplex Mode are loudspeakers, television broadcasting, television and remote, keyboard and monitor etc.
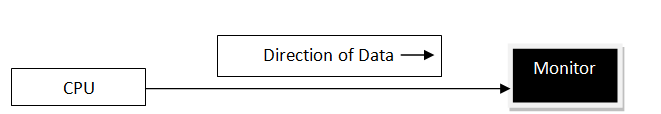
HALF DUPLEX Mode
Half-duplex data transmission means that data can be transmitted in both directions on a signal carrier, but not at the same time.
For example, on a local area network using a technology that has half-duplex transmission, one workstation can send data on the line and then immediately receive data on the line from the same direction in which data was just transmitted. Hence half-duplex transmission implies a bidirectional line (one that can carry data in both directions) but data can be sent in only one direction at a time.
Example of half duplex is a walkie- talkie in which message is sent one at a time but messages are sent in both the directions.
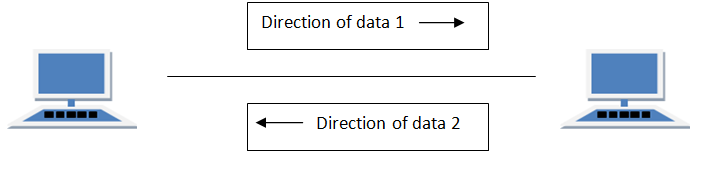
FULL DUPLEX Mode
In full duplex system we can send data in both the directions as it is bidirectional at the same time in other words, data can be sent in both directions simultaneously.
Example of Full Duplex is a Telephone Network in which there is communication between two persons by a telephone line, using which both can talk and listen at the same time.
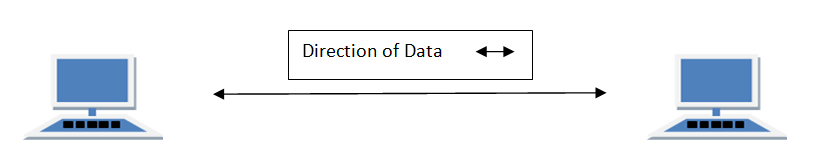
In full duplex system there can be two lines one for sending the data and the other for receiving data.
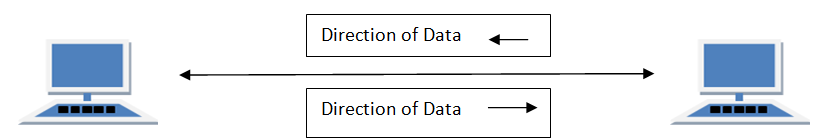
Transmission Mediums in Computer Networks
Data is represented by computers and other telecommunication devices using signals. Signals are transmitted in the form of electromagnetic energy from one device to another. Electromagnetic signals travel through vacuum, air or other transmission mediums to move from one point to another(from sender to receiver).
Electromagnetic energy (includes electrical and magnetic fields) consists of power, voice, visible light, radio waves, ultraviolet light, gamma rays etc.
Transmission medium is the means through which we send our data from one place to another. The first layer (physical layer) of Communication Networks OSI Seven layer model is dedicated to the transmission media, we will study the OSI Model later.
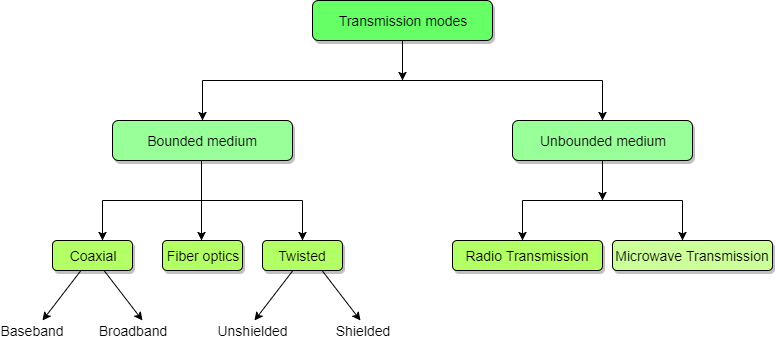
Factors to be considered while selecting a Transmission Medium
- Transmission Rate
- Cost and Ease of Installation
- Resistance to Environmental Conditions
- Distances
Bounded or Guided Transmission Media
Guided media, which are those that provide a conduit from one device to another, include Twisted-Pair Cable, Coaxial Cable, and Fibre-Optic Cable.
A signal travelling along any of these media is directed and contained by the physical limits of the medium. Twisted-pair and coaxial cable use metallic (copper) conductors that accept and transport signals in the form of electric current. Optical fibre is a cable that accepts and transports signals in the form of light.
Twisted Pair Cable
This cable is the most commonly used and is cheaper than others. It is lightweight, cheap, can be installed easily, and they support many different types of network. Some important points :
- Its frequency range is 0 to 3.5 kHz.
- Typical attenuation is 0.2 dB/Km @ 1kHz.
- Typical delay is 50 µs/km.
- Repeater spacing is 2km.
A twisted pair consists of two conductors(normally copper), each with its own plastic insulation, twisted together. One of these wires is used to carry signals to the receiver, and the other is used only as ground reference. The receiver uses the difference between the two. In addition to the signal sent by the sender on one of the wires, interference(noise) and crosstalk may affect both wires and create unwanted signals. If the two wires are parallel, the effect of these unwanted signals is not the same in both wires because they are at different locations relative to the noise or crosstalk sources. This results in a difference at the receiver.
Twisted Pair is of two types:
- Unshielded Twisted Pair (UTP)
- Shielded Twisted Pair (STP)
Unshielded Twisted Pair Cable
It is the most common type of telecommunication when compared with Shielded Twisted Pair Cable which consists of two conductors usually copper, each with its own colour plastic insulator. Identification is the reason behind coloured plastic insulation.
UTP cables consist of 2 or 4 pairs of twisted cable. Cable with 2 pair use RJ-11 connector and 4 pair cable use RJ-45 connector.

Advantages of Unshielded Twisted Pair Cable
- Installation is easy
- Flexible
- Cheap
- It has high speed capacity,
- 100 meter limit
- Higher grades of UTP are used in LAN technologies like Ethernet.
It consists of two insulating copper wires (1mm thick). The wires are twisted together in a helical form to reduce electrical interference from similar pair.
Disadvantages of Unshielded Twisted Pair Cable
- Bandwidth is low when compared with Coaxial Cable
- Provides less protection from interference.
Shielded Twisted Pair Cable
This cable has a metal foil or braided-mesh covering which encases each pair of insulated conductors. Electromagnetic noise penetration is prevented by metal casing. Shielding also eliminates crosstalk (explained in KEY TERMS Chapter).
It has same attenuation as unshielded twisted pair. It is faster the unshielded and coaxial cable. It is more expensive than coaxial and unshielded twisted pair.
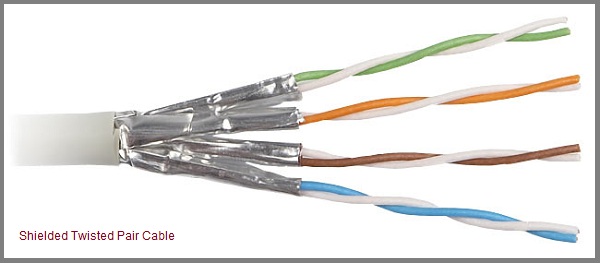
Advantages of Shielded Twisted Pair Cable
- Easy to install
- Performance is adequate
- Can be used for Analog or Digital transmission
- Increases the signalling rate
- Higher capacity than unshielded twisted pair
- Eliminates crosstalk
Disadvantages of Shielded Twisted Pair Cable
- Difficult to manufacture
- Heavy
Performance of Shielded Twisted Pair Cable
One way to measure the performance of twisted-pair cable is to compare attenuation versus frequency and distance. As shown in the below figure, a twisted-pair cable can pass a wide range of frequencies. However, with increasing frequency, the attenuation, measured in decibels per kilometre (dB/km), sharply increases with frequencies above 100kHz. Note that gauge is a measure of the thickness of the wire.
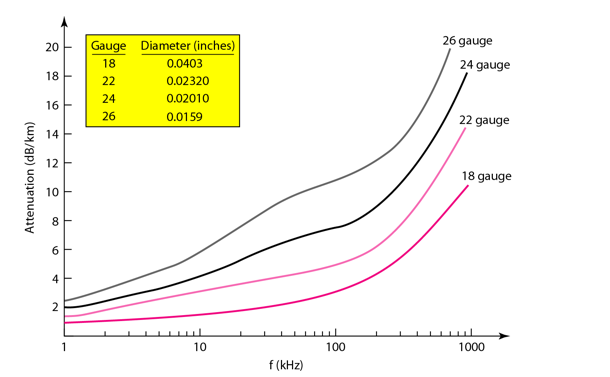
Applications of Shielded Twisted Pair Cable
- In telephone lines to provide voice and data channels. The DSL lines that are used by the telephone companies to provide high-data-rate connections also use the high-bandwidth capability of unshielded twisted-pair cables.
- Local Area Network, such as 10Base-T and 100Base-T, also use twisted-pair cables.
Coaxial Cable
Coaxial is called by this name because it contains two conductors that are parallel to each other. Copper is used in this as centre conductor which can be a solid wire or a standard one. It is surrounded by PVC installation, a sheath which is encased in an outer conductor of metal foil, barid or both.
Outer metallic wrapping is used as a shield against noise and as the second conductor which completes the circuit. The outer conductor is also encased in an insulating sheath. The outermost part is the plastic cover which protects the whole cable.
Here the most common coaxial standards.
- 50-Ohm RG-7 or RG-11 : used with thick Ethernet.
- 50-Ohm RG-58 : used with thin Ethernet
- 75-Ohm RG-59 : used with cable television
- 93-Ohm RG-62 : used with ARCNET.
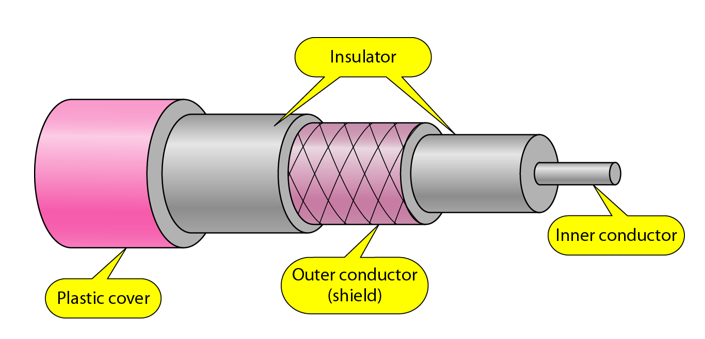
Coaxial Cable Standards
Coaxial cables are categorized by their Radio Government(RG) ratings. Each RG number denotes a unique set of physical specifications, including the wire gauge of the inner conductor, the thickness and the type of the inner insulator, the construction of the shield, and the size and type of the outer casing. Each cable defined by an RG rating is adapted for a specialized function, as shown in the table below:
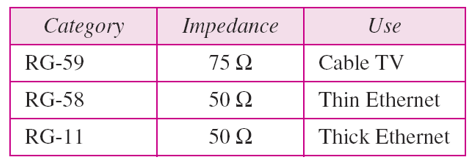
Coaxial Cable Connectors
To connect coaxial cable to devices, we need coaxial connectors. The most common type of connector used today is the Bayonet Neill-Concelman (BNC) connector. The below figure shows 3 popular types of these connectors: the BNC Connector, the BNC T connector and the BNC terminator.
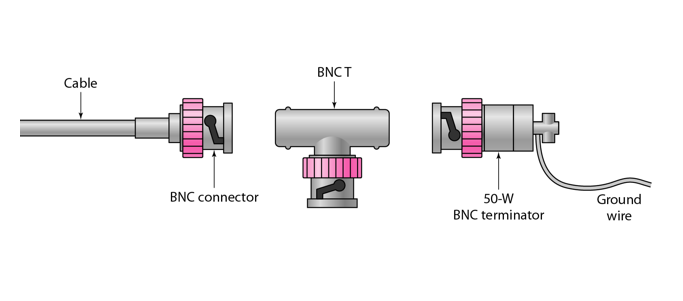
The BNC connector is used to connect the end of the cable to the device, such as a TV set. The BNC T connector is used in Ethernet networks to branch out to a connection to a computer or other device. The BNC terminator is used at the end of the cable to prevent the reflection of the signal.
There are two types of Coaxial cables:
1. BaseBand
This is a 50 ohm (Ω) coaxial cable which is used for digital transmission. It is mostly used for LAN's. Baseband transmits a single signal at a time with very high speed. The major drawback is that it needs amplification after every 1000 feet.
2. BroadBand
This uses analog transmission on standard cable television cabling. It transmits several simultaneous signal using different frequencies. It covers large area when compared with Baseband Coaxial Cable.
Advantages of Coaxial Cable
- Bandwidth is high
- Used in long distance telephone lines.
- Transmits digital signals at a very high rate of 10Mbps.
- Much higher noise immunity
- Data transmission without distortion.
- The can span to longer distance at higher speeds as they have better shielding when compared to twisted pair cable
Disadvantages of Coaxial Cable
- Single cable failure can fail the entire network.
- Difficult to install and expensive when compared with twisted pair.
- If the shield is imperfect, it can lead to grounded loop.
Performance of Coaxial Cable
We can measure the performance of a coaxial cable in same way as that of Twisted Pair Cables. From the below figure, it can be seen that the attenuation is much higher in coaxial cable than in twisted-pair cable. In other words, although coaxial cable has a much higher bandwidth, the signal weakens rapidly and requires the frequent use of repeaters.
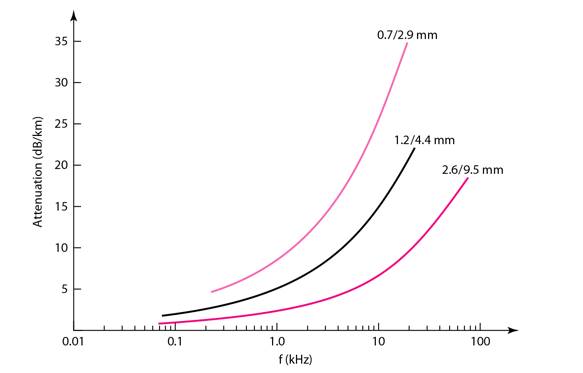
Applications of Coaxial Cable
- Coaxial cable was widely used in analog telephone networks, where a single coaxial network could carry 10,000 voice signals.
- Cable TV networks also use coaxial cables. In the traditional cable TV network, the entire network used coaxial cable. Cable TV uses RG-59 coaxial cable.
- In traditional Ethernet LANs. Because of it high bandwidth, and consequence high data rate, coaxial cable was chosen for digital transmission in early Ethernet LANs. The 10Base-2, or Thin Ethernet, uses RG-58 coaxial cable with BNC connectors to transmit data at 10Mbps with a range of 185 m.
Fiber Optic Cable
A fibre-optic cable is made of glass or plastic and transmits signals in the form of light.
For better understanding we first need to explore several aspects of the nature of light.
Light travels in a straight line as long as it is mobbing through a single uniform substance. If ray of light travelling through one substance suddenly enters another substance (of a different density), the ray changes direction.
The below figure shows how a ray of light changes direction when going from a more dense to a less dense substance.
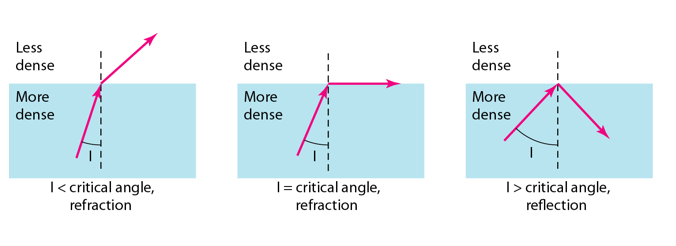
Bending of a light ray
As the figure shows:
- If the angle of incidence I(the angle the ray makes with the line perpendicular to the interface between the two substances) is less than the critical angle, the ray refracts and moves closer to the surface.
- If the angle of incidence is greater than the critical angle, the ray reflects(makes a turn) and travels again in the denser substance.
- If the angle of incidence is equal to the critical angle, the ray refracts and moves parallel to the surface as shown.
Note: The critical angle is a property of the substance, and its value differs from one substance to another.
Optical fibres use reflection to guide light through a channel. A glass or plastic core is surrounded by a cladding of less dense glass or plastic. The difference in density of the two materials must be such that a beam of light moving through the core is reflected off the cladding instead of being refracted into it.
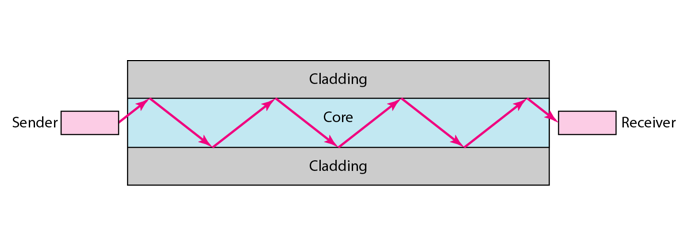
Internal view of an Optical fibre
Propagation Modes of Fiber Optic Cable
Current technology supports two modes(Multimode and Single mode) for propagating light along optical channels, each requiring fibre with different physical characteristics. Multimode can be implemented in two forms: Step-index and Graded-index.
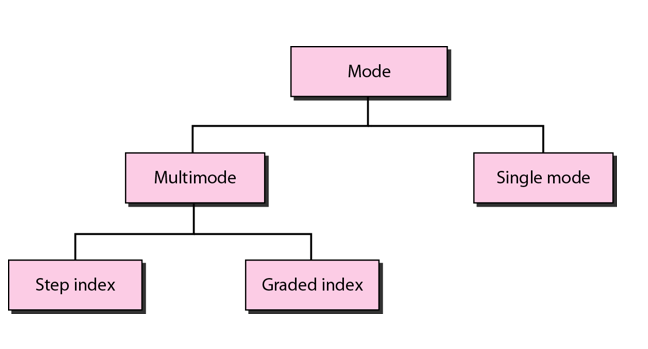
Multimode Propagation Mode
Multimode is so named because multiple beams from a light source move through the core in different paths. How these beams move within the cable depends on the structure of the core as shown in the below figure.
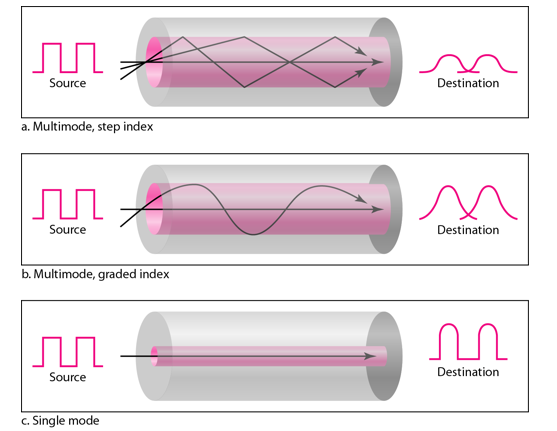
- In multimode step-index fibre, the density of the core remains constant from the centre to the edges. A beam of light moves through this constant density in a straight line until it reaches the interface of the core and the cladding.
The term step-index refers to the suddenness of this change, which contributes to the distortion of the signal as it passes through the fibre. - In multimode graded-index fibre, this distortion gets decreases through the cable. The word index here refers to the index of refraction. This index of refraction is related to the density. A graded-index fibre, therefore, is one with varying densities. Density is highest at the centre of the core and decreases gradually to its lowest at the edge.
Single Mode
Single mode uses step-index fibre and a highly focused source of light that limits beams to a small range of angles, all close to the horizontal. The single-mode fibre itself is manufactured with a much smaller diameter than that of multimode fibre, and with substantially lower density.
The decrease in density results in a critical angle that is close enough to 90 degree to make the propagation of beams almost horizontal.
The decrease in density results in a critical angle that is close enough to 90 degree to make the propagation of beams almost horizontal.
Fibre Sizes for Fiber Optic Cable
Optical fibres are defined by the ratio of the diameter or their core to the diameter of their cladding, both expressed in micrometers. The common sizes are shown in the figure below:
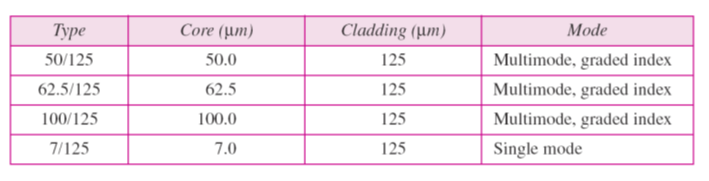
Fibre Optic Cable Connectors
There are three types of connectors for fibre-optic cables, as shown in the figure below.
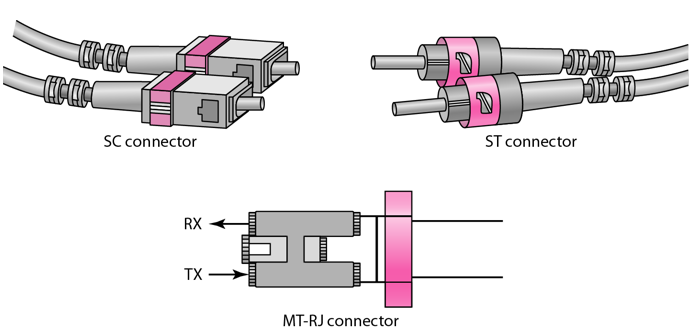
The Subscriber Channel(SC) connector is used for cable TV. It uses push/pull locking system. The Straight-Tip(ST) connector is used for connecting cable to the networking devices. MT-RJ is a connector that is the same size as RJ45.
Advantages of Fibre Optic Cable
Fibre optic has several advantages over metallic cable:
- Higher bandwidth
- Less signal attenuation
- Immunity to electromagnetic interference
- Resistance to corrosive materials
- Light weight
- Greater immunity to tapping
Disadvantages of Fibre Optic Cable
There are some disadvantages in the use of optical fibre:
- Installation and maintenance
- Unidirectional light propagation
- High Cost
Performance of Fibre Optic Cable
Attenuation is flatter than in the case of twisted-pair cable and coaxial cable. The performance is such that we need fewer(actually one tenth as many) repeaters when we use the fibre-optic cable.
Applications of Fibre Optic Cable
- Often found in backbone networks because its wide bandwidth is cost-effective.
- Some cable TV companies use a combination of optical fibre and coaxial cable thus creating a hybrid network.
- Local-area Networks such as 100Base-FX network and 1000Base-X also use fibre-optic cable.
UnBounded or UnGuided Transmission Media
Unguided medium transport electromagnetic waves without using a physical conductor. This type of communication is often referred to as wireless communication. Signals are normally broadcast through free space and thus are available to anyone who has a device capable of receiving them.
The below figure shows the part of the electromagnetic spectrum, ranging from 3 kHz to 900 THz, used for wireless communication.
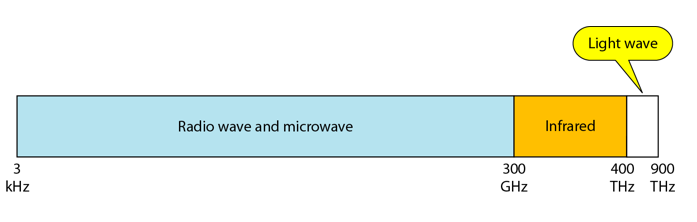
Unguided signals can travel from the source to the destination in several ways: Gound propagation, Sky propagation and Line-of-sight propagation as shown in below figure.
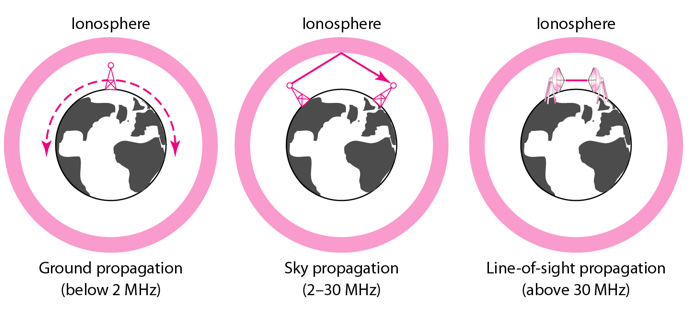
Propagation Modes
- Ground Propagation: In this, radio waves travel through the lowest portion of the atmosphere, hugging the Earth. These low-frequency signals emanate in all directions from the transmitting antenna and follow the curvature of the planet.
- Sky Propagation: In this, higher-frequency radio waves radiate upward into the ionosphere where they are reflected back to Earth. This type of transmission allows for greater distances with lower output power.
- Line-of-sight Propagation: in this type, very high-frequency signals are transmitted in straight lines directly from antenna to antenna.
We can divide wireless transmission into three broad groups:
- Radio waves
- Micro waves
- Infrared waves
Radio Waves
Electromagnetic waves ranging in frequencies between 3 KHz and 1 GHz are normally called radio waves.
Radio waves are omnidirectional. When an antenna transmits radio waves, they are propagated in all directions. This means that the sending and receiving antennas do not have to be aligned. A sending antenna send waves that can be received by any receiving antenna. The omnidirectional property has disadvantage, too. The radio waves transmitted by one antenna are susceptible to interference by another antenna that may send signal suing the same frequency or band.
Radio waves, particularly with those of low and medium frequencies, can penetrate walls. This characteristic can be both an advantage and a disadvantage. It is an advantage because, an AM radio can receive signals inside a building. It is a disadvantage because we cannot isolate a communication to just inside or outside a building.
Omnidirectional Antenna for Radio Waves
Radio waves use omnidirectional antennas that send out signals in all directions.
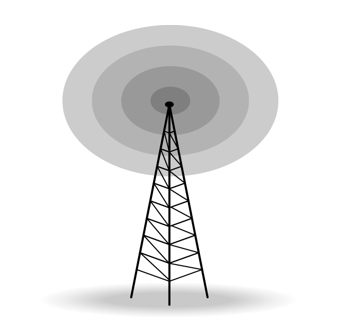
Applications of Radio Waves
- The omnidirectional characteristics of radio waves make them useful for multicasting in which there is one sender but many receivers.
- AM and FM radio, television, maritime radio, cordless phones, and paging are examples of multicasting.
Micro Waves
Electromagnetic waves having frequencies between 1 and 300 GHz are called micro waves. Micro waves are unidirectional. When an antenna transmits microwaves, they can be narrowly focused. This means that the sending and receiving antennas need to be aligned. The unidirectional property has an obvious advantage. A pair of antennas can be aligned without interfering with another pair of aligned antennas.
The following describes some characteristics of microwaves propagation:
- Microwave propagation is line-of-sight. Since the towers with the mounted antennas need to be in direct sight of each other, towers that are far apart need to be very tall.
- Very high-frequency microwaves cannot penetrate walls. This characteristic can be a disadvantage if receivers are inside the buildings.
- The microwave band is relatively wide, almost 299 GHz. Therefore, wider sub-bands can be assigned and a high date rate is possible.
- Use of certain portions of the band requires permission from authorities.
Unidirectional Antenna for Micro Waves
Microwaves need unidirectional antennas that send out signals in one direction. Two types of antennas are used for microwave communications: Parabolic Dish and Horn.
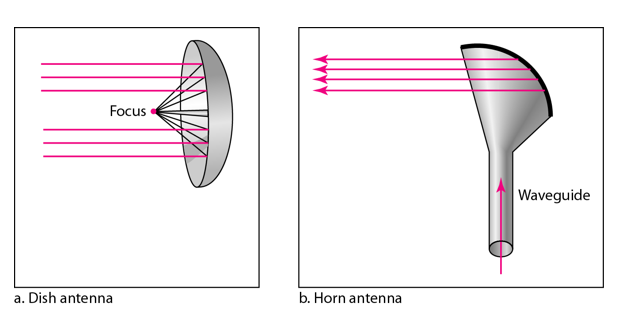
A parabolic antenna works as a funnel, catching a wide range of waves and directing them to a common point. In this way, more of the signal is recovered than would be possible with a single-point receiver.
A horn antenna looks like a gigantic scoop. Outgoing transmissions are broadcast up a stem and deflected outward in a series of narrow parallel beams by the curved head. Received transmissions are collected by the scooped shape of the horn, in a manner similar to the parabolic dish, and are deflected down into the stem.
Applications of Micro Waves
Microwaves, due to their unidirectional properties, are very useful when unicast(one-to-one) communication is needed between the sender and the receiver. They are used in cellular phones, satellite networks and wireless LANs.
There are 2 types of Microwave Transmission :
- Terrestrial Microwave
- Satellite Microwave
Advantages of Microwave Transmission
- Used for long distance telephone communication
- Carries 1000's of voice channels at the same time
Disadvantages of Microwave Transmission
- It is very costly
Terrestrial Microwave
For increasing the distance served by terrestrial microwave, repeaters can be installed with each antenna .The signal received by an antenna can be converted into transmittable form and relayed to next antenna as shown in below figure. It is an example of telephone systems all over the world
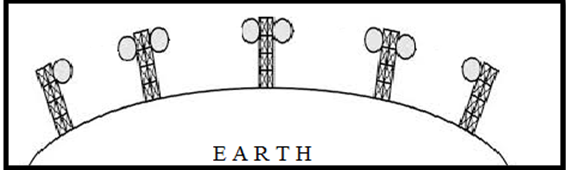
There are two types of antennas used for terrestrial microwave communication :
1. Parabolic Dish Antenna
In this every line parallel to the line of symmetry reflects off the curve at angles in a way that they intersect at a common point called focus. This antenna is based on geometry of parabola.
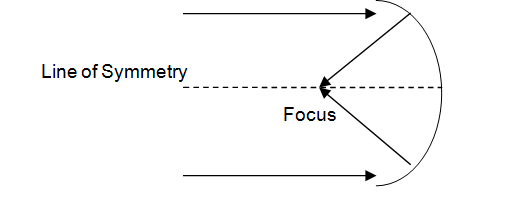
2. Horn Antenna
It is a like gigantic scoop. The outgoing transmissions are broadcast up a stem and deflected outward in a series of narrow parallel beams by curved head.
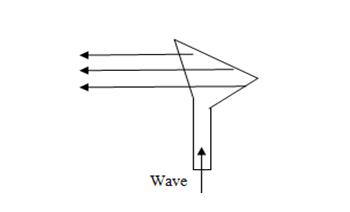
Satellite Microwave
This is a microwave relay station which is placed in outer space. The satellites are launched either by rockets or space shuttles carry them.
These are positioned 36000 Km above the equator with an orbit speed that exactly matches the rotation speed of the earth. As the satellite is positioned in a geo-synchronous orbit, it is stationery relative to earth and always stays over the same point on the ground. This is usually done to allow ground stations to aim antenna at a fixed point in the sky.
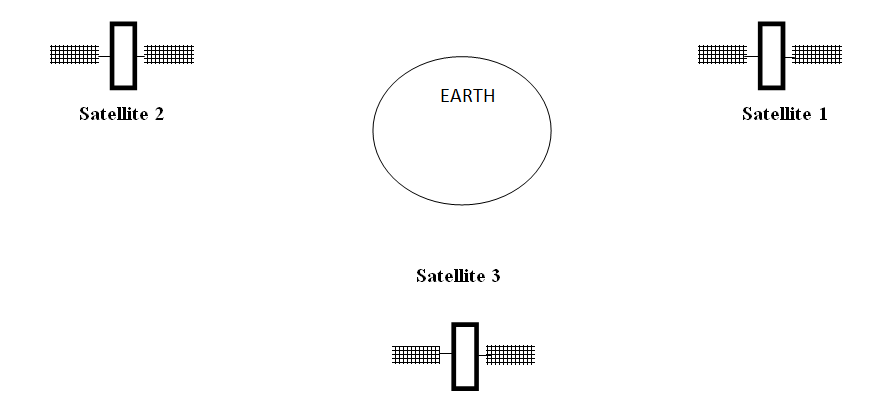
Features of Satellite Microwave
- Bandwidth capacity depends on the frequency used.
- Satellite microwave deployment for orbiting satellite is difficult.
Advantages of Satellite Microwave
- Transmitting station can receive back its own transmission and check whether the satellite has transmitted information correctly.
- A single microwave relay station which is visible from any point.
Disadvantages of Satellite Microwave
- Satellite manufacturing cost is very high
- Cost of launching satellite is very expensive
- Transmission highly depends on whether conditions, it can go down in bad weather
Infrared Waves
Infrared waves, with frequencies from 300 GHz to 400 THz, can be used for short-range communication. Infrared waves, having high frequencies, cannot penetrate walls. This advantageous characteristic prevents interference between one system and another, a short-range communication system in on room cannot be affected by another system in the next room.
When we use infrared remote control, we do not interfere with the use of the remote by our neighbours. However, this same characteristic makes infrared signals useless for long-range communication. In addition, we cannot use infrared waves outside a building because the sun's rays contain infrared waves that can interfere with the communication.
Applications of Infrared Waves
- The infrared band, almost 400 THz, has an excellent potential for data transmission. Such a wide bandwidth can be used to transmit digital data with a very high data rate.
- The Infrared Data Association(IrDA), an association for sponsoring the use of infrared waves, has established standards for using these signals for communication between devices such as keyboards, mouse, PCs and printers.
- Infrared signals can be used for short-range communication in a closed area using line-of-sight propagation.
Types of Communication Networks
Communication Networks can be of following 5 types:
- Local Area Network (LAN)
- Metropolitan Area Network (MAN)
- Wide Area Network (WAN)
- Wireless
- Inter Network (Internet)
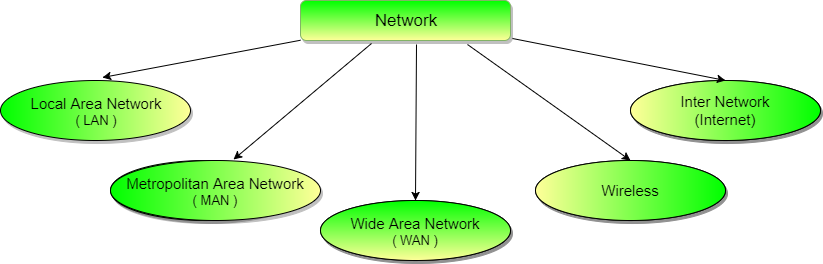
Local Area Network (LAN)
It is also called LAN and designed for small physical areas such as an office, group of buildings or a factory. LANs are used widely as it is easy to design and to troubleshoot. Personal computers and workstations are connected to each other through LANs. We can use different types of topologies through LAN, these are Star, Ring, Bus, Tree etc.
LAN can be a simple network like connecting two computers, to share files and network among each other while it can also be as complex as interconnecting an entire building.
LAN networks are also widely used to share resources like printers, shared hard-drive etc.
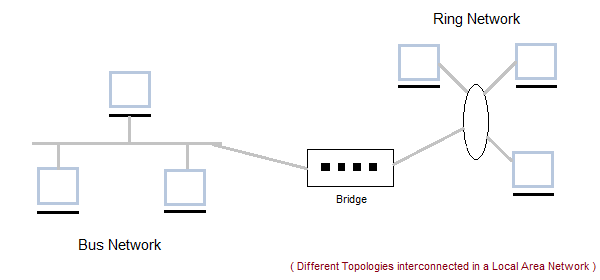
Characteristics of LAN
- LAN's are private networks, not subject to tariffs or other regulatory controls.
- LAN's operate at relatively high speed when compared to the typical WAN.
- There are different types of Media Access Control methods in a LAN, the prominent ones are Ethernet, Token ring.
- It connects computers in a single building, block or campus, i.e. they work in a restricted geographical area.
Applications of LAN
- One of the computer in a network can become a server serving all the remaining computers called clients. Software can be stored on the server and it can be used by the remaining clients.
- Connecting Locally all the workstations in a building to let them communicate with each other locally without any internet access.
- Sharing common resources like printers etc are some common applications of LAN.
Advantages of LAN
- Resource Sharing: Computer resources like printers, modems, DVD-ROM drives and hard disks can be shared with the help of local area networks. This reduces cost and hardware purchases.
- Software Applications Sharing: It is cheaper to use same software over network instead of purchasing separate licensed software for each client a network.
- Easy and Cheap Communication: Data and messages can easily be transferred over networked computers.
- Centralized Data: The data of all network users can be saved on hard disk of the server computer. This will help users to use any workstation in a network to access their data. Because data is not stored on workstations locally.
- Data Security: Since, data is stored on server computer centrally, it will be easy to manage data at only one place and the data will be more secure too.
- Internet Sharing: Local Area Network provides the facility to share a single internet connection among all the LAN users. In Net Cafes, single internet connection sharing system keeps the internet expenses cheaper.
Disadvantages of LAN
- High Setup Cost: Although the LAN will save cost over time due to shared computer resources, but the initial setup costs of installing Local Area Networks is high.
- Privacy Violations: The LAN administrator has the rights to check personal data files of each and every LAN user. Moreover he can check the internet history and computer use history of the LAN user.
- Data Security Threat: Unauthorised users can access important data of an organization if centralized data repository is not secured properly by the LAN administrator.
- LAN Maintenance Job: Local Area Network requires a LAN Administrator because, there are problems of software installations or hardware failures or cable disturbances in Local Area Network. A LAN Administrator is needed at this full time job.
- Covers Limited Area: Local Area Network covers a small area like one office, one building or a group of nearby buildings.
Metropolitan Area Network (MAN)
It was developed in 1980s.It is basically a bigger version of LAN. It is also called MAN and uses the similar technology as LAN. It is designed to extend over the entire city. It can be means to connecting a number of LANs into a larger network or it can be a single cable. It is mainly hold and operated by single private company or a public company.
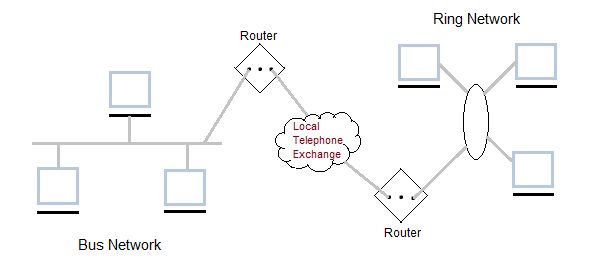
Characteristics of MAN
- It generally covers towns and cities (50 km)
- Communication medium used for MAN are optical fibers, cables etc.
- Data rates adequate for distributed computing applications.
Advantages of MAN
- Extremely efficient and provide fast communication via high-speed carriers, such as fibre optic cables.
- It provides a good back bone for large network and provides greater access to WANs.
- The dual bus used in MAN helps the transmission of data in both directions simultaneously.
- A MAN usually encompasses several blocks of a city or an entire city.
Disadvantages of MAN
- More cable required for a MAN connection from one place to another.
- It is difficult to make the system secure from hackers and industrial espionage(spying) graphical regions.
Wide Area Network (WAN)
It is also called WAN. WAN can be private or it can be public leased network. It is used for the network that covers large distance such as cover states of a country. It is not easy to design and maintain. Communication medium used by WAN are PSTN or Satellite links. WAN operates on low data rates.
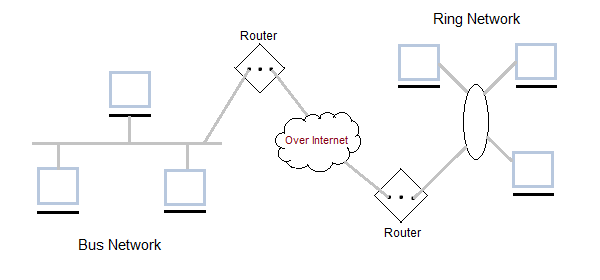
Characteristics of WAN
- It generally covers large distances(states, countries, continents).
- Communication medium used are satellite, public telephone networks which are connected by routers.
Advantages of WAN
- Covers a large geographical area so long distance business can connect on the one network.
- Shares software and resources with connecting workstations.
- Messages can be sent very quickly to anyone else on the network. These messages can have picture, sounds or data included with them(called attachments).
- Expensive things(such as printers or phone lines to the internet) can be shared by all the computers on the network without having to buy a different peripheral for each computer.
- Everyone on the network can use the same data. This avoids problems where some users may have older information than others.
Disadvantages of WAN
- Need a good firewall to restrict outsiders from entering and disrupting the network.
- Setting up a network can be an expensive, slow and complicated. The bigger the network the more expensive it is.
- Once set up, maintaining a network is a full-time job which requires network supervisors and technicians to be employed.
- Security is a real issue when many different people have the ability to use information from other computers. Protection against hackers and viruses adds more complexity and expense.
Wireless Network
Digital wireless communication is not a new idea. Earlier, Morse code was used to implement wireless networks. Modern digital wireless systems have better performance, but the basic idea is the same.
Wireless Networks can be divided into three main categories:
- System interconnection
- Wireless LANs
- Wireless WANs
System Interconnection
System interconnection is all about interconnecting the components of a computer using short-range radio. Some companies got together to design a short-range wireless network called Bluetooth to connect various components such as monitor, keyboard, mouse and printer, to the main unit, without wires. Bluetooth also allows digital cameras, headsets, scanners and other devices to connect to a computer by merely being brought within range.
In simplest form, system interconnection networks use the master-slave concept. The system unit is normally the master, talking to the mouse, keyboard, etc. as slaves.
Wireless LANs
These are the systems in which every computer has a radio modem and antenna with which it can communicate with other systems. Wireless LANs are becoming increasingly common in small offices and homes, where installing Ethernet is considered too much trouble. There is a standard for wireless LANs called IEEE 802.11, which most systems implement and which is becoming very widespread.
Wireless WANs
The radio network used for cellular telephones is an example of a low-bandwidth wireless WAN. This system has already gone through three generations.
- The first generation was analog and for voice only.
- The second generation was digital and for voice only.
- The third generation is digital and is for both voice and data.
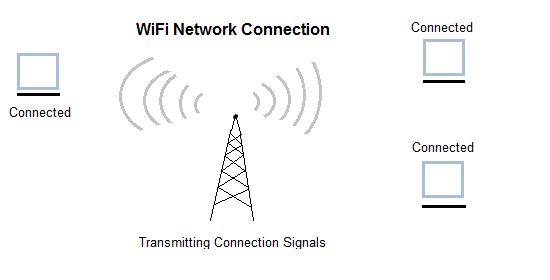
Inter Network
Inter Network or Internet is a combination of two or more networks. Inter network can be formed by joining two or more individual networks by means of various devices such as routers, gateways and bridges.
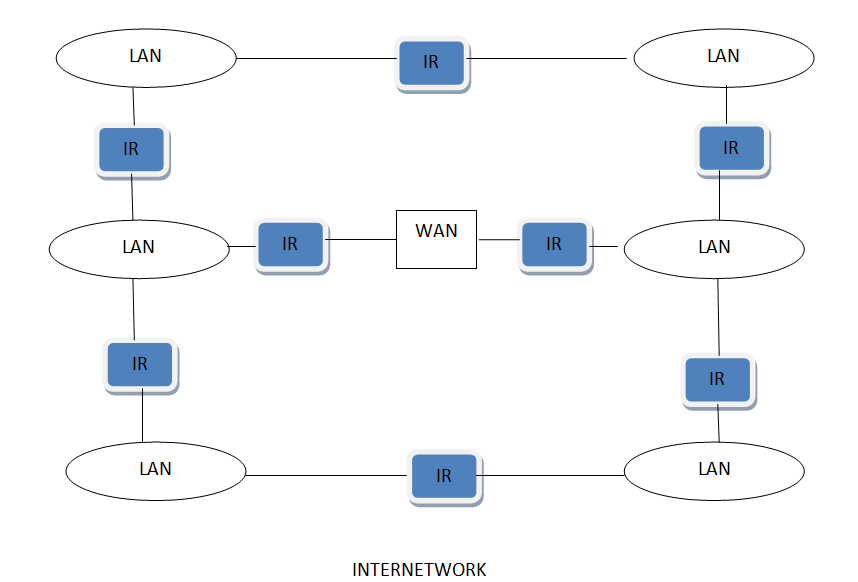
Connection Oriented and Connectionless Services
These are the two services given by the layers to layers above them. These services are:
- Connection Oriented Service
- Connectionless Services
Connection Oriented Services
There is a sequence of operation to be followed by the users of connection oriented service. These are:
- Connection is established.
- Information is sent.
- Connection is released.
In connection oriented service we have to establish a connection before starting the communication. When connection is established, we send the message or the information and then we release the connection.
Connection oriented service is more reliable than connectionless service. We can send the message in connection oriented service if there is an error at the receivers end. Example of connection oriented is TCP (Transmission Control Protocol) protocol.
Connection Less Services
It is similar to the postal services, as it carries the full address where the message (letter) is to be carried. Each message is routed independently from source to destination. The order of message sent can be different from the order received.
In connectionless the data is transferred in one direction from source to destination without checking that destination is still there or not or if it prepared to accept the message. Authentication is not needed in this. Example of Connectionless service is UDP (User Datagram Protocol) protocol.
Difference: Connection oriented and Connectionless service
- In connection oriented service authentication is needed, while connectionless service does not need any authentication.
- Connection oriented protocol makes a connection and checks whether message is received or not and sends again if an error occurs, while connectionless service protocol does not guarantees a message delivery.
- Connection oriented service is more reliable than connectionless service.
- Connection oriented service interface is stream based and connectionless is message based.
What are Service Primitives?
A service is formally specified by a set of primitives (operations) available to a user process to access the service. These primitives tell the service to perform some action or report on an action taken by a peer entity. If the protocol stack is located in the operating system, as it often is, the primitives are normally system calls. These calls cause a trap to kernel mode, which then turns control of the machine over to the operating system to send the necessary packets. The set of primitives available depends on the nature of the service being provided. The primitives for connection-oriented service are different from those of connection-less service. There are five types of service primitives :
- LISTEN : When a server is ready to accept an incoming connection it executes the LISTEN primitive. It blocks waiting for an incoming connection.
- CONNECT : It connects the server by establishing a connection. Response is awaited.
- RECIEVE: Then the RECIEVE call blocks the server.
- SEND : Then the client executes SEND primitive to transmit its request followed by the execution of RECIEVE to get the reply. Send the message.
- DISCONNECT : This primitive is used for terminating the connection. After this primitive one can't send any message. When the client sends DISCONNECT packet then the server also sends the DISCONNECT packet to acknowledge the client. When the server package is received by client then the process is terminated.
Connection Oriented Service Primitives
There are 5 types of primitives for Connection Oriented Service :
| LISTEN | Block waiting for an incoming connection |
| CONNECTION | Establish a connection with a waiting peer |
| RECEIVE | Block waiting for an incoming message |
| SEND | Sending a message to the peer |
| DISCONNECT | Terminate a connection |
Connectionless Service Primitives
There are 4 types of primitives for Connectionless Oriented Service:
| UNIDATA | This primitive sends a packet of data |
| FACILITY, REPORT | Primitive for enquiring about the performance of the network, like delivery statistics. |
Relationship of Services to Protocol
In this section we will learn about how services and protocols are related and why they are so important for each other.
What are Services?
These are the operations that a layer can provide to the layer above it in the OSI Reference model. It defines the operation and states a layer is ready to perform but it does not specify anything about the implementation of these operations.
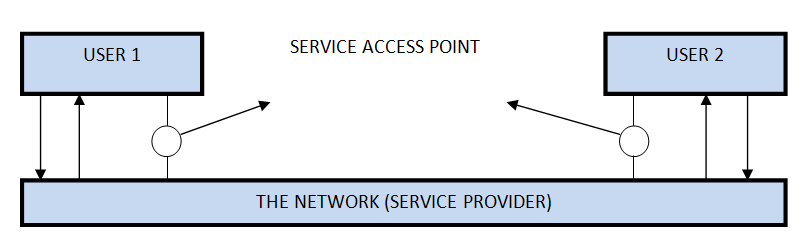
What are Protocols?
These are set of rules that govern the format and meaning of frames, messages or packets that are exchanged between the server and client.
Reference Models in Communication Networks
The most important reference models are :
- OSI reference model.
- TCP/IP reference model.
Introduction to ISO-OSI Model
There are many users who use computer network and are located all over the world. To ensure national and worldwide data communication ISO (ISO stands for International Organization of Standardization.) developed this model. This is called a model for open system interconnection (OSI) and is normally called as OSI model.OSI model architecture consists of seven layers. It defines seven layers or levels in a complete communication system. OSI Reference model is explained in other chapter.
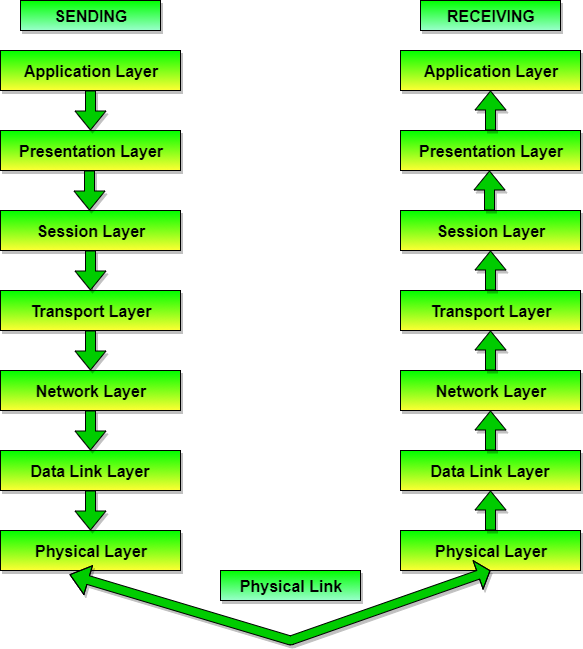
Introduction to TCP/IP Reference Model
TCP/IP is transmission control protocol and internet protocol. Protocols are set of rules which govern every possible communication over the internet. These protocols describe the movement of data between the host computers or internet and offers simple naming and addressing schemes.
TCP/IP Reference model is explained in details other chapter.
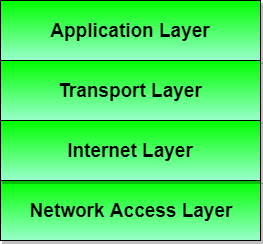
The OSI Model - Features, Principles and Layers
There are
n numbers of users who use computer network and are located over the world. So to ensure, national and worldwide data communication, systems must be developed which are compatible to communicate with each other ISO has developed a standard. ISO stands for International organization of Standardization. This is called a model for Open System Interconnection (OSI) and is commonly known as OSI model.
The ISO-OSI model is a seven layer architecture. It defines seven layers or levels in a complete communication system. They are:
- Application Layer
- Presentation Layer
- Session Layer
- Transport Layer
- Network Layer
- Datalink Layer
- Physical Layer
Below we have the complete representation of the OSI model, showcasing all the layers and how they communicate with each other.
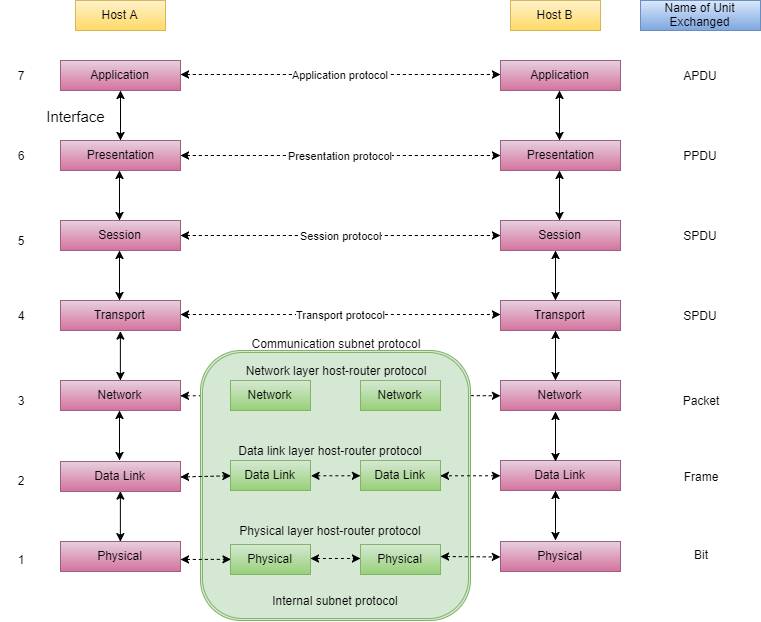
In the table below, we have specified the protocols used and the data unit exchanged by each layer of the OSI Model.
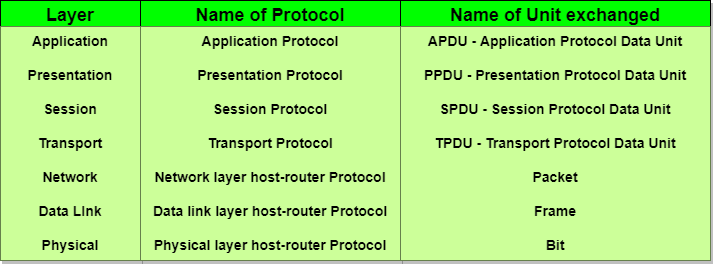
Feature of OSI Model
- Big picture of communication over network is understandable through this OSI model.
- We see how hardware and software work together.
- We can understand new technologies as they are developed.
- Troubleshooting is easier by separate networks.
- Can be used to compare basic functional relationships on different networks.
Principles of OSI Reference Model
The OSI reference model has 7 layers. The principles that were applied to arrive at the seven layers can be briefly summarized as follows:
- A layer should be created where a different abstraction is needed.
- Each layer should perform a well-defined function.
- The function of each layer should be chosen with an eye toward defining internationally standardized protocols.
- The layer boundaries should be chosen to minimize the information flow across the interfaces.
- The number of layers should be large enough that distinct functions need not be thrown together in the same layer out of necessity and small enough that architecture does not become unwieldly.
Functions of Different Layers
Following are the functions performed by each layer of the OSI model. This is just an introduction, we will cover each layer in details in the coming tutorials.
OSI Model Layer 1: The Physical Layer
- Physical Layer is the lowest layer of the OSI Model.
- It activates, maintains and deactivates the physical connection.
- It is responsible for transmission and reception of the unstructured raw data over network.
- Voltages and data rates needed for transmission is defined in the physical layer.
- It converts the digital/analog bits into electrical signal or optical signals.
- Data encoding is also done in this layer.
OSI Model Layer 2: Data Link Layer
- Data link layer synchronizes the information which is to be transmitted over the physical layer.
- The main function of this layer is to make sure data transfer is error free from one node to another, over the physical layer.
- Transmitting and receiving data frames sequentially is managed by this layer.
- This layer sends and expects acknowledgements for frames received and sent respectively. Resending of non-acknowledgement received frames is also handled by this layer.
- This layer establishes a logical layer between two nodes and also manages the Frame traffic control over the network. It signals the transmitting node to stop, when the frame buffers are full.
OSI Model Layer 3: The Network Layer
- Network Layer routes the signal through different channels from one node to other.
- It acts as a network controller. It manages the Subnet traffic.
- It decides by which route data should take.
- It divides the outgoing messages into packets and assembles the incoming packets into messages for higher levels.
OSI Model Layer 4: Transport Layer
- Transport Layer decides if data transmission should be on parallel path or single path.
- Functions such as Multiplexing, Segmenting or Splitting on the data are done by this layer
- It receives messages from the Session layer above it, convert the message into smaller units and passes it on to the Network layer.
- Transport layer can be very complex, depending upon the network requirements.
Transport layer breaks the message (data) into small units so that they are handled more efficiently by the network layer.
OSI Model Layer 5: The Session Layer
- Session Layer manages and synchronize the conversation between two different applications.
- Transfer of data from source to destination session layer streams of data are marked and are resynchronized properly, so that the ends of the messages are not cut prematurely and data loss is avoided.
OSI Model Layer 6: The Presentation Layer
- Presentation Layer takes care that the data is sent in such a way that the receiver will understand the information (data) and will be able to use the data.
- While receiving the data, presentation layer transforms the data to be ready for the application layer.
- Languages(syntax) can be different of the two communicating systems. Under this condition presentation layer plays a role of translator.
- It perfroms Data compression, Data encryption, Data conversion etc.
OSI Model Layer 7: Application Layer
- Application Layer is the topmost layer.
- Transferring of files disturbing the results to the user is also done in this layer. Mail services, directory services, network resource etc are services provided by application layer.
- This layer mainly holds application programs to act upon the received and to be sent data.
Merits of OSI reference model
- OSI model distinguishes well between the services, interfaces and protocols.
- Protocols of OSI model are very well hidden.
- Protocols can be replaced by new protocols as technology changes.
- Supports connection oriented services as well as connectionless service.
Demerits of OSI reference model
- Model was devised before the invention of protocols.
- Fitting of protocols is tedious task.
- It is just used as a reference model.
Physical Layer - OSI Reference Model
Physical layer is the lowest layer of the OSI reference model. It is responsible for sending bits from one computer to another. This layer is not concerned with the meaning of the bits and deals with the setup of physical connection to the network and with transmission and reception of signals.
Functions of Physical Layer
Following are the various functions performed by the Physical layer of the OSI model.
- Representation of Bits: Data in this layer consists of stream of bits. The bits must be encoded into signals for transmission. It defines the type of encoding i.e. how 0's and 1's are changed to signal.
- Data Rate: This layer defines the rate of transmission which is the number of bits per second.
- Synchronization: It deals with the synchronization of the transmitter and receiver. The sender and receiver are synchronized at bit level.
- Interface: The physical layer defines the transmission interface between devices and transmission medium.
- Line Configuration: This layer connects devices with the medium: Point to Point configuration and Multipoint configuration.
- Topologies: Devices must be connected using the following topologies: Mesh, Star, Ring and Bus.
- Transmission Modes: Physical Layer defines the direction of transmission between two devices: Simplex, Half Duplex, Full Duplex.
- Deals with baseband and broadband transmission.
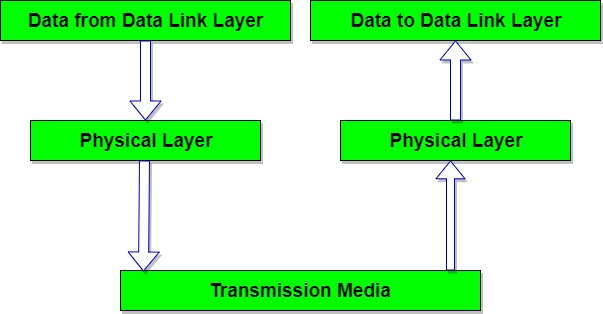
Design Issues with Physical Layer
- The Physical Layer is concerned with transmitting raw bits over a communication channel.
- The design issue has to do with making sure that when one side sends a
1bit, it is received by the other side as a1bit and not as a0bit. - Typical questions here are:
- How many volts should be used to represent a
1bit and how many for a0? - How many nanoseconds a bit lasts?
- Whether transmission may proceed simultaneously in both directions?
- Whether transmission may proceed simultaneously in both directions?
- How many pins the network connector has and what each pin is used for?
- How many volts should be used to represent a
- The design issues here largely deal with mechanical, electrical and timing interfaces, and the physical transmission medium, which lies below the physical layer.
Data Link Layer - OSI Model
Data link layer performs the most reliable node to node delivery of data. It forms frames from the packets that are received from network layer and gives it to physical layer. It also synchronizes the information which is to be transmitted over the data. Error controlling is easily done. The encoded data are then passed to physical.
Error detection bits are used by the data link layer. It also corrects the errors. Outgoing messages are assembled into frames. Then the system waits for the acknowledgements to be received after the transmission. It is reliable to send message.
The main task of the data link layer is to transform a raw transmission facility into a line that appears free of undetected transmission errors to the network layer. It accomplishes this task by having the sender break up the input data into data frames(typically a few hundred or few thousand bytes) and transmit the frames sequentially. If the service is reliable, the receiver confirms correct receipt of each frame by send back an acknowledgement frame.
Functions of Data Link Layer
- Framing: Frames are the streams of bits received from the network layer into manageable data units. This division of stream of bits is done by Data Link Layer.
- Physical Addressing: The Data Link layer adds a header to the frame in order to define physical address of the sender or receiver of the frame, if the frames are to be distributed to different systems on the network.
- Flow Control: A flow control mechanism to avoid a fast transmitter from running a slow receiver by buffering the extra bit is provided by flow control. This prevents traffic jam at the receiver side.
- Error Control: Error control is achieved by adding a trailer at the end of the frame. Duplication of frames are also prevented by using this mechanism. Data Link Layers adds mechanism to prevent duplication of frames.
- Access Control: Protocols of this layer determine which of the devices has control over the link at any given time, when two or more devices are connected to the same link.
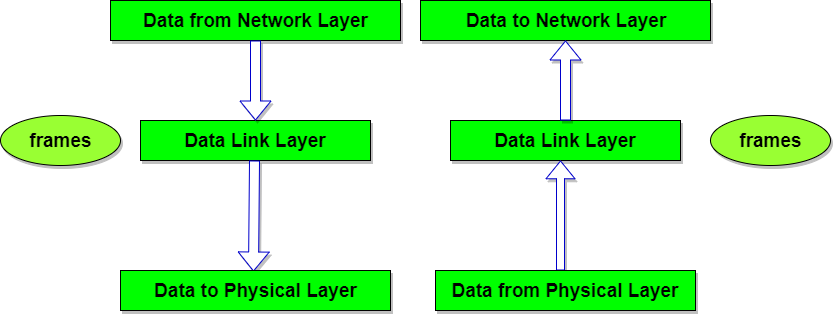
Design Issues with Data Link Layer
- The issue that arises in the data link layer(and most of the higher layers as well) is how to keep a fast transmitter from drowning a slow receiver in data. Some traffic regulation mechanism is often needed to let the transmitter know how much buffer space the receiver has at the moment. Frequently, the flow regulation and the error handling are integrated.
- Broadcast networks have an additional issue in the data link layer: How to control access to the shared channel. A special sublayer of the data link layer, the Medium Access Control(MAC) sublayer, deals with this problem.
Network Layer - OSI Model
The network Layer controls the operation of the subnet. The main aim of this layer is to deliver packets from source to destination across multiple links (networks). If two computers (system) are connected on the same link, then there is no need for a network layer. It routes the signal through different channels to the other end and acts as a network controller.
It also divides the outgoing messages into packets and to assemble incoming packets into messages for higher levels.
In broadcast networks, the routing problem is simple, so the network layer is often thin or even non-existent.
Functions of Network Layer
- It translates logical network address into physical address. Concerned with circuit, message or packet switching.
- Routers and gateways operate in the network layer. Mechanism is provided by Network Layer for routing the packets to final destination.
- Connection services are provided including network layer flow control, network layer error control and packet sequence control.
- Breaks larger packets into small packets.
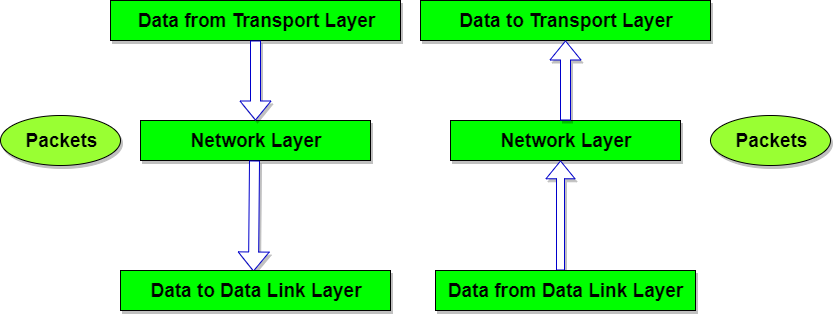
Design Issues with Network Layer
- A key design issue is determining how packets are routed from source to destination. Routes can be based on static tables that are wired into the network and rarely changed. They can also be highly dynamic, being determined anew for each packet, to reflect the current network load.
- If too many packets are present in the subnet at the same time, they will get into one another's way, forming bottlenecks. The control of such congestion also belongs to the network layer.
- Moreover, the quality of service provided(delay, transmit time, jitter, etc) is also a network layer issue.
- When a packet has to travel from one network to another to get to its destination, many problems can arise such as:
- The addressing used by the second network may be different from the first one.
- The second one may not accept the packet at all because it is too large.
- The protocols may differ, and so on.
- It is up to the network layer to overcome all these problems to allow heterogeneous networks to be interconnected.
Transport Layer - OSI Model
The basic function of the Transport layer is to accept data from the layer above, split it up into smaller units, pass these data units to the Network layer, and ensure that all the pieces arrive correctly at the other end.
Furthermore, all this must be done efficiently and in a way that isolates the upper layers from the inevitable changes in the hardware technology.
The Transport layer also determines what type of service to provide to the Session layer, and, ultimately, to the users of the network. The most popular type of transport connection is an error-free point-to-point channel that delivers messages or bytes in the order in which they were sent.
The Transport layer is a true end-to-end layer, all the way from the source to the destination. In other words, a program on the source machine carries on a conversation with a similar program on the destination machine, using the message headers and control messages.
Functions of Transport Layer
- Service Point Addressing: Transport Layer header includes service point address which is port address. This layer gets the message to the correct process on the computer unlike Network Layer, which gets each packet to the correct computer.
- Segmentation and Reassembling: A message is divided into segments; each segment contains sequence number, which enables this layer in reassembling the message. Message is reassembled correctly upon arrival at the destination and replaces packets which were lost in transmission.
- Connection Control: It includes 2 types:
- Connectionless Transport Layer : Each segment is considered as an independent packet and delivered to the transport layer at the destination machine.
- Connection Oriented Transport Layer : Before delivering packets, connection is made with transport layer at the destination machine.
- Flow Control: In this layer, flow control is performed end to end.
- Error Control: Error Control is performed end to end in this layer to ensure that the complete message arrives at the receiving transport layer without any error. Error Correction is done through retransmission.

Design Issues with Transport Layer
- Accepting data from Session layer, split it into segments and send to the network layer.
- Ensure correct delivery of data with efficiency.
- Isolate upper layers from the technological changes.
- Error control and flow control.
Session Layer - OSI Model
The Session Layer allows users on different machines to establish active communication sessions between them.
It's main aim is to establish, maintain and synchronize the interaction between communicating systems. Session layer manages and synchronize the conversation between two different applications. In Session layer, streams of data are marked and are resynchronized properly, so that the ends of the messages are not cut prematurely and data loss is avoided.
Functions of Session Layer
- Dialog Control : This layer allows two systems to start communication with each other in half-duplex or full-duplex.
- Token Management: This layer prevents two parties from attempting the same critical operation at the same time.
- Synchronization : This layer allows a process to add checkpoints which are considered as synchronization points into stream of data. Example: If a system is sending a file of 800 pages, adding checkpoints after every 50 pages is recommended. This ensures that 50 page unit is successfully received and acknowledged. This is beneficial at the time of crash as if a crash happens at page number 110; there is no need to retransmit 1 to100 pages.
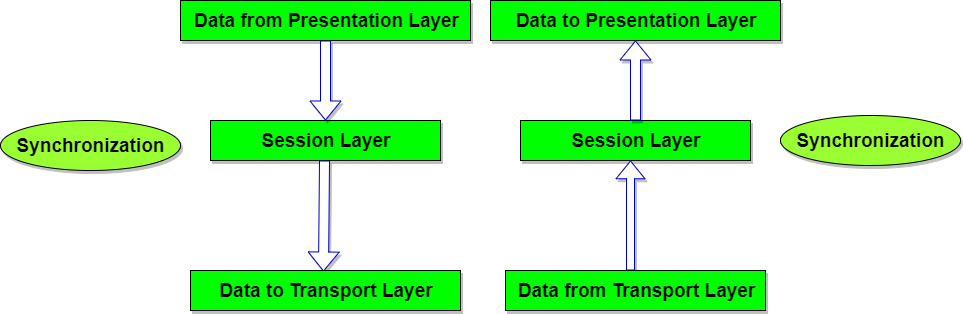
Design Issues with Session Layer
- To allow machines to establish sessions between them in a seamless fashion.
- Provide enhanced services to the user.
- To manage dialog control.
- To provide services such as Token management and Synchronization.
Presentation Layer - OSI Model
The primary goal of this layer is to take care of the syntax and semantics of the information exchanged between two communicating systems. Presentation layer takes care that the data is sent in such a way that the receiver will understand the information(data) and will be able to use the data. Languages(syntax) can be different of the two communicating systems. Under this condition presentation layer plays a role translator.
In order to make it possible for computers with different data representations to communicate, the data structures to be exchanged can be defined in an abstract way. The presentation layer manages these abstract data structures and allows higher-level data structures(eg: banking records), to be defined and exchanged.
Functions of Presentation Layer
- Translation: Before being transmitted, information in the form of characters and numbers should be changed to bit streams. The presentation layer is responsible for interoperability between encoding methods as different computers use different encoding methods. It translates data between the formats the network requires and the format the computer.
- Encryption: It carries out encryption at the transmitter and decryption at the receiver.
- Compression: It carries out data compression to reduce the bandwidth of the data to be transmitted. The primary role of Data compression is to reduce the number of bits to be 0transmitted. It is important in transmitting multimedia such as audio, video, text etc.
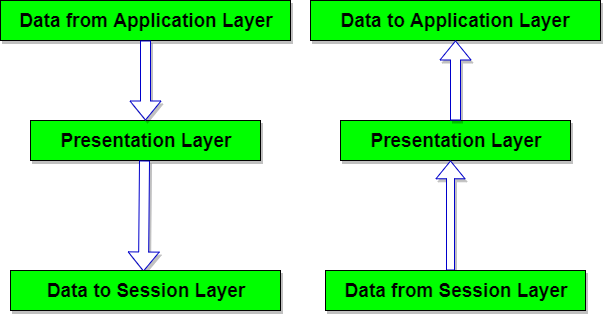
Design Issues with Presentation Layer
- To manage and maintain the Syntax and Semantics of the information transmitted.
- Encoding data in a standard agreed upon way. Eg: String, double, date, etc.
- Perform Standard Encoding on wire.
Application Layer - OSI Model
It is the top most layer of OSI Model. Manipulation of data(information) in various ways is done in this layer which enables user or software to get access to the network. Some services provided by this layer includes: E-Mail, transferring files, distributing the results to user, directory services, network resources, etc.
The Application Layer contains a variety of protocols that are commonly needed by users. One widely-used application protocol is HTTP(HyperText Transfer Protocol), which is the basis for the World Wide Web. When a browser wants a web page, it sends the name of the page it wants to the server using HTTP. The server then sends the page back.
Other Application protocols that are used are: File Transfer Protocol(FTP), Trivial File Transfer Protocol(TFTP), Simple Mail Transfer Protocol(SMTP), TELNET, Domain Name System(DNS) etc.
Functions of Application Layer
- Mail Services: This layer provides the basis for E-mail forwarding and storage.
- Network Virtual Terminal: It allows a user to log on to a remote host. The application creates software emulation of a terminal at the remote host. User's computer talks to the software terminal which in turn talks to the host and vice versa. Then the remote host believes it is communicating with one of its own terminals and allows user to log on.
- Directory Services: This layer provides access for global information about various services.
- File Transfer, Access and Management (FTAM): It is a standard mechanism to access files and manages it. Users can access files in a remote computer and manage it. They can also retrieve files from a remote computer.
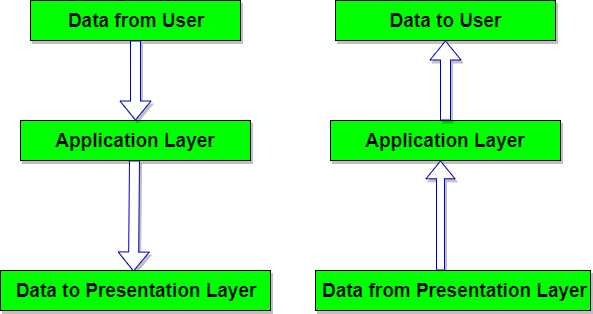
Design Issues with Application Layer
There are commonly reoccurring problems that occur in the design and implementation of Application Layer protocols and can be addressed by patterns from several different pattern languages:
- Pattern Language for Application-level Communication Protocols
- Service Design Patterns
- Patterns of Enterprise Application Architecture
- Pattern-Oriented Software Architecture
The TCP/IP Reference Model
TCP/IP means Transmission Control Protocol and Internet Protocol. It is the network model used in the current Internet architecture as well. Protocols are set of rules which govern every possible communication over a network. These protocols describe the movement of data between the source and destination or the internet. They also offer simple naming and addressing schemes.
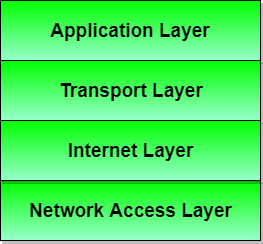
Protocols and networks in the TCP/IP model:
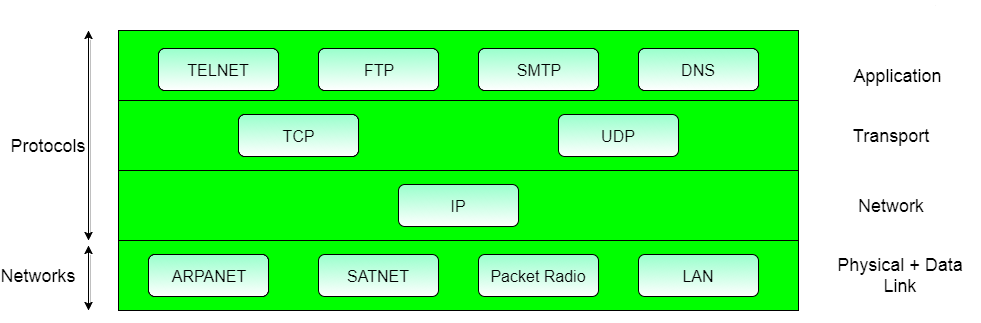
Overview of TCP/IP reference model
TCP/IP that is Transmission Control Protocol and Internet Protocol was developed by Department of Defence's Project Research Agency (ARPA, later DARPA) as a part of a research project of network interconnection to connect remote machines.
The features that stood out during the research, which led to making the TCP/IP reference model were:
- Support for a flexible architecture. Adding more machines to a network was easy.
- The network was robust, and connections remained intact untill the source and destination machines were functioning.
The overall idea was to allow one application on one computer to talk to(send data packets) another application running on different computer.
Different Layers of TCP/IP Reference Model
Below we have discussed the 4 layers that form the TCP/IP reference model:
Layer 1: Host-to-network Layer
- Lowest layer of the all.
- Protocol is used to connect to the host, so that the packets can be sent over it.
- Varies from host to host and network to network.
Layer 2: Internet layer
- Selection of a packet switching network which is based on a connectionless internetwork layer is called a internet layer.
- It is the layer which holds the whole architecture together.
- It helps the packet to travel independently to the destination.
- Order in which packets are received is different from the way they are sent.
- IP (Internet Protocol) is used in this layer.
- The various functions performed by the Internet Layer are:
- Delivering IP packets
- Performing routing
- Avoiding congestion
Layer 3: Transport Layer
- It decides if data transmission should be on parallel path or single path.
- Functions such as multiplexing, segmenting or splitting on the data is done by transport layer.
- The applications can read and write to the transport layer.
- Transport layer adds header information to the data.
- Transport layer breaks the message (data) into small units so that they are handled more efficiently by the network layer.
- Transport layer also arrange the packets to be sent, in sequence.
Layer 4: Application Layer
The TCP/IP specifications described a lot of applications that were at the top of the protocol stack. Some of them were TELNET, FTP, SMTP, DNS etc.
- TELNET is a two-way communication protocol which allows connecting to a remote machine and run applications on it.
- FTP(File Transfer Protocol) is a protocol, that allows File transfer amongst computer users connected over a network. It is reliable, simple and efficient.
- SMTP(Simple Mail Transport Protocol) is a protocol, which is used to transport electronic mail between a source and destination, directed via a route.
- DNS(Domain Name Server) resolves an IP address into a textual address for Hosts connected over a network.
- It allows peer entities to carry conversation.
- It defines two end-to-end protocols: TCP and UDP
- TCP(Transmission Control Protocol): It is a reliable connection-oriented protocol which handles byte-stream from source to destination without error and flow control.
- UDP(User-Datagram Protocol): It is an unreliable connection-less protocol that do not want TCPs, sequencing and flow control. Eg: One-shot request-reply kind of service.
Merits of TCP/IP model
- It operated independently.
- It is scalable.
- Client/server architecture.
- Supports a number of routing protocols.
- Can be used to establish a connection between two computers.
Demerits of TCP/IP
- In this, the transport layer does not guarantee delivery of packets.
- The model cannot be used in any other application.
- Replacing protocol is not easy.
- It has not clearly separated its services, interfaces and protocols.
Comparison of OSI and TCP/IP Reference Model
Now it's time to compare both the reference model that we have learned till now. Let's start by addressing the similarities that both of these models have.
Following are some similarities between OSI Reference Model and TCP/IP Reference Model.
- Both have layered architecture.
- Layers provide similar functionalities.
- Both are protocol stack.
- Both are reference models.
Difference between OSI and TCP/IP Reference Model
Following are some major differences between OSI Reference Model and TCP/IP Reference Model, with diagrammatic comparison below.
| OSI(Open System Interconnection) | TCP/IP(Transmission Control Protocol / Internet Protocol) |
|---|---|
| 1. OSI is a generic, protocol independent standard, acting as a communication gateway between the network and end user. | 1. TCP/IP model is based on standard protocols around which the Internet has developed. It is a communication protocol, which allows connection of hosts over a network. |
| 2. In OSI model the transport layer guarantees the delivery of packets. | 2. In TCP/IP model the transport layer does not guarantees delivery of packets. Still the TCP/IP model is more reliable. |
| 3. Follows vertical approach. | 3. Follows horizontal approach. |
| 4. OSI model has a separate Presentation layer and Session layer. | 4. TCP/IP does not have a separate Presentation layer or Session layer. |
| 5. Transport Layer is Connection Oriented. | 5. Transport Layer is both Connection Oriented and Connection less. |
| 6. Network Layer is both Connection Oriented and Connection less. | 6. Network Layer is Connection less. |
| 7. OSI is a reference model around which the networks are built. Generally it is used as a guidance tool. | 7. TCP/IP model is, in a way implementation of the OSI model. |
| 8. Network layer of OSI model provides both connection oriented and connectionless service. | 8. The Network layer in TCP/IP model provides connectionless service. |
| 9. OSI model has a problem of fitting the protocols into the model. | 9. TCP/IP model does not fit any protocol |
| 10. Protocols are hidden in OSI model and are easily replaced as the technology changes. | 10. In TCP/IP replacing protocol is not easy. |
| 11. OSI model defines services, interfaces and protocols very clearly and makes clear distinction between them. It is protocol independent. | 11. In TCP/IP, services, interfaces and protocols are not clearly separated. It is also protocol dependent. |
| 12. It has 7 layers | 12. It has 4 layers |
Diagrammatic Comparison between OSI Reference Model and TCP/IP Reference Model
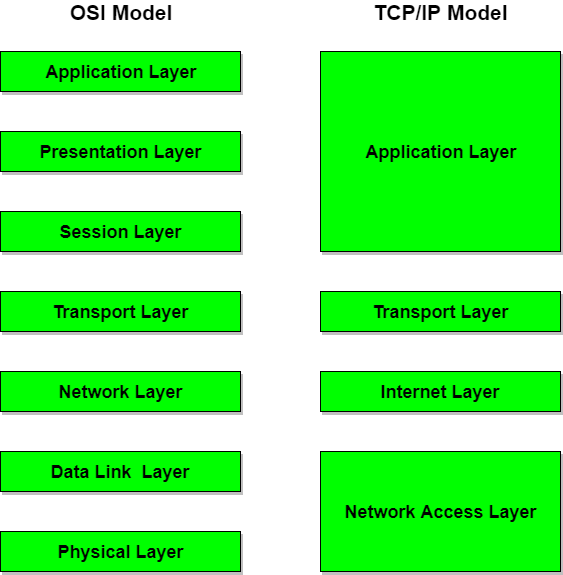
KEY TERMS in Computer Networks
Following are some important terms, which are frequently used in context of Computer Networks.
| Terms | Definition |
|---|---|
| 1. ISO | The OSI model is a product of the Open Systems Interconnection project at the International Organization for Standardization. ISO is a voluntary organization. |
| 2. OSI Model | Open System Interconnection is a model consisting of seven logical layers. |
| 3. TCP/IP Model | Transmission Control Protocol and Internet Protocol Model is based on four layer model which is based on Protocols. |
| 4. UTP | Unshielded Twisted Pair cable is a Wired/Guided media which consists of two conductors usually copper, each with its own colour plastic insulator |
| 5. STP | Shielded Twisted Pair cable is a Wired/Guided media has a metal foil or braided-mesh covering which encases each pair of insulated conductors. Shielding also eliminates crosstalk |
| 6. PPP | Point-to-Point connection is a protocol which is used as a communication link between two devices. |
| 7. LAN | Local Area Network is designed for small areas such as an office, group of building or a factory. |
| 8. WAN | Wide Area Network is used for the network that covers large distance such as cover states of a country |
| 9. MAN | Metropolitan Area Network uses the similar technology as LAN. It is designed to extend over the entire city. |
| 10. Crosstalk | Undesired effect of one circuit on another circuit. It can occur when one line picks up some signals travelling down another line. Example: telephone conversation when one can hear background conversations. It can be eliminated by shielding each pair of twisted pair cable. |
| 11. PSTN | Public Switched Telephone Network consists of telephone lines, cellular networks, satellites for communication, fiber optic cables etc. It is the combination of world's (national, local and regional) circuit switched telephone network. |
| 12. File Transfer, Access and Management (FTAM) | Standard mechanism to access files and manages it. Users can access files in a remote computer and manage it. |
| 13. Analog Transmission | The signal is continuously variable in amplitude and frequency. Power requirement is high when compared with Digital Transmission. |
| 14. Digital Transmission | It is a sequence of voltage pulses. It is basically a series of discrete pulses. Security is better than Analog Transmission. |
| 15. Asymmetric digital subscriber line(ADSL) | A data communications technology that enables faster data transmission over copper telephone lines than a conventional voice band modem can provide. |
| 16. Access Point | Alternatively referred to as a base station and wireless router, an access point is a wireless receiver which enables a user to connect wirelessly to a network or the Internet. This term can refer to both Wi-Fi and Bluetooth devices. |
| 17. Acknowledgement (ACK) | Short for acknowledgement, ACK is an answer given by another computer or network device indicating to another computer that it acknowledged the SYN/ACK or other request sent to it. Note: If the signal is not properly received an NAK is sent. |
| 18. Active Topology | The term active topology describes a network topology in which the signal is amplified at each step as it passes from one computer to the next. |
| 19. Aloha | Protocol for satellite and terrestrial radio transmissions. In pure Aloha, a user can communicate at any time, but risks collisions with other users' messages. Slotted Aloha reduces the chance of collisions by dividing the channel into time slots and requiring that the user send only at the beginning of a time slot. |
| 20. Address Resolution Protocol(ARP) | ARP is a used with the IP for mapping a 32-bit Internet Protocol address to a MAC address that is recognized in the local network specified in RFC 826. |
XO___XO ++ DW DW Hardware interface design
Hardware interface design (HID) is a cross-disciplinary design field that shapes the physical connection between people and technology in order to create new hardware interfaces that transform purely digital processes into analog methods of interaction. It employs a combination of filmmaking tools, software prototyping, and electronics breadboarding.
Through this parallel visualization and development, hardware interface designers are able to shape a cohesive vision alongside business and engineering that more deeply embeds design throughout every stage of the product. The development of hardware interfaces as a field continues to mature as more things connect to the internet.
Hardware interface designers draw upon industrial design, interaction design and electrical engineering. Interface elements include touchscreens, knobs, buttons, sliders and switches as well as input sensors such as microphones, cameras, and accelerometers.


In the last decade a trend had evolved in the area of human-machine-communication, taking the user experience from haptic, tactile and acoustic interfaces to a more digitally graphical approach. Important tasks that had been assigned to the industrial designers so far, had instead been moved into fields like UI and UX design and usability engineering. The creation of good user interaction was more a question of software than hardware. Things like having to push two buttons on the tape recorder to have them pop back out again and the cradle of some older telephones remain mechanical haptic relicts that have long found their digital nemesis and are waiting to disappear.
However, this excessive use of GUIs in today’s world has led to a worsening impairment of the human cognitive capabilities. Visual interfaces are at the maximum of their upgradability. Even though the resolution of new screens is constantly rising, you can see a change of direction away from the descriptive intuitive design to natural interface strategies, based on learnable habits (Google’s Material Design, Apple’s iOS flat design, Microsoft’s Metro Design Language). Several of the more important commands are not shown directly but can be accessed through dragging, holding and swiping across the screen; gestures which have to be learned once but feel very natural afterwards and are easy to remember.
In the area of controlling these systems, there is a need to move away from GUIs and instead find other means of interaction which use the full capabilities of all our senses. Hardware interface design solves this by taking physical forms and objects and connecting them with digital information to have the user control virtual data flow through grasping, moving and manipulating the used physical forms.
If you see the classic industrial hardware interface design as an “analog” method, it finds its digital counterpart in the HID approach. Instead of translating analog methods of control into a virtual form via a GUI, one can see the TUI as an approach to do the exact opposite: transmitting purely digital processes into analog methods of interaction .
Example hardware interfaces include a computer mouse, TV remote control, kitchen timer, control panel for a nuclear power plant and an aircraft cockpit
User interface design
User interface design (UI) or user interface engineering is the design of user interfaces for machines and software, such as computers, home appliances, mobile devices, and other electronic devices, with the focus on maximizing usability and the user experience. The goal of user interface design is to make the user's interaction as simple and efficient as possible, in terms of accomplishing user goals (user-centered design).
Good user interface design facilitates finishing the task at hand without drawing unnecessary attention to itself. Graphic design and typography are utilized to support its usability, influencing how the user performs certain interactions and improving the aesthetic appeal of the design; design aesthetics may enhance or detract from the ability of users to use the functions of the interface.[1] The design process must balance technical functionality and visual elements (e.g., mental model) to create a system that is not only operational but also usable and adaptable to changing user needs.
Interface design is involved in a wide range of projects from computer systems, to cars, to commercial planes; all of these projects involve much of the same basic human interactions yet also require some unique skills and knowledge. As a result, designers tend to specialize in certain types of projects and have skills centered on their expertise, whether that be software design, user research, web design, or industrial design.
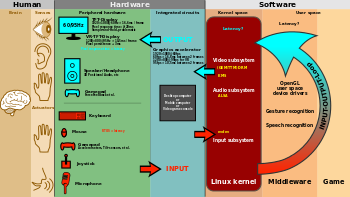
The graphical user interface is presented (displayed) on the computer screen. It is the result of processed user input and usually the primary interface for human-machine interaction. The touch user interfaces popular on small mobile devices are an overlay of the visual output to the visual input.
Processes

User interface design requires a good understanding of user needs. There are several phases and processes in the user interface design, some of which are more demanded upon than others, depending on the project. (Note: for the remainder of this section, the word system is used to denote any project whether it is a website, application, or device.)
- Functionality requirements gathering – assembling a list of the functionality required by the system to accomplish the goals of the project and the potential needs of the users.
- User and task analysis – a form of field research, it's the analysis of the potential users of the system by studying how they perform the tasks that the design must support, and conducting interviews to elucidate their goals.[3] Typical questions involve:
- What would the user want the system to do?
- How would the system fit in with the user's normal workflow or daily activities?
- How technically savvy is the user and what similar systems does the user already use?
- What interface look & feel styles appeal to the user?
- Information architecture – development of the process and/or information flow of the system (i.e. for phone tree systems, this would be an option tree flowchart and for web sites this would be a site flow that shows the hierarchy of the pages).
- Prototyping – development of wire-frames, either in the form of paper prototypes or simple interactive screens. These prototypes are stripped of all look & feel elements and most content in order to concentrate on the interface.
- Usability inspection – letting an evaluator inspect a user interface. This is generally considered to be cheaper to implement than usability testing (see step below), and can be used early on in the development process since it can be used to evaluate prototypes or specifications for the system, which usually cannot be tested on users. Some common usability inspection methods include cognitive walkthrough, which focuses the simplicity to accomplish tasks with the system for new users, heuristic evaluation, in which a set of heuristics are used to identify usability problems in the UI design, and pluralistic walkthrough, in which a selected group of people step through a task scenario and discuss usability issues.
- Usability testing – testing of the prototypes on an actual user—often using a technique called think aloud protocol where you ask the user to talk about their thoughts during the experience. User interface design testing allows the designer to understand the reception of the design from the viewer's standpoint, and thus facilitates creating successful applications.
- Graphical user interface design – actual look and feel design of the final graphical user interface (GUI). It may be based on the findings developed during the user research, and refined to fix any usability problems found through the results of testing.[4]Depending on the type of interface being created, this process typically involves some computer programming in order to validate forms, establish links or perform a desired action.[5]
- Software Maintenance - After the deployment of a new interface, occasional maintenance may be required to fix software bugs, change features, or completely upgrade the system. Once a decision is made to upgrade the interface, the legacy system will undergo another version of the design process, and will begin to repeat the stages of the interface life cycle.[6]
Requirements
The dynamic characteristics of a system are described in terms of the dialogue requirements contained in seven principles of part 10 of the ergonomics standard, the ISO 9241. This standard establishes a framework of ergonomic "principles" for the dialogue techniques with high-level definitions and illustrative applications and examples of the principles. The principles of the dialogue represent the dynamic aspects of the interface and can be mostly regarded as the "feel" of the interface. The seven dialogue principles are:
- Suitability for the task: the dialogue is suitable for a task when it supports the user in the effective and efficient completion of the task.
- Self-descriptiveness: the dialogue is self-descriptive when each dialogue step is immediately comprehensible through feedback from the system or is explained to the user on request.
- Controllability: the dialogue is controllable when the user is able to initiate and control the direction and pace of the interaction until the point at which the goal has been met.
- Conformity with user expectations: the dialogue conforms with user expectations when it is consistent and corresponds to the user characteristics, such as task knowledge, education, experience, and to commonly accepted conventions.
- Error tolerance: the dialogue is error tolerant if despite evident errors in input, the intended result may be achieved with either no or minimal action by the user.
- Suitability for individualization: the dialogue is capable of individualization when the interface software can be modified to suit the task needs, individual preferences, and skills of the user.
- Suitability for learning: the dialogue is suitable for learning when it supports and guides the user in learning to use the system.
The concept of usability is defined of the ISO 9241 standard by effectiveness, efficiency, and satisfaction of the user. Part 11 gives the following definition of usability:
- Usability is measured by the extent to which the intended goals of use of the overall system are achieved (effectiveness).
- The resources that have to be expended to achieve the intended goals (efficiency).
- The extent to which the user finds the overall system acceptable (satisfaction).
Effectiveness, efficiency, and satisfaction can be seen as quality factors of usability. To evaluate these factors, they need to be decomposed into sub-factors, and finally, into usability measures.
The information presentation is described in Part 12 of the ISO 9241 standard for the organization of information (arrangement, alignment, grouping, labels, location), for the display of graphical objects, and for the coding of information (abbreviation, color, size, shape, visual cues) by seven attributes. The "attributes of presented information" represent the static aspects of the interface and can be generally regarded as the "look" of the interface. The attributes are detailed in the recommendations given in the standard. Each of the recommendations supports one or more of the seven attributes. The seven presentation attributes are:
- Clarity: the information content is conveyed quickly and accurately.
- Discriminability: the displayed information can be distinguished accurately.
- Conciseness: users are not overloaded with extraneous information.
- Consistency: a unique design, conformity with user's expectation.
- Detectability: the user's attention is directed towards information required.
- Legibility: information is easy to read.
- Comprehensibility: the meaning is clearly understandable, unambiguous, interpretable, and recognizable.
The user guidance in Part 13 of the ISO 9241 standard describes that the user guidance information should be readily distinguishable from other displayed information and should be specific for the current context of use. User guidance can be given by the following five means:
- Prompts indicating explicitly (specific prompts) or implicitly (generic prompts) that the system is available for input.
- Feedback informing about the user's input timely, perceptible, and non-intrusive.
- Status information indicating the continuing state of the application, the system's hardware and software components, and the user's activities.
- Error management including error prevention, error correction, user support for error management, and error messages.
- On-line help for system-initiated and user initiated requests with specific information for the current context of use.
Research
User interface design has been a topic of considerable research, including on its aesthetics.[7] Standards have been developed as far back as the 1980s for defining the usability of software products. One of the structural bases has become the IFIP user interface reference model. The model proposes four dimensions to structure the user interface:
- The input/output dimension (the look)
- The dialogue dimension (the feel)
- The technical or functional dimension (the access to tools and services)
- The organizational dimension (the communication and co-operation support)
This model has greatly influenced the development of the international standard ISO 9241 describing the interface design requirements for usability. The desire to understand application-specific UI issues early in software development, even as an application was being developed, led to research on GUI rapid prototyping tools that might offer convincing simulations of how an actual application might behave in production use.[8] Some of this research has shown that a wide variety of programming tasks for GUI-based software can, in fact, be specified through means other than writing program code.[9]
Research in recent years is strongly motivated by the increasing variety of devices that can, by virtue of Moore's law, host very complex interfaces.[10]
Research has also been conducted on generating user interfaces automatically, to match a user's level of ability for different levels of interaction.[11]
At the moment, in addition to traditional prototypes, the literature proposes new solutions, such as an experimental mixed prototype based on a configurable physical prototype that allow to achieve a complete sense of touch, thanks to the physical mock-up, and a realistic visual experience, thanks to the superimposition of the virtual interface on the physical prototype with Augmented Reality techniques.
SERVICE AND DESIGNING FOR USABILITY
Service design is the activity of planning and organizing people, infrastructure, communication and material components of a service in order to improve its quality and the interaction between the service provider and its customers. Service design may function as a way to inform changes to an existing service or create a new service entirely.
The purpose of service design methodologies is to establish best practices for designing services according to both the needs of customers and the competencies and capabilities of service providers. If a successful method of service design is employed, the service will be user-friendly and relevant to the customers, while being sustainable and competitive for the service provider. For this purpose, service design uses methods and tools derived from different disciplines, ranging from ethnography to information and management science to interaction design. Service design concepts and ideas are typically portrayed visually, using different representation techniques according to the culture, skill and level of understanding of the stakeholders involved in the service processes
Designing for usability
Any system or device designed for use by people should be easy to use, easy to learn, easy to remember (the instructions), and helpful to users. John Gould and Clayton Lewis recommend that designers striving for usability follow these three design principles
- Early focus on end users and the tasks they need the system/device to do
- Empirical measurement using quantitative or qualitative measures
- Iterative design, in which the designers work in a series of stages, improving the design each time
Early focus on users and tasks
The design team should be user-driven and it should be in direct contact with potential users. Several evaluation methods, including personas, cognitive modeling, inspection, inquiry, prototyping, and testing methods may contribute to understanding potential users and their perceptions of how well the product or process works. Usability considerations, such as who the users are and their experience with similar systems must be examined. As part of understanding users, this knowledge must "...be played against the tasks that the users will be expected to perform."[13] This includes the analysis of what tasks the users will perform, which are most important, and what decisions the users will make while using your system. Designers must understand how cognitive and emotional characteristics of users will relate to a proposed system. One way to stress the importance of these issues in the designers' minds is to use personas, which are made-up representative users. See below for further discussion of personas. Another more expensive but more insightful method is to have a panel of potential users work closely with the design team from the early stages.[14]
Empirical measurement[
Test the system early on, and test the system on real users using behavioral measurements. This includes testing the system for both learnability and usability. (See Evaluation Methods). It is important in this stage to use quantitative usability specifications such as time and errors to complete tasks and number of users to test, as well as examine performance and attitudes of the users testing the system.[14] Finally, "reviewing or demonstrating" a system before the user tests it can result in misleading results. The emphasis of empirical measurement is on measurement, both informal and formal, which can be carried out through a variety of evaluation methods.
Iterative design
Iterative design is a design methodology based on a cyclic process of prototyping, testing, analyzing, and refining a product or process. Based on the results of testing the most recent iteration of a design, changes and refinements are made. This process is intended to ultimately improve the quality and functionality of a design. In iterative design, interaction with the designed system is used as a form of research for informing and evolving a project, as successive versions, or iterations of a design are implemented. The key requirements for Iterative Design are: identification of required changes, an ability to make changes, and a willingness to make changes. When a problem is encountered, there is no set method to determine the correct solution. Rather, there are empirical methods that can be used during system development or after the system is delivered, usually a more inopportune time. Ultimately, iterative design works towards meeting goals such as making the system user friendly, easy to use, easy to operate, simple, etc.
Evaluation methods
There are a variety of usability evaluation methods. Certain methods use data from users, while others rely on usability experts. There are usability evaluation methods for all stages of design and development, from product definition to final design modifications. When choosing a method, consider cost, time constraints, and appropriateness. For a brief overview of methods, see Comparison of usability evaluation methods or continue reading below. Usability methods can be further classified into the subcategories below.
Cognitive modeling methods
Cognitive modeling involves creating a computational model to estimate how long it takes people to perform a given task. Models are based on psychological principles and experimental studies to determine times for cognitive processing and motor movements. Cognitive models can be used to improve user interfaces or predict problem errors and pitfalls during the design process. A few examples of cognitive models include:
- Parallel design
With parallel design, several people create an initial design from the same set of requirements. Each person works independently, and when finished, shares concepts with the group. The design team considers each solution, and each designer uses the best ideas to further improve their own solution. This process helps generate many different, diverse ideas, and ensures that the best ideas from each design are integrated into the final concept. This process can be repeated several times until the team is satisfied with the final concept.
- GOMS
GOMS stands for goals, operator, methods, and selection rules. It is a family of techniques that analyzes the user complexity of interactive systems. Goals are what the user must accomplish. An operator is an action performed in pursuit of a goal. A method is a sequence of operators that accomplish a goal. Selection rules specify which method satisfies a given goal, based on context.
- Human processor model
Sometimes it is useful to break a task down and analyze each individual aspect separately. This helps the tester locate specific areas for improvement. To do this, it is necessary to understand how the human brain processes information. A model of the human processor is shown below.

Many studies have been done to estimate the cycle times, decay times, and capacities of each of these processors. Variables that affect these can include subject age, aptitudes, ability, and the surrounding environment. For a younger adult, reasonable estimates are:
| Parameter | Mean | Range |
|---|---|---|
| Eye movement time | 230 ms | 70–700 ms |
| Decay half-life of visual image storage | 200 ms | 90–1000 ms |
| Perceptual processor cycle time | 100 ms | 50–200 ms |
| Cognitive processor cycle time | 70 ms | 25–170 ms |
| Motor processor cycle time | 70 ms | 30–100 ms |
| Effective working memory capacity | 2 items | 2–3 items |
Long-term memory is believed to have an infinite capacity and decay time.[15]
- Keystroke level modeling
Keystroke level modeling is essentially a less comprehensive version of GOMS that makes simplifying assumptions in order to reduce calculation time and complexity.
Inspection methods
These usability evaluation methods involve observation of users by an experimenter, or the testing and evaluation of a program by an expert reviewer. They provide more quantitative data as tasks can be timed and recorded.
- Card sorts
Card sorting is a way to involve users in grouping information for a website's usability review. Participants in a card sorting session are asked to organize the content from a Web site in a way that makes sense to them. Participants review items from a Web site and then group these items into categories. Card sorting helps to learn how users think about the content and how they would organize the information on the Web site. Card sorting helps to build the structure for a Web site, decide what to put on the home page, and label the home page categories. It also helps to ensure that information is organized on the site in a way that is logical to users.
- Tree tests
Tree testing is a way to evaluate the effectiveness of a website's top-down organization. Participants are given "find it" tasks, then asked to drill down through successive text lists of topics and subtopics to find a suitable answer. Tree testing evaluates the findability and labeling of topics in a site, separate from its navigation controls or visual design.
- Ethnography
Ethnographic analysis is derived from anthropology. Field observations are taken at a site of a possible user, which track the artifacts of work such as Post-It notes, items on desktop, shortcuts, and items in trash bins. These observations also gather the sequence of work and interruptions that determine the user's typical day.
- Heuristic evaluation
Heuristic evaluation is a usability engineering method for finding and assessing usability problems in a user interface design as part of an iterative design process. It involves having a small set of evaluators examining the interface and using recognized usability principles (the "heuristics"). It is the most popular of the usability inspection methods, as it is quick, cheap, and easy. Heuristic evaluation was developed to aid in the design of computer user-interface design. It relies on expert reviewers to discover usability problems and then categorize and rate them by a set of principles (heuristics.) It is widely used based on its speed and cost-effectiveness. Jakob Nielsen's list of ten heuristics is the most commonly used in industry. These are ten general principles for user interface design. They are called "heuristics" because they are more in the nature of rules of thumb than specific usability guidelines.
- Visibility of system status: The system should always keep users informed about what is going on, through appropriate feedback within reasonable time.
- Match between system and the real world: The system should speak the users' language, with words, phrases and concepts familiar to the user, rather than system-oriented terms. Follow real-world conventions, making information appear in a natural and logical order.
- User control and freedom: Users often choose system functions by mistake and will need a clearly marked "emergency exit" to leave the unwanted state without having to go through an extended dialogue. Support undo and redo.
- Consistency and standards: Users should not have to wonder whether different words, situations, or actions mean the same thing. Follow platform conventions.
- Error prevention: Even better than good error messages is a careful design that prevents a problem from occurring in the first place. Either eliminate error-prone conditions or check for them and present users with a confirmation option before they commit to the action.
- Recognition rather than recall:[16] Minimize the user's memory load by making objects, actions, and options visible. The user should not have to remember information from one part of the dialogue to another. Instructions for use of the system should be visible or easily retrievable whenever appropriate.
- Flexibility and efficiency of use: Accelerators—unseen by the novice user—may often speed up the interaction for the expert user such that the system can cater to both inexperienced and experienced users. Allow users to tailor frequent actions.
- Aesthetic and minimalist design: Dialogues should not contain information that is irrelevant or rarely needed. Every extra unit of information in a dialogue competes with the relevant units of information and diminishes their relative visibility.
- Help users recognize, diagnose, and recover from errors: Error messages should be expressed in plain language (no codes), precisely indicate the problem, and constructively suggest a solution.
- Help and documentation: Even though it is better if the system can be used without documentation, it may be necessary to provide help and documentation. Any such information should be easy to search, focused on the user's task, list concrete steps to be carried out, and not be too large.
Thus, by determining which guidelines are violated, the usability of a device can be determined.
- Usability inspection
Usability inspection is a review of a system based on a set of guidelines. The review is conducted by a group of experts who are deeply familiar with the concepts of usability in design. The experts focus on a list of areas in design that have been shown to be troublesome for users.
- Pluralistic inspection
Pluralistic Inspections are meetings where users, developers, and human factors people meet together to discuss and evaluate step by step of a task scenario. As more people inspect the scenario for problems, the higher the probability to find problems. In addition, the more interaction in the team, the faster the usability issues are resolved.
- Consistency inspection
In consistency inspection, expert designers review products or projects to ensure consistency across multiple products to look if it does things in the same way as their own designs.
- Activity Analysis
Activity analysis is a usability method used in preliminary stages of development to get a sense of situation. It involves an investigator observing users as they work in the field. Also referred to as user observation, it is useful for specifying user requirements and studying currently used tasks and subtasks. The data collected are qualitative and useful for defining the problem. It should be used when you wish to frame what is needed, or "What do we want to know?"
Inquiry methods
The following usability evaluation methods involve collecting qualitative data from users. Although the data collected is subjective, it provides valuable information on what the user wants.
- Task analysis
Task analysis means learning about users' goals and users' ways of working. Task analysis can also mean figuring out what more specific tasks users must do to meet those goals and what steps they must take to accomplish those tasks. Along with user and task analysis, a third analysis is often used: understanding users' environments (physical, social, cultural, and technological environments).
- Focus groups
A focus group is a focused discussion where a moderator leads a group of participants through a set of questions on a particular topic. Although typically used as a marketing tool, Focus Groups are sometimes used to evaluate usability. Used in the product definition stage, a group of 6 to 10 users are gathered to discuss what they desire in a product. An experienced focus group facilitator is hired to guide the discussion to areas of interest for the developers. Focus groups are typically videotaped to help get verbatim quotes, and clips are often used to summarize opinions. The data gathered is not usually quantitative, but can help get an idea of a target group's opinion.
- Questionnaires/surveys
Surveys have the advantages of being inexpensive, require no testing equipment, and results reflect the users' opinions. When written carefully and given to actual users who have experience with the product and knowledge of design, surveys provide useful feedback on the strong and weak areas of the usability of a design. This is a very common method and often does not appear to be a survey, but just a warranty card.
Prototyping methods
It is often very difficult for designers to conduct usability tests with the exact system being designed. Cost constraints, size, and design constraints usually lead the designer to creating a prototype of the system. Instead of creating the complete final system, the designer may test different sections of the system, thus making several small models of each component of the system. The types of usability prototypes may vary from using paper models, index cards, hand drawn models, or storyboards.[17] Prototypes are able to be modified quickly, often are faster and easier to create with less time invested by designers and are more apt to change design; although sometimes are not an adequate representation of the whole system, are often not durable and testing results may not be parallel to those of the actual system.
- Rapid prototyping
Rapid prototyping is a method used in early stages of development to validate and refine the usability of a system. It can be used to quickly and cheaply evaluate user-interface designs without the need for an expensive working model. This can help remove hesitation to change the design, since it is implemented before any real programming begins. One such method of rapid prototyping is paper prototyping.
Testing methods
These usability evaluation methods involve testing of subjects for the most quantitative data. Usually recorded on video, they provide task completion time and allow for observation of attitude. Regardless to how carefully a system is designed, all theories must be tested using usability tests. Usability tests involve typical users using the system (or product) in a realistic environment [see simulation]. Observation of the user's behavior, emotions, and difficulties while performing different tasks, often identify areas of improvement for the system.
Metrics
While conducting usability tests, designers must use usability metrics to identify what it is they are going to measure, or the usability metrics. These metrics are often variable, and change in conjunction with the scope and goals of the project. The number of subjects being tested can also affect usability metrics, as it is often easier to focus on specific demographics. Qualitative design phases, such as general usability (can the task be accomplished?), and user satisfaction are also typically done with smaller groups of subjects.[18]Using inexpensive prototypes on small user groups provides more detailed information, because of the more interactive atmosphere, and the designer's ability to focus more on the individual user.
As the designs become more complex, the testing must become more formalized. Testing equipment will become more sophisticated and testing metrics become more quantitative. With a more refined prototype, designers often test effectiveness, efficiency, and subjective satisfaction, by asking the user to complete various tasks. These categories are measured by the percent that complete the task, how long it takes to complete the tasks, ratios of success to failure to complete the task, time spent on errors, the number of errors, rating scale of satisfactions, number of times user seems frustrated, etc.[19] Additional observations of the users give designers insight on navigation difficulties, controls, conceptual models, etc. The ultimate goal of analyzing these metrics is to find/create a prototype design that users like and use to successfully perform given tasks.[17] After conducting usability tests, it is important for a designer to record what was observed, in addition to why such behavior occurred and modify the model according to the results. Often it is quite difficult to distinguish the source of the design errors, and what the user did wrong. However, effective usability tests will not generate a solution to the problems, but provide modified design guidelines for continued testing.
- Remote usability testing
Remote usability testing (also known as unmoderated or asynchronous usability testing) involves the use of a specially modified online survey, allowing the quantification of user testing studies by providing the ability to generate large sample sizes, or a deep qualitative analysis without the need for dedicated facilities. Additionally, this style of user testing also provides an opportunity to segment feedback by demographic, attitudinal and behavioral type. The tests are carried out in the user's own environment (rather than labs) helping further simulate real-life scenario testing. This approach also provides a vehicle to easily solicit feedback from users in remote areas. There are two types, quantitative or qualitative. Quantitative use large sample sized and task based surveys. These types of studies are useful for validating suspected usability issues. Qualitative studies are best used as exploratory research, in small sample sizes but frequent, even daily iterations. Qualitative usually allows for observing respondent's screens and verbal think aloud commentary (Screen Recording Video, SRV), and for a richer level of insight also include the webcam view of the respondent (Video-in-Video, ViV, sometimes referred to as Picture-in-Picture, PiP)
- Remote usability testing for mobile devices
The growth in mobile and associated platforms and services (e.g.: Mobile gaming has experienced 20x growth in 2010-2012) has generated a need for unmoderated remote usability testing on mobile devices, both for websites but especially for app interactions. One methodology consists of shipping cameras and special camera holding fixtures to dedicated testers, and having them record the screens of the mobile smart-phone or tablet device, usually using an HD camera. A drawback of this approach is that the finger movements of the respondent can obscure the view of the screen, in addition to the bias and logistical issues inherent in shipping special hardware to selected respondents. A newer approach uses a wireless projection of the mobile device screen onto the computer desktop screen of the respondent, who can then be recorded through their webcam, and thus a combined Video-in-Video view of the participant and the screen interactions viewed simultaneously while incorporating the verbal think aloud commentary of the respondents.
- Thinking aloud
The Think aloud protocol is a method of gathering data that is used in both usability and psychology studies. It involves getting a user to verbalize their thought processes as they perform a task or set of tasks. Often an instructor is present to prompt the user into being more vocal as they work. Similar to the Subjects-in-Tandem method, it is useful in pinpointing problems and is relatively simple to set up. Additionally, it can provide insight into the user's attitude, which can not usually be discerned from a survey or questionnaire.
Rapid Iterative Testing and Evaluation (RITE) is an iterative usability method similar to traditional "discount" usability testing. The tester and team must define a target population for testing, schedule participants to come into the lab, decide on how the users behaviors will be measured, construct a test script and have participants engage in a verbal protocol (e.g., think aloud). However it differs from these methods in that it advocates that changes to the user interface are made as soon as a problem is identified and a solution is clear. Sometimes this can occur after observing as few as 1 participant. Once the data for a participant has been collected the usability engineer and team decide if they will be making any changes to the prototype prior to the next participant. The changed interface is then tested with the remaining users.
- Subjects-in-tandem or co-discovery
Subjects-in-tandem (also called co-discovery) is the pairing of subjects in a usability test to gather important information on the ease of use of a product. Subjects tend to discuss the tasks they have to accomplish out loud and through these discussions observers learn where the problem areas of a design are. To encourage co-operative problem-solving between the two subjects, and the attendant discussions leading to it, the tests can be designed to make the subjects dependent on each other by assigning them complementary areas of responsibility (e.g. for testing of software, one subject may be put in charge of the mouse and the other of the keyboard.)
- Component-based usability testing
Component-based usability testing is an approach which aims to test the usability of elementary units of an interaction system, referred to as interaction components. The approach includes component-specific quantitative measures based on user interaction recorded in log files, and component-based usability questionnaires.
Other methods
- Cognitive walk through
Cognitive walkthrough is a method of evaluating the user interaction of a working prototype or final product. It is used to evaluate the system's ease of learning. Cognitive walk through is useful to understand the user's thought processes and decision making when interacting with a system, specially for first-time or infrequent users.
- Benchmarking
Benchmarking creates standardized test materials for a specific type of design. Four key characteristics are considered when establishing a benchmark: time to do the core task, time to fix errors, time to learn applications, and the functionality of the system. Once there is a benchmark, other designs can be compared to it to determine the usability of the system. Many of the common objectives of usability studies, such as trying to understand user behavior or exploring alternative designs, must be put aside. Unlike many other usability methods or types of labs studies, benchmark studies more closely resemble true experimental psychology lab studies, with greater attention to detail on methodology, study protocol and data analysis.
- Meta-analysis
Meta-analysis is a statistical procedure to combine results across studies to integrate the findings. This phrase was coined in 1976 as a quantitative literature review. This type of evaluation is very powerful for determining the usability of a device because it combines multiple studies to provide very accurate quantitative support.
- Persona
Personas are fictitious characters created to represent a site or product's different user types and their associated demographics and technographics. Alan Cooper introduced the concept of using personas as a part of interactive design in 1998 in his book The Inmates Are Running the Asylum, but had used this concept since as early as 1975. Personas are a usability evaluation method that can be used at various design stages. The most typical time to create personas is at the beginning of designing so that designers have a tangible idea of who the users of their product will be. Personas are the archetypes that represent actual groups of users and their needs, which can be a general description of person, context, or usage scenario. This technique turns marketing data on target user population into a few physical concepts of users to create empathy among the design team, with the final aim of tailoring a product more closely to how the personas will use it. To gather the marketing data that personas require, several tools can be used, including online surveys, web analytics, customer feedback forms, and usability tests, and interviews with customer-service representatives.
Benefits
The key benefits of usability are:
- Higher revenues through increased sales
- Increased user efficiency and user satisfaction
- Reduced development costs
- Reduced support costs
Corporate integration
An increase in usability generally positively affects several facets of a company's output quality. In particular, the benefits fall into several common areas:
- Increased productivity
- Decreased training and support costs
- Increased sales and revenues
- Reduced development time and costs
- Reduced maintenance costs
- Increased customer satisfaction
Increased usability in the workplace fosters several responses from employees: "Workers who enjoy their work do it better, stay longer in the face of temptation, and contribute ideas and enthusiasm to the evolution of enhanced productivity." To create standards, companies often implement experimental design techniques that create baseline levels. Areas of concern in an office environment include (though are not necessarily limited to):
- Working posture
- Design of workstation furniture
- Screen displays
- Input devices
- Organization issues
- Office environment
- Software interface
By working to improve said factors, corporations can achieve their goals of increased output at lower costs, while potentially creating optimal levels of customer satisfaction. There are numerous reasons why each of these factors correlates to overall improvement. For example, making software user interfaces easier to understand reduces the need for extensive training. The improved interface tends to lower the time needed to perform tasks, and so would both raise the productivity levels for employees and reduce development time (and thus costs). Each of the aforementioned factors are not mutually exclusive; rather they should be understood to work in conjunction to form the overall workplace environment. In the 2010s, usability is recognized as an important software quality attribute, earning its place among more traditional attributes such as performance, robustness and aesthetic appearance. Various academic programs focus on usability. Several usability consultancy companies have emerged, and traditional consultancy and design firms offer similar services.
There is some resistance to integrating usability work in organisations. Usability is seen as a vague concept, it is difficult to measure and other areas are prioritised when IT projects run out of time or money.
Professional development
Usability practitioners are sometimes trained as industrial engineers, psychologists, kinesiologists, systems design engineers, or with a degree in information architecture, information or library science, or Human-Computer Interaction (HCI). More often though they are people who are trained in specific applied fields who have taken on a usability focus within their organization. Anyone who aims to make tools easier to use and more effective for their desired function within the context of work or everyday living can benefit from studying usability principles and guidelines. For those seeking to extend their training, the Usability Professionals' Association offers online resources, reference lists, courses, conferences, and local chapter meetings. The UPA also sponsors World Usability Day each November. Related professional organizations include the Human Factors and Ergonomics Society (HFES) and the Association for Computing Machinery's special interest groups in Computer Human Interaction (SIGCHI), Design of Communication (SIGDOC) and Computer Graphics and Interactive Techniques (SIGGRAPH). The Society for Technical Communication also has a special interest group on Usability and User Experience (UUX). They publish a quarterly newsletter called Usability Interface
Web usability is the ease of use of a website. Some broad goals of usability are the presentation of information and choices in a clear and concise way, a lack of ambiguity and the placement of important items in appropriate areas. Another important element of web usability is ensuring that the content works on various devices and browsers .
Web Usability definition and components
Web Usability includes small learning curve, easy content exploration and findability, task efficiency, satisfaction, automation. These new components of usability are due to the evolution of the web and the devices. Example: automation: autofill, databases, personal account; efficiency: voice command (siri, alexa,...etc); findabiltiy: the number of websites has reached 4 billions, with good usability, users have more success to find what they are looking for in a timely manner. With the wide spread of mobile devices and wireless internet access, companies are now able to reach a global market with users of all nationalities. It is important for websites to be usable regardless of users languages and culture. Most users conduct their personal business online: banking, studying, errands,..etc which opened represent a tremendous opportunity to people with disability to be independent. Therefore, websites needs to be accessible for those users.
The goal of web usability is to provide user experience satisfaction by minimizing the time it takes to the user to learn new functionality and page navigation system, allowing the user to accomplish a task efficiently without major roadblocks, providing the user easy ways to overcome roadblocks and fixing errors and re-adapting to the website or application system and functionality with minimum learnability.
Usability Testing
Usability testing is evaluating the different components of web usability (learnability, efficiency, memorability, errors and satisfaction) by watching the users accomplishing their task. Usability testing allows to uncover the roadblocks and errors users encounter while accomplishing a task .
Future Trends (Data Communications and Networking)
By the year 2010, data communications will have grown faster and become more important than computer processing itself. Both go hand in hand, but we have moved from the computer era to the communication era. There are three major trends driving the future of communications and networking. All are interrelated, so it is difficult to consider one without the others.
Pervasive Networking
Pervasive networking means that communication networks will one day be everywhere; virtually any device will be able to communicate with any other device in the world. This is true in many ways today, but what is important is the staggering rate at which we will eventually be able to transmit data. Figure 1.6 illustrates the dramatic changes over the years in the amount of data we can transfer. For example, in 1980, the capacity of a traditional telephone-based network (i.e., one that would allow you to dial up another computer from your home) was about 300 bits per second (bps). In relative terms, you could picture this as a pipe that would enable you to transfer one speck of dust every second. By the 1990s, we were routinely transmitting data at 9,600 bps, or about a grain of sand every second. By 2000, we were able to transmit either a pea (modem at 56 Kbps) or a ping-pong ball (DSL [digital subscriber line] at 1.5 Mbps) every second over that same telephone line. In the very near future, we will have the ability to transmit 40 Mbps using fixed point-to-point radio technologies—or in relative terms, about one basketball per second.
Between 1980 and 2005, LAN and backbone technologies increased capacity from about 128Kbps (a sugar cube per second) to 100Mbps (a beach ball; see Figure 1.6). Today, backbones can provide 10 Gbps, or the relative equivalent of a one-car garage per second.
The changes in WAN and Internet circuits has been even more dramatic (see Figure 1.6). From a typical size of 56 Kbps in 1980 to the 622Mbps of a high-speed circuit in 2000, most experts now predict a high-speed WAN or Internet circuit will be able to carry 25 Tbps (25 terabits, or 25 trillion bits per second) in a few years—the relative equivalent of a skyscraper 50 stories tall and 50 stories wide. Our sources at IBM Research suggest that this may be conservative; they predict a capacity of 1 Pbps (1 petabit, or 1 quadrillion bits per second [1 million billion]), which is the equivalent of a skyscraper 300 stories tall and 300 stories wide in Figure 1.6. To put this in perspective in a different way, in 2006, the total size of the Internet was estimated to be 2000 petabits (i.e., adding together every file on every computer in the world that was connected to the Internet).
, backbone network (BN), wide area network (WAN), and Internet circuits. DSL = Digital Subscriber Line")
Figure 1.6 Relative capacities of telephone, local area network (LAN), backbone network (BN), wide area network (WAN), and Internet circuits. DSL = Digital Subscriber Line
In other words, just one 1-Pbps circuit could download the entire contents of today’s Internet in about 30 minutes. Of course, no computer in the world today could store that much information—or even just 1 minute’s worth of the data transfer.
The term broadband communication has often been used to refer to these new highspeed communication circuits. Broadband is a technical term that refers to a specific type of data transmission that is used by one of these circuits (e.g., DSL). However, its true technical meaning has become overwhelmed by its use in the popular press to refer to high-speed circuits in general. Therefore, we too will use it to refer to circuits with data speeds of 1 Mbps or higher.
The initial costs of the technologies used for these very high speed circuits will be high, but competition will gradually drive down the cost. The challenge for businesses will be how to use them. When we have the capacity to transmit virtually all the data anywhere we want over a high-speed, low-cost circuit, how will we change the way businesses operate? Economists have long talked about the globalization of world economies. Data communications has made it a reality.
The Integration of Voice, Video, and Data
A second key trend is the integration of voice, video, and data communication, sometimes called convergence. In the past, the telecommunications systems used to transmit video signals (e.g., cable TV), voice signals (e.g., telephone calls), and data (e.g., computer data, e-mail) were completely separate. One network was used for data, one for voice, and one for cable TV.
This is rapidly changing. The integration of voice and data is largely complete in WANs. The IXCs, such as AT&T, provide telecommunication services that support data and voice transmission over the same circuits, even intermixing voice and data on the same physical cable. Vonage (www.vonage.com) and Skype (www.skype.com), for example, permit you to use your network connection to make and receive telephone calls using Voice Over Internet Protocol (VOIP).
The integration of voice and data has been much slower in LANs and local telephone services. Some companies have successfully integrated both on the same network, but some still lay two separate cable networks into offices, one for voice and one for computer access.
The integration of video into computer networks has been much slower, partly because of past legal restrictions and partly because of the immense communications needs of video. However, this integration is now moving quickly, owing to inexpensive video technologies. Many IXCs are now offering a "triple play" of phone, Internet, and TV video bundled together as one service.
Convergence in Maryland
MANAGEMENT FOCUS
The Columbia Association employs 450 full-time and 1,500 part-time employees to operate the recreational facilities for the city of Columbia, Maryland. When Nagaraj Reddi took over as IT director, the Association had a 20-year-old central mainframe, no data networks connecting its facilities, and an outdated legacy telephone network. There was no data sharing; city residents had to call each facility separately to register for activities and provide their full contact information each time. There were long wait times and frequent busy signals.
Reddi wanted a converged network that would combine voice and data to minimize operating costs and improve service to his customers. The Association installed a converged network switch at each facility, which supports computer networks and new digital IP-based phones. The switch also can use traditional analog phones, whose signals it converts into the digital IP-based protocols needed for computer networks. A single digital IP network connects each facility into the Association’s WAN, so that voice and data traffic can easy move among the facilities or to and from the Internet.
By using converged services, the Association has improved customer service and also has reduced the cost to install and operate separate voice and data networks.
New Information Services
A third key trend is the provision of new information services on these rapidly expanding networks. In the same way that the construction of the American interstate highway system spawned new businesses, so will the construction of worldwide integrated communications networks.You can find information on virtually anything on the Web. The problem becomes one of assessing the accuracy and value of information. In the future, we can expect information services to appear that help ensure the quality of the information they contain. Never before in the history of the human race has so much knowledge and information been available to ordinary citizens. The challenge we face as individuals and organizations is assimilating this information and using it effectively.
Today, many companies are beginning to use application service providers (ASPs) rather than developing their own computer systems. An ASP develops a specific system (e.g., an airline reservation system, a payroll system), and companies purchase the service, without ever installing the system on their own computers. They simply use the service, the same way you might use a Web hosting service to publish your own Web pages rather than attempting to purchase and operate your own Web server. Some experts are predicting that by 2010, ASPs will have evolved into information utilities. An
Internet Video at Reuters
MANAGEMENT FOCUS
For more than 150 years, London-based Reuters has been providing news and financial information to businesses, financial institutions, and the public. As Reuters was preparing for major organizational changes, including the arrival of a new CEO, Tom Glocer, Reuters decided the company needed to communicate directly to employees in a manner that would be timely, consistent, and direct. And they wanted to foster a sense of community within the organization.
Reuters selected a video solution that would reach all 19,000 employees around the world simultaneously, and have the flexibility to add and disseminate content quickly. The heart of the system is housed in London, where video clips are compiled, encoded, and distributed. Employees have a Daily Briefing home page, which presents the day’s crucial world news, and a regularly changing 5- to 7-minute high-quality video briefing. Most videos convey essential management information and present engaging and straightforward question-and-answer sessions between Steve Clarke and various executives.
”On the first day, a large number of employees could see Tom Glocer and hear about where he sees the company going and what he wants to do,” says Duncan Miller, head of global planning and technology. ”Since then, it’s provided Glocer and other executives with an effective tool that allows them to communicate to every person in the company in a succinct and controlled manner.”
Reuters expected system payback within a year, primarily in the form of savings from reduced management travel and reduced VHS video production, which had previously cost Reuters $215,000 per production. Management also appreciates the personalized nature of the communication, and the ability to get information out within 12 hours to all areas, which makes a huge difference in creating a consistent corporate message.
Information utility is a company that provides a wide range of standardized information services, the same way that electric utilities today provide electricity or telephone utilities provide telephone service. Companies would simply purchase most of their information services (e.g., e-mail, Web, accounting, payroll, logistics) from these information utilities rather than attempting to develop their systems and operate their own servers.
Network Models (Data Communications and Networking)
There are many ways to describe and analyze data communications networks. All networks provide the same basic functions to transfer a message from sender to receiver, but each network can use different network hardware and software to provide these functions. All of these hardware and software products have to work together to successfully transfer a message.
One way to accomplish this is to break the entire set of communications functions into a series of layers, each of which can be defined separately. In this way, vendors can develop software and hardware to provide the functions of each layer separately. The software or hardware can work in any manner and can be easily updated and improved, as long as the interface between that layer and the ones around it remain unchanged. Each piece of hardware and software can then work together in the overall network.
There are many different ways in which the network layers can be designed. The two most important network models are the Open Systems Interconnection Reference (OSI) model and the Internet model.
Open Systems Interconnection Reference Model
The Open Systems Interconnection Reference model (usually called the OSI model for short) helped change the face of network computing. Before the OSI model, most commercial networks used by businesses were built using nonstandardized technologies developed by one vendor (remember that the Internet was in use at the time but was not widespread and certainly was not commercial). During the late 1970s, the International Organization for Standardization (ISO) created the Open System Interconnection Subcommittee, whose task was to develop a framework of standards for computer-to-computer communications. In 1984, this effort produced the OSI model.
The OSI model is the most talked about and most referred to network model. If you choose a career in networking, questions about the OSI model will be on the network certification exams offered by Microsoft, Cisco, and other vendors of network hardware and software. However, you will probably never use a network based on the OSI model. Simply put, the OSI model never caught on commercially in North America, although some European networks use it, and some network components developed for use in the United States arguably use parts of it. Most networks today use the Internet model, which is discussed in the next section. However, because there are many similarities between the OSI model and the Internet model, and because most people in networking are expected to know the OSI model, we discuss it here. The OSI model has seven layers (see Figure 1.3).
Layer 1: Physical Layer The physical layer is concerned primarily with transmitting data bits (zeros or ones) over a communication circuit. This layer defines the rules by which ones and zeros are transmitted, such as voltages of electricity, number of bits sent per second, and the physical format of the cables and connectors used.
Layer 2: Data Link Layer The data link layer manages the physical transmission circuit in layer 1 and transforms it into a circuit that is free of transmission errors as far as layers above are concerned. Because layer 1 accepts and transmits only a raw stream of bits without understanding their meaning or structure, the data link layer must create and recognize message boundaries; that is, it must mark where a message starts and where it ends. Another major task of layer 2 is to solve the problems caused by damaged, lost, or duplicate messages so the succeeding layers are shielded from transmission errors. Thus, layer 2 performs error detection and correction. It also decides when a device can transmit so that two computers do not try to transmit at the same time.
OSI Model
|
Internet Model
|
Groups of Layers
|
Examples
|
7. Application Layer
|
5. Application Layer
|
Application Layer
|
Internet Explorer and Web pages
|
6. Presentation Layer
| |||
5. Session Layer
| |||
4. Transport Layer
|
4. Transport Layer
|
Internetwork Layer
|
TCP/IP Software
|
3. Network Layer
|
3. Network Layer
| ||
2. Data Link Layer
|
2. Data Link Layer
|
Hardware Layer
|
Ethernet port, Ethernet cables,
and Ethernet software drivers
|
1. Physical Layer
|
1. Physical Layer
|
Figure 1.3 Network models. OSI = Open Systems Interconnection Reference
Layer 3: Network Layer The network layer performs routing. It determines the next computer the message should be sent to so it can follow the best route through the network and finds the full address for that computer if needed.
Layer 4: Transport Layer The transport layer deals with end-to-end issues, such as procedures for entering and departing from the network. It establishes, maintains, and terminates logical connections for the transfer of data between the original sender and the final destination of the message. It is responsible for breaking a large data transmission into smaller packets (if needed), ensuring that all the packets have been received, eliminating duplicate packets, and performing flow control to ensure that no computer is overwhelmed by the number of messages it receives. Although error control is performed by the data link layer, the transport layer can also perform error checking.
Layer 5: Session Layer The session layer is responsible for managing and structuring all sessions. Session initiation must arrange for all the desired and required services between session participants, such as logging onto circuit equipment, transferring files, using various terminal types, and performing security checks. Session termination provides an orderly way to end the session, as well as a means to abort a session prematurely. It may have some redundancy built in to recover from a broken transport (layer 4) connection in case of failure. The session layer also handles session accounting so the correct party receives the bill.
Layer 6: Presentation Layer The presentation layer formats the data for presentation to the user. Its job is to accommodate different interfaces on different terminals or computers so the application program need not worry about them. It is concerned with displaying, formatting, and editing user inputs and outputs. For example, layer 6 might perform data compression, translation between different data formats, and screen formatting. Any function (except those in layers 1 through 5) that is requested sufficiently often to warrant finding a general solution is placed in the presentation layer, although some of these functions can be performed by separate hardware and software (e.g., encryption).
Layer 7: Application Layer The application layer is the end user’s access to the network. The primary purpose is to provide a set of utilities for application programs. Each user program determines the set of messages and any action it might take on receipt of a message. Other network-specific applications at this layer include network monitoring and network management.
Internet Model
Although the OSI model is the most talked about network model, the one that dominates current hardware and software is a more simple five-layer Internet model. Unlike the OSI model that was developed by formal committees, the Internet model evolved from the work of thousands of people who developed pieces of the Internet. The OSI model is a formal standard that is documented in one standard, but the Internet model has never been formally defined; it has to be interpreted from a number of standards.1 The two models have very much in common (see Figure 1.3); simply put, the Internet model collapses the top three OSI layers into one layer. Because it is clear that the Internet has won the "war," we use the five-layer Internet model for the rest of this topic.
Layer 1: The Physical Layer The physical layer in the Internet model, as in the OSI model, is the physical connection between the sender and receiver. Its role is to transfer a series of electrical, radio, or light signals through the circuit. The physical layer includes all the hardware devices (e.g., computers, modems, and hubs) and physical media (e.g., cables and satellites). The physical layer specifies the type of connection and the electrical signals, radio waves, or light pulses that pass through it.
Layer 2: The Data Link Layer The data link layer is responsible for moving a message from one computer to the next computer in the network path from the sender to the receiver. The data link layer in the Internet model performs the same three functions as the data link layer in the OSI model. First, it controls the physical layer by deciding when to transmit messages over the media. Second, it formats the messages by indicating where they start and end. Third, it detects and corrects any errors that have occurred during transmission.
Layer 3: The Network Layer The network layer in the Internet model performs the same functions as the network layer in the OSI model. First, it performs routing, in that it selects the next computer to which the message should be sent. Second, it can find the address of that computer if it doesn’t already know it.
Layer 4: The Transport Layer The transport layer in the Internet model is very similar to the transport layer in the OSI model. It performs two functions. First, it is responsible for linking the application layer software to the network and establishing end-to-end connections between the sender and receiver when such connections are needed. Second, it is responsible for breaking long messages into several smaller messages to make them easier to transmit. The transport layer can also detect lost messages and request that they be resent.
Layer 5: Application Layer The application layer is the application software used by the network user and includes much of what the OSI model contains in the application, presentation, and session layers. It is the user’s access to the network. By using the application software, the user defines what messages are sent over the network.It discusses the architecture of network applications and several types of network application software and the types of messages they generate.
Groups of Layers The layers in the Internet are often so closely coupled that decisions in one layer impose certain requirements on other layers. The data link layer and the physical layer are closely tied together because the data link layer controls the physical layer in terms of when the physical layer can transmit. Because these two layers are so closely tied together, decisions about the data link layer often drive the decisions about the physical layer. For this reason, some people group the physical and data link layers together and call them the hardware layers. Likewise, the transport and network layers are so closely coupled that sometimes these layers are called the internetwork layer. See Figure 1.3. When you design a network, you often think about the network design in terms of three groups of layers: the hardware layers (physical and data link), the internetwork layers (network and transport), and the application layer.
Message Transmission Using Layers
Each computer in the network has software that operates at each of the layers and performs the functions required by those layers (the physical layer is hardware not software). Each layer in the network uses a formal language, or protocol, that is simply a set of rules that define what the layer will do and that provides a clearly defined set of messages that software at the layer needs to understand. For example, the protocol used for Web applications is HTTP. In general, all messages sent in a network pass through all layers. All layers except the Physical layer add a Protocol Data Unit (PDU) to the message as it passes through them. The PDU contains information that is needed to transmit the message through the network. Some experts use the word "Packet" to mean a PDU. Figure 1.4 shows how a message requesting a Web page would be sent on the Internet.
Application Layer First, the user creates a message at the application layer using a Web browser by clicking on a link (e.g., get the home page at www.somebody.com). The browser translates the user’s message (the click on the Web link) into HTTP. The rules of HTTP define a specific PDU—called an HTTP packet—that all Web browsers must use when they request a Web page.

Figure 1.4 Message transmission using layers. IP = Internet Protocol; HTTP/Hypertext Transfer Protocol; TCP = Transmission Control Protocol
For now, you can think of the HTTP packet as an envelope into which the user’s message (get the Web page) is placed. In the same way that an envelope placed in the mail needs certain information written in certain places (e.g., return address, destination address), so too does the HTTP packet. The Web browser fills in the necessary information in the HTTP packet, drops the user’s request inside the packet, then passes the HTTP packet (containing the Web page request) to the transport layer.
Transport Layer The transport layer on the Internet uses a protocol called TCP (Transmission Control Protocol), and it, too, has its own rules and its own PDUs. TCP is responsible for breaking large files into smaller packets and for opening a connection to the server for the transfer of a large set of packets. The transport layer places the HTTP packet inside a TCP PDU (which is called a TCP segment), fills in the information needed by the TCP segment, and passes the TCP segment (which contains the HTTP packet, which, in turn, contains the message) to the network layer.
Network Layer The network layer on the Internet uses a protocol called IP (Internet Protocol), which has its rules and PDUs. IP selects the next stop on the message’s route through the network. It places the TCP segment inside an IP PDU which is called an IP packet, and passes the IP packet, which contains the TCP segment, which, in turn, contains the HTTP packet, which, in turn, contains the message, to the data link layer.
Data Link Layer If you are connecting to the Internet using a LAN, your data link layer may use a protocol called Ethernet, which also has its own rules and PDUs. The data link layer formats the message with start and stop markers, adds error checking information, places the IP packet inside an Ethernet PDU, which is called an Ethernet frame, and instructs the physical hardware to transmit the Ethernet frame, which contains the IP packet, which contains the TCP segment, which contains the HTTP packet, which contains the message.
Physical Layer The physical layer in this case is network cable connecting your computer to the rest of the network. The computer will take the Ethernet frame (complete with the IP packet, the TCP segment, the HTTP packet, and the message) and sends it as a series of electrical pulses through your cable to the server.
When the server gets the message, this process is performed in reverse. The physical hardware translates the electrical pulses into computer data and passes the message to the data link layer. The data link layer uses the start and stop markers in the Ethernet frame to identify the message. The data link layer checks for errors and, if it discovers one, requests that the message be resent. If a message is received without error, the data link layer will strip off the Ethernet frame and pass the IP packet (which contains the TCP segment, the HTTP packet, and the message) to the network layer. The network layer checks the IP address and, if it is destined for this computer, strips off the IP packet and passes the TCP segment, which contains the HTTP packet and the message to the transport layer. The transport layer processes the message, strips off the TCP segment, and passes the HTTP packet to the application layer for processing. The application layer (i.e., the Web server) reads the HTTP packet and the message it contains (the request for the Web page) and processes it by generating an HTTP packet containing the Web page you requested. Then the process starts again as the page is sent back to you.
There are three important points in this example. First, there are many different software packages and many different PDUs that operate at different layers to successfully transfer a message. Networking is in some ways similar to the Russian Matryoshka, nested dolls that fit neatly inside each other. This is called encapsulation, because the PDU at a higher level is placed inside the PDU at a lower level so that the lower level PDU encapsulates the higher level one. The major advantage of using different software and protocols is that it is easy to develop new software, because all one has to do is write software for one level at a time. The developers of Web applications, for example, do not need to write software to perform error checking or routing, because those are performed by the data link and network layers. Developers can simply assume those functions are performed and just focus on the application layer. Likewise, it is simple to change the software at any level (or add new application protocols), as long as the interface between that layer and the ones around it remains unchanged.
Second, it is important to note that for communication to be successful, each layer in one computer must be able to communicate with its matching layer in the other computer. For example, the physical layer connecting the client and server must use the same type of electrical signals to enable each to understand the other (or there must be a device to translate between them). Ensuring that the software used at the different layers is the same is accomplished by using standards. A standard defines a set of rules, called protocols, that explain exactly how hardware and software that conform to the standard are required to operate. Any hardware and software that conform to a standard can communicate with any other hardware and software that conform to the same standard. Without standards, it would be virtually impossible for computers to communicate.
Third, the major disadvantage of using a layered network model is that it is somewhat inefficient. Because there are several layers, each with its own software and PDUs, sending a message involves many software programs (one for each protocol) and many PDUs. The PDUs add to the total amount of data that must be sent (thus increasing the time it takes to transmit), and the different software packages increase the processing power needed in computers. Because the protocols are used at different layers and are stacked on top of one another (take another look at Figure 1.4), the set of software used to understand the different protocols is often called a protocol stack.
Implications of Computer Network Communication
There are three key implications for management from this topic. First, networks and the Internet change almost everything. The ability to quickly and easily move information from distant locations and to enable individuals inside and outside the firm to access information and products from around the world changes the way organizations operate, the way businesses buy and sell products, and the way we as individuals work, live, play, and learn.

Figure 1.7 One server farm with more than 1000 servers
Companies and individuals that embrace change and actively seek to apply networks and the Internet to better improve what they do, will thrive; companies and individuals that do not, will gradually find themselves falling behind.
Second, today’s networking environment is driven by standards. The use of standard technology means an organization can easily mix and match equipment from different vendors. The use of standard technology also means that it is easier to migrate from older technology to a newer technology, because most vendors designed their products to work with many different standards. The use of a few standard technologies rather than a wide range of vendor-specific proprietary technologies also lowers the cost of networking because network managers have fewer technologies they need to learn about and support. If your company is not using a narrow set of industry-standard networking technologies (whether those are de facto standards such as Windows, open standards such as Linux, or formal standards such as 802.11n wireless LANs), then it is probably spending too much money on its networks.
Third, as the demand for network services and network capacity increases, so too will the need for storage and server space. Finding efficient ways to store all the information we generate will open new market opportunities. Today, Google has almost half a million Web servers (see Figure 1.7).
SUMMARY
Introduction The information society, where information and intelligence are the key drivers of personal, business, and national success, has arrived. Data communications is the principal enabler of the rapid information exchange and will become more important than the use of computers themselves in the future. Successful users of data communications, such as Wal-Mart, can gain significant competitive advantage in the marketplace.
Network Definitions A local area network (LAN) is a group of microcomputers or terminals located in the same general area. A backbone network (BN) is a large central network that connects almost everything on a single company site. A metropolitan area network (MAN) encompasses a city or county area. A wide area network (WAN) spans city, state, or national boundaries. Network Model Communication networks are often broken into a series of layers, each of which can be defined separately, to enable vendors to develop software and hardware that can work together in the overall network. In this topic, we use a five-layer model. The application layer is the application software used by the network user. The transport layer takes the message generated by the application layer and, if necessary, breaks it into several smaller messages. The network layer addresses the message and determines its route through the network. The data link layer formats the message to indicate where it starts and ends, decides when to transmit it over the physical media, and detects and corrects any errors that occur in transmission. The physical layer is the physical connection between the sender and receiver, including the hardware devices (e.g., computers, terminals, and modems) and physical media (e.g., cables and satellites). Each layer, except the physical layer, adds a protocol data unit (PDU) to the message.
Standards Standards ensure that hardware and software produced by different vendors can work together. A formal standard is developed by an official industry or government body. De facto standards are those that emerge in the marketplace and are supported by several vendors but have no official standing. Many different standards and standards-making organizations exist. Future Trends Pervasive networking will change how and where we work and with whom we do business. As the capacity of networks increases dramatically, new ways of doing business will emerge. The integration of voice, video, and data onto the same networks will greatly simplify networks and enable anyone to access any media at any point. The rise in these pervasive, integrated networks will mean a significant increase in the availability of information and new information services such as application service providers (ASPs) and information utilities.
This transmission medium is typically used for long-distance data or voice transmission. It does not require the laying of any cable, because long-distance antennas with microwave repeater stations can be placed approximately 25 to 50 miles apart. A typical long-distance antenna might be ten feet wide, although over shorter distances in the inner cities, the dish antennas can be less than two feet in diameter. The airwaves in larger cities are becoming congested because so many microwave dish antennas have been installed that they interfere with one another.
Satellite Satellite transmission is similar to microwave transmission except instead of transmission involving another nearby microwave dish antenna, it involves a satellite many miles up in space. Figure 3.13 depicts a geosynchronous satellite. Geosynchronous means that the satellite remains stationary over one point on the earth. One disadvantage of satellite transmission is the propagation delay that occurs because the signal has to travel out into space and back to earth, a distance of many miles that even at the speed of light can be noticeable.

Figure 3.13 Satellites in operation
Low earth orbit (LEO) satellites are placed in lower orbits to minimize propogation delay. Satellite transmission is sometimes also affected by raindrop attenuation when satellite transmissions are absorbed by heavy rain. It is not a major problem, but engineers need to work around it.
Satellite Communications Improve Performance
MANAGEMENT FOCUS
Boyle Transportation hauls hazardous materials nationwide for both commercial customers and the government, particularly the U.S. Department of Defense. The Department of Defense recently mandated that hazardous materials contractors use mobile communications systems with up-to-the-minute monitoring when hauling the department’s hazardous cargoes.
After looking at the alternatives, Boyle realized that it would have to build its own system. Boyle needed a relational database at its operations center that contained information about customers, pickups, deliveries, truck location, and truck operating status. Data is distributed from this database via satellite to an antenna on each truck. Now, at any time, Boyle can notify the designated truck to make a new pickup via the bidirectional satellite link and record the truck’s acknowledgment.
Each truck contains a mobile data terminal connected to the satellite network. Each driver uses a keyboard to enter information, which transmits the location of the truck. This satellite data is received by the main offices via a leased line from the satellite earth station.
This system increased productivity by an astounding 80 percent over 2 years; administration costs increased by only 20 percent.
Media Selection
Which media are best? It is hard to say, particularly when manufacturers continue to improve various media products. Several factors are important in selecting media (Figure 3.14).
• The type of network is one major consideration. Some media are used only for WANs (microwaves and satellite), whereas others typically are not (twisted-pair, coaxial cable, radio, and infrared), although we should note that some old WAN networks still use twisted-pair cable. Fiber-optic cable is unique in that it can be used for virtually any type of network.
• Cost is always a factor in any business decision. Costs are always changing as new technologies are developed and as competition among vendors drives prices down. Among the guided media, twisted-pair wire is generally the cheapest, coaxial cable is somewhat more expensive, and fiber-optic cable is the most expensive. The cost of the wireless media is generally driven more by distance than any other factor. For very short distances (several hundred meters), radio and infrared are the cheapest; for moderate distances (several hundred miles), microwave is cheapest; and for long distances, satellite is cheapest.
• Transmission distance is a related factor. Twisted pair wire, coaxial cable, infrared, and radio can transmit data only a short distance before the signal must be regenerated. Twisted-pair wire and radio typically can transmit up to 100 to 300 meters, and coaxial cable and infrared typically between 200 and 500 meters. Fiber optics can transmit up to 75 miles, with new types of fiber-optic cable expected to reach more than 600 miles.
Guided Media
| ||||||
Media
|
Network
Type
|
Cost
|
Transmission Distance
|
Security
|
Error Rates
|
Speed
|
Twisted Pair
|
LAN
|
Low
|
Short
|
Good
|
Low
|
Low-high
|
Coaxial Cable
|
LAN
|
Moderate
|
Short
|
Good
|
Low
|
Low-high
|
Fiber Optics
|
Any
|
High
|
Moderate-long
|
Very good
|
Very low
|
High-very high
|
Radiated Media
| ||||||
Media
|
Network Type
|
Cost
|
Transmission Distance
|
Security
|
Error Rates
|
Speed
|
Radio
|
LAN
|
Low
|
Short
|
Poor
|
Moderate
|
Moderate
|
Infrared
|
LAN, BN
|
Low
|
Short
|
Poor
|
Moderate
|
Low
|
Microwave
|
WAN
|
Moderate
|
Long
|
Poor
|
Low-moderate
|
Moderate
|
Satellite
|
WAN
|
Moderate
|
Long
|
Poor
|
Low-moderate
|
Moderate
|
Figure 3.14 Media summary. BN = backbone network; LAN = local area network; WAN = wide area network
• Security is primarily determined by whether the media is guided or wireless. Wireless media (radio, infrared, microwave, and satellite) are the least secure because their signals are easily intercepted. Guided media (twisted pair, coaxial, and fiber optics) are more secure, with fiber optics being the most secure.
• Error rates are also important. Wireless media are most susceptible to interference and thus have the highest error rates. Among the guided media, fiber optics provides the lowest error rates, coaxial cable the next best, and twisted-pair cable the worst, although twisted-pair cable is generally better than the wireless media.
• Transmission speeds vary greatly among the different media. It is difficult to quote specific speeds for different media because transmission speeds are constantly improving and because they vary within the same type of media, depending on the specific type of cable and the vendor. In general, both twisted-pair cable and coaxial cable can provide data rates of between 1 and 100 Mbps (1 million bits per second), whereas fiber-optic cable ranges between 100Mbps and 10 Gbps (10 billion bits per second). Radio and infrared generally provide 1 to 50Mbps, as do microwave and satellite.
Digital Transmission of Digital Data
All computer systems produce binary data. For these data to be understood by both the sender and receiver, both must agree on a standard system for representing the letters, numbers, and symbols that compose messages. The coding scheme is the language that computers use to represent data.
Coding
A character is a symbol that has a common, constant meaning. A character might be the letter A or B, or it might be a number such as 1 or 2. Characters also may be special symbols such as ? or &. Characters in data communications, as in computer systems, are represented by groups of bits that are binary zeros (0) and ones (1). The groups of bits representing the set of characters that are the "alphabet" of any given system are called a coding scheme, or simply a code.
A byte is a group of consecutive bits that is treated as a unit or character. One byte normally is composed of 8 bits and usually represents one character; however, in data communications, some codes use 5, 6, 7, 8, or 9 bits to represent a character. For example, representation of the character A by a group of 8 bits (say, 01 000 001) is an example of coding.
There are three predominant coding schemes in use today. United States of America Standard Code for Information Interchange (USASCII, or, more commonly, ASCII) is the most popular code for data communications and is the standard code on most microcomputers. There are two types of ASCII; one is a seven-bit code that has 128 valid character combinations, and the other is an eight-bit code that has 256 combinations. The number of combinations can be determined by taking the number 2 and raising it to the power equal to the number of bits in the code because each bit has two possible values, a 0 or a 1. In this case 27 = 128 characters or 28 = 256 characters.
A second commonly used coding scheme is ISO 8859, which is standardized by the International Standards Organization, ISO 8859 is an eight-bit code that includes the ASCII codes plus non-English letters used by many European languages (e.g., letters with acents). If you look closely at Figure 2.20, you will see that HTML often uses ISO 8859.
Unicode is the other commonly used coding scheme. There are many different versions of Unicode. UTF-8 is an eight-bit version which is very similar to ASCII. UTF-16, which uses 16-bits per character (i.e. two bytes, called a "word"), is used by Windows. By using more bits, UTF-16 can represent many more characters beyond the usual English or Latin characters, such as Cyrillic or Chinese.
We can choose any pattern of bits we like to represent any character we like, as long as all computers understand what each bit pattern represents. Figure 3.15 shows the eight-bit binary bit patterns used to represent a few of the characters we use in ASCII.
Transmission Modes
Parallel Parallel transmission is the way the internal transfer of binary data takes place inside a computer. If the internal structure of the computer is eight-bit, then all eight bits of the data element are transferred between main memory and the central processing unit simultaneously on eight separate connections. The same is true of computers that use a 32-bit structure; all 32 bits are transferred simultaneously on 32 connections.
Figure 3.16 shows how all eight bits of one character could travel down a parallel communication circuit. The circuit is physically made up of eight separate wires, wrapped in one outer coating. Each physical wire is used to send one bit of the eight-bit character. However, as far as the user is concerned (and the network for that matter), there is only one circuit; each of the wires inside the cable bundle simply connects to a different part of the plug that connects the computer to the bundle of wire.
Character
|
ASCII
|
A
|
01000001
|
B
|
01000010
|
C
|
01000011
|
D
|
01000100
|
E
|
01000101
|
a
|
01100001
|
b
|
01100010
|
c
|
01100011
|
d
|
01100100
|
e
|
01100101
|
1
|
00110001
|
2
|
00110010
|
3
|
00110011
|
4
|
00110100
|
!
|
00100001
|
$
|
00100100
|
Figure 3.15 Binary numbers used to represent different characters using ASCII

Figure 3.16 Parallel transmission of an 8-bit code

Figure 3.17 Serial transmission of an 8-bit code
Serial Serial transmission means that a stream of data is sent over a communication circuit sequentially in a bit-by-bit fashion as shown in Figure 3.17. In this case, there is only one physical wire inside the bundle and all data must be transmitted over that one physical wire. The transmitting device sends one bit, then a second bit, and so on, until all the bits are transmitted. It takes n iterations or cycles to transmit n bits. Thus, serial transmission is considerably slower than parallel transmission—eight times slower in the case of 8-bit ASCII (because there are 8 bits). Compare Figure 3.17 with Figure 3.16.
Basic Electricity
TECHNICAL FOCUS
There are two general categories of electrical current: direct current and alternating current. Current is the movement or flow of electrons, normally from positive (+) to negative (-). The plus (+) or minus (-) measurements are known as polarity. Directcurrent (DC) travels in only one direction, whereas alternating current(AC) travels first in one direction and then in the other direction.
A copper wire transmitting electricity acts like a hose transferring water. We use three common terms when discussing electricity. Voltage is defined as electrical pressure —the amount of electrical force pushing electrons through a circuit. In principle, it is the same as pounds per square inch in a water pipe. Amperes (amps) are units of electrical flow, or volume. This measure is analogous to gallons per minute for water. The watt is the fundamental unit of electrical power. It is a rate unit, not a quantity. You obtain the wattage by multiplying the volts by the amperes.
Digital Transmission
Digital transmission is the transmission of binary electrical or light pulses in that it only has two possible states, a 1 or a 0. The most commonly encountered voltage levels range from a low of +3/-3 to a high of +24/-24 volts. Digital signals are usually sent over wire of no more than a few thousand feet in length.
All digital transmission techniques require a set of symbols (to define how to send a 1 and a 0), and the symbol rate (how many symbols will be sent per second).
Figure 3.18 shows four types of digital transmission techniques. With unipolar signaling, the voltage is always positive or negative (like a DC current). Figure 3.18 illustrates a unipolar technique in which a signal of 0 volts (no current) is used to transmit a zero, and a signal of +5 volts is used to transmit a 1.
An obvious question at this point is this: If 0volts means a zero, how do you send no data?For the moment, we will just say that there are ways to indicate when a message starts and stops, and when there are no messages to send, the sender and receiver agree to ignore any electrical signal on the line.
To successfully send and receive a message, both the sender and receiver have to agree on how often the sender can transmit data—that is, on the symbol rate. For example, if the symbol rate on a circuit is 64 Hertz (Hz) (64,000 symbols per second), then the sender changes the voltage on the circuit once every 1/64,000 of a second and the receiver must examine the circuit every V64,000 of a second to read the incoming data.
")
Figure 3.18 Unipolar, bipolar, and Manchester signals (digital)
In bipolar signaling, the 1′s and 0′s vary from a plus voltage to a minus voltage (like an AC current). The first bipolar technique illustrated in Figure 3.18 is called nonreturn to zero (NRZ) because the voltage alternates from +5 volts (a symbol indicating a 1) and —5 volts (a symbol indicating a 0) without ever returning to 0 volts. The second bipolar technique in this figure is called return to zero (RZ) because it always returns to 0volts after each bit before going to +5 volts (the symbol for a 1) or —5 volts (the symbol for a 0). In Europe, bipolar signaling sometimes is called double current signaling because you are moving between a positive and negative voltage potential.
In general, bipolar signaling experiences fewer errors than unipolar signaling because the symbols are more distinct. Noise or interference on the transmission circuit is less likely to cause the bipolar’s +5 volts to be misread as a —5 volts than it is to cause the unipolar’s 0 volts as a +5 volts. This is because changing the polarity of a current (from positive to negative, or vice versa) is more difficult than changing its magnitude.
How Ethernet Transmits Data
The most common technology used in LANs is Ethernet3; if you are working in a computer lab on campus, you are most likely using Ethernet. Ethernet uses digital transmission over either serial or parallel circuits, depending on which version of Ethernet you use. One version of Ethernet that uses serial transmission requires 1/10,000,000 of a second to send one symbol; that is, it transmits 10 million symbols (each of 1 bit) per second. This gives a data rate of 10 Mbps, and if we assume that there are 8 bits in each character, this means that about 1.25 million characters can be transmitted per second in the circuit.
Ethernet uses Manchester encoding. Manchester encoding is a special type of bipolar signaling in which the signal is changed from high to low or from low to high in the middle of the signal. A change from high to low is used to represent a 0, whereas the opposite (a change from low to high) is used to represent a 1. See Figure 3.18. Manchester encoding is less susceptible to having errors go undetected, because if there is no transition in midsignal the receiver knows that an error must have occurred.
Analog transmission of digital data (Data Communications and Networking)
Telephone networks were originally built for human speech rather than for data. They were designed to transmit the electrical representation of sound waves, rather than the binary data used by computers. There are many occasions when data need to be transmitted over a voice communications network. Many people working at home still use a modem over their telephone line to connect to the Internet.
The telephone system (commonly called POTS for plain old telephone service) enables voice communication between any two telephones within its network. The telephone converts the sound waves produced by the human voice at the sending end into electrical signals for the telephone network. These electrical signals travel through the network until they reach the other telephone and are converted back into sound waves.
Analog transmission occurs when the signal sent over the transmission media continuously varies from one state to another in a wavelike pattern much like the human voice. Modems translate the digital binary data produced by computers into the analog signals required by voice transmission circuits. One modem is used by the transmitter to produce the analog signals and a second by the receiver to translate the analog signals back into digital signals.
The sound waves transmitted through the voice circuit have three important characteristics (see Figure 3.19). The first is the height of the wave, called amplitude. Amplitude is measured in decibels (dB). Our ears detect amplitude as the loudness or volume of sound. Every sound wave has two parts, half above the zero amplitude point (i.e., positive) and half below (i.e., negative), and both halves are always the same height.
The second characteristic is the length of the wave, usually expressed as the number of waves per second, or frequency. Frequency is expressed in hertz (Hz).4 Our ears detect frequency as the pitch of the sound. Frequency is the inverse of the length of the sound wave, so that a high frequency means that there are many short waves in a one-second interval, whereas a low frequency means that there are fewer (but longer) waves in 1 second.
The third characteristic is the phase, which refers to the direction in which the wave begins. Phase is measured in the number of degrees (°). The wave in Figure 3.19 starts up and to the right, which is defined as 0° phase wave. Waves can also start down and to the right (a 180° phase wave), and in virtually any other part of the sound wave.
Modulation
When we transmit data through the telephone lines, we use the shape of the sound waves we transmit (in terms of amplitude, frequency, and phase) to represent different data values.

figure 3.19 Sound wave

Figure 3.20 Amplitude modulation
We do this by transmitting a simple sound wave through the circuit (called the carrier wave) and then changing its shape in different ways to represent a 1 or a 0. Modulation is the technical term used to refer to these "shape changes." There are three fundamental modulation techniques: amplitude modulation, frequency modulation, and phase modulation. Once again, the sender and receiver have to agree on what symbols will be used (what amplitude, frequency, and phase will represent a 1 and a 0) and on the symbol rate (how many symbols will be sent per second).
Basic Modulation With amplitude modulation (AM) (also called amplitude shift keying [ASK]), the amplitude or height of the wave is changed. One amplitude is the symbol defined to be 0, and another amplitude is the symbol defined to be a 1. In the AM shown in Figure 3.20, the highest amplitude symbol (tallest wave) represents a binary 1 and the lowest amplitude symbol represents a binary 0. In this case, when the sending device wants to transmit a 1, it would send a high-amplitude wave (i.e., a loud signal). AM is more susceptible to noise (more errors) during transmission than is frequency modulation or phase modulation.
Frequency modulation (FM) (also called frequency shift keying [FSK]) is a modulation technique whereby each 0 or 1 is represented by a number of waves per second (i.e., a different frequency). In this case, the amplitude does not vary. One frequency (i.e., a certain number of waves per second) is the symbol defined to be a 1, and a different frequency (a different number of waves per second) is the symbol defined to be a 0. In Figure 3.21, the higher-frequency wave symbol (more waves per time period) equals a binary 1, and the lower frequency wave symbol equals a binary 0.

Figure 3.21 Frequency modulation

Figure 3.22 Phase modulation
Phase modulation (PM) (also called phase shift keying [PSK]) is the most difficult to understand. Phase refers to the direction in which the wave begins. Until now, the waves we have shown start by moving up and to the right (this is called a 0° phase wave). Waves can also start down and to the right. This is called a phase of 180°. With phase modulation, one phase symbol is defined to be a 0 and the other phase symbol is defined to be a 1. Figure 3.22 shows the case where a phase of 0° symbol is defined to be a binary 0 and a phase of 180° symbol is defined to be a binary 1.
Sending Multiple Bits Simultaneously Each of the three basic modulation techniques (AM, FM, and PM) can be refined to send more than 1 bit at one time. For example, basic AM sends 1 bit per wave (or symbol) by defining two different amplitudes, one for a 1 and one for a 0. It is possible to send 2 bits on one wave or symbol by defining four different amplitudes. Figure 3.23 shows the case where the highest-amplitude wave is defined to be a symbol representing two bits, both 1′s. The next highest amplitude is the symbol defined to mean first a 1 and then a 0, and so on.
This technique could be further refined to send 3 bits at the same time by defining 8 different symbols, each with different amplitude levels or 4 bits by defining 16 symbols, each with different amplitude levels, and so on. At some point, however, it becomes very difficult to differentiate between the different amplitudes. The differences are so small that even a small amount of noise could destroy the signal.
This same approach can be used for FM and PM. Two bits could be sent on the same symbol by defining four different frequencies, one for 11, one for 10, and so on, or by defining four phases (0°, 90°, 180°, and 270°).

Figure 3.23 Two-bit amplitude modulation
Three bits could be sent by defining symbols with eight frequencies or eight phases (0°, 45°, 90°, 135°, 180°, 225°, 270°, and 315°). These techniques are also subject to the same limitations as AM; as the number of different frequencies or phases becomes larger, it becomes difficult to differentiate among them.
It is also possible to combine modulation techniques—that is, to use AM, FM, and PM techniques on the same circuit. For example, we could combine AM with four defined amplitudes (capable of sending 2 bits) with FM with four defined frequencies (capable of sending 2 bits) to enable us to send 4 bits on the same symbol.
One popular technique is quadrature amplitude modulation (QAM). QAM involves splitting the symbol into eight different phases (3 bits) and two different amplitudes (1 bit), for a total of 16 different possible values. Thus, one symbol in QAM can represent 4 bits. A newer version of QAM called 64-QAM sends 6 bits per symbol and is used in wireless LANs.
Bit Rate versus Baud Rate versus Symbol Rate The terms bit rate (i.e., the number bits per second transmitted) and baud rate are used incorrectly much of the time. They often are used interchangeably, but they are not the same. In reality, the network designer or network user is interested in bits per second because it is the bits that are assembled into characters, characters into words and, thus, business information.
A bit is a unit of information. A baud is a unit of signaling speed used to indicate the number of times per second the signal on the communication circuit changes. Because of the confusion over the term baud rate among the general public, ITU-T now recommends the term baud rate be replaced by the term symbol rate. The bit rate and the symbol rate (or baud rate) are the same only when one bit is sent on each symbol. For example, if we use AM with two amplitudes, we send one bit on one symbol. Here, the bit rate equals the symbol rate. However, if we use QAM, we can send 4 bits on every symbol; the bit rate would be four times the symbol rate. If we used 64-QAM, the bit rate would be six times the symbol rate. Virtually all of today’s modems send multiple bits per symbol.
Capacity of a Circuit
The data capacity of a circuit is the fastest rate at which you can send your data over the circuit in terms of the number of bits per second. The data rate (or bit rate) is calculated by multiplying the number of bits sent on each symbol by the maximum symbol rate. As we discussed in the previous section, the number of bits per symbol depends on the modulation technique (e.g., QAM sends 4 bits per symbol).
The maximum symbol rate in any circuit depends on the bandwidth available and the signal-to-noise ratio (the strength of the signal compared with the amount of noise in the circuit). The bandwidth is the difference between the highest and the lowest frequencies in a band or set of frequencies. The range of human hearing is between 20 Hz and 14,000 Hz, so its bandwidth is 13,880 Hz. The maximum symbol rate for analog transmission is usually the same as the bandwidth as measured in Hertz. If the circuit is very noisy, the maximum symbol rate may fall as low as 50 percent of the bandwidth. If the circuit has very little noise, it is possible to transmit at rates up to the bandwidth.
Digital transmission symbol rates can reach as high as two times the bandwidth for techniques that have only one voltage change per symbol (e.g., NRZ). For digital techniques that have two voltage changes per symbol (e.g., RZ, Manchester), the maximum symbol rate is the same as the bandwidth.
Standard telephone lines provide a bandwidth of 4,000 Hz. Under perfect circumstances, the maximum symbol rate is therefore about 4,000 symbols per second. If we were to use basic AM (1 bit per symbol), the maximum data rate would be 4,000 bits per second (bps). If we were to use QAM (4 bits per symbol), the maximum data rate would be 4 bits per symbol x 4,000 symbols per second = 16,000 bps. A circuit with a 10 MHz bandwidth using 64-QAM could provide up to 60 Mbps.
How Modems Transmit Data
The modem (an acronym for modulator/cferoodulator) takes the digital data from a computer in the form of electrical pulses and converts them into the analog signal that is needed for transmission over an analog voice-grade circuit. There are many different types of modems available today from dial-up modems to cable modems. For data to be transmitted between two computers using modems, both need to use the same type of modem. Fortunately, several standards exist for modems, and any modem that conforms to a standard can communicate with any other modem that conforms to the same standard.
A modem’s data transmission rate is the primary factor that determines the throughput rate of data, but it is not the only factor. Data compression can increase throughput of data over a communication link by literally compressing the data. V.44, the ISO standard for data compression, uses Lempel-Ziv encoding. As a message is being transmitted, Lempel-Ziv encoding builds a dictionary of two-, three-, and four-character combinations that occur in the message. Anytime the same character pattern reoccurs in the message, the index to the dictionary entry is transmitted rather than sending the actual data. The reduction provided by V.44 compression depends on the actual data sent but usually averages about 6:1 (i.e., almost six times as much data can be sent per second using V.44 as without it).
In the same way that digital computer data can be sent over analog telephone networks using analog transmission, analog voice data can be sent over digital networks using digital transmission. This process is somewhat similar to the analog transmission of digital data. A pair of special devices called codecs {code!decode) is used in the same way that a pair of modems is used to translate the data to send across the circuit. One codec is attached to the source of the signal (e.g., a telephone or the local loop at the end office) and translates the incoming analog voice signal into a digital signal for transmission across the digital circuit. A second codec at the receiver’s end translates the digital data back into analog data.
Translating from Analog to Digital
Analog voice data must first be translated into a series of binary digits before they can be transmitted over a digital circuit. This is done by sampling the amplitude of the sound wave at regular intervals and translating it into a binary number. Figure 3.24 shows an example where eight different amplitude levels are used (i.e., each amplitude level is represented by three bits). The top diagram shows the original signal, and the bottom diagram, the digitized signal.
A quick glance will show that the digitized signal is only a rough approximation of the original signal. The original signal had a smooth flow, but the digitized signal has jagged "steps."
")
Figure 3.24 Pulse amplitude modulation (PAM)
The difference between the two signals is called quantizing error. Voice transmissions using digitized signals that have a great deal of quantizing error sound metallic or machinelike to the ear.
There are two ways to reduce quantizing error and improve the quality of the digitized signal, but neither is without cost. The first method is to increase the number of amplitude levels. This minimizes the difference between the levels (the "height" of the "steps") and results in a smoother signal. In Figure 3.24, we could define 16 amplitude levels instead of eight levels. This would require four bits (rather than the current three bits) to represent the amplitude, thus increasing the amount of data needed to transmit the digitized signal.
No amount of levels or bits will ever result in perfect-quality sound reproduction, but in general, seven bits (27 = 128 levels) reproduces human speech adequately. Music, on the other hand, typically uses 16 bits (216 = 65,536 levels).
The second method is to sample more frequently. This will reduce the "length" of each "step," also resulting in a smoother signal. To obtain a reasonable-quality voice signal, one must sample at least twice the highest possible frequency in the analog signal. You will recall that the highest frequency transmitted in telephone circuits is 4,000Hz. Thus, the methods used to digitize telephone voice transmissions must sample the input voice signal at a minimum of 8,000 times per second. Sampling more frequently than this (called oversampling) will improve signal quality. RealNet works.com, which produces Real Audio and other Web-based tools, sets its products to sample at 48,000 times per second to provide higher quality. The iPod and most CDs sample at 44,100 times per second and use 16 bits per sample to produce almost error-free music. MP3 players often sample less frequently and use fewer bits per sample to produce smaller transmissions, but the sound quality may suffer.
How Telephones Transmit Voice Data
When you make a telephone call, the telephone converts your analog voice data into a simple analog signal and sends it down the circuit from your home to the telephone company’s network. This process is almost unchanged from the one used by Bell when he invented the telephone in 1876. With the invention of digital transmission, the common carriers (i.e., the telephone companies) began converting their voice networks to use digital transmission. Today, all of the common carrier networks use digital transmission, except in the local loop (sometimes called the last mile), the wires that run from your home or business to the telephone switch that connects your local loop into the telephone network. This switch contains a codec that converts the analog signal from your phone into a digital signal. This digital signal is then sent through the telephone network until it hits the switch for local loop for the person you are calling. This switch uses its codec to convert the digital signal used inside the phone network back into the analog signal needed by that person’s local loop and telephone. See Figure 3.25.
There are many different combinations of sampling frequencies and numbers of bits per sample that could be used. For example, one could sample 4,000 times per second using 128 amplitude levels (i.e., 7 bits) or sample at 16,000 times per second using 256 levels (i.e., 8 bits).
")
Figure 3.25 Pulse amplitude modulation (PAM)
The North American telephone network uses pulse code modulation (PCM). With PCM, the input voice signal is sampled 8,000 times per second. Each time the input voice signal is sampled, 8 bits are generated.5 Therefore, the transmission speed on the digital circuit must be 64,000 bps (8 bits per sample x 8,000 samples per second) to transmit a voice signal when it is in digital form. Thus, the North American telephone network is built using millions of 64 Kbps digital circuits that connect via codecs to the millions of miles of analog local loop circuits into the users’ residences and businesses.
How Instant Messenger Transmits Voice Data
A 64 Kbps digital circuit works very well for transmitting voice data because it provides very good quality. The problem is that it requires a lot of capacity.
Adaptive differential pulse code modulation (ADPCM) is the alternative used by IM and many other applications that provide voice services over lower-speed digital circuits. ADPCM works in much the same way as PCM. It samples incoming voice signal 8,000 times per second and calculates the same 8-bit amplitude value as PCM. However, instead of transmitting the 8-bit value, it transmits the difference between the 8-bit value in the last time interval and the current 8-bit value (i.e., how the amplitude has changed from one time period to another). Because analog voice signals change slowly, these changes can be adequately represented by using only 4 bits. This means that ADPCM can be used on digital circuits that provide only 32 Kbps (4 bits per sample x 8,000 samples per second = 32,000 bps).
Networking Your Car
MANAGEMENT FOCUS
Cars are increasingly becoming computers on wheels. About 30% of the cost of a car lies in its electronics — chips, networks, and software. Computers have been used in cars for many years for driving control (e.g., engine management systems, antilock brakes, air bag controls), but as CD players, integrated telephones (e.g., Cadillac’s OnStar), and navigation systems become more common, the demands on car networks are quickly increasing. More manufacturers are moving to digital computer controls rather than traditional analog controls for many of the car’s basic functions (e.g., BMW’s iDrive), making the car network a critical part of car design.
In many ways, a car network is similar to a local area network. There are a set of devices (e.g., throttle control, brakes, fuel injection, CD player, navigation system) connected by a network. Traditionally, each device has used its own proprietary protocol. Today, manufacturers are quickly moving to adopt standards to ensure that all components work together across one common network. One common standard is Media-Oriented Systems Transport (MOST). Any device that conforms to the MOST standard can be plugged into the network and can communicate with the other devices.
The core of the MOST standard is a set of 25 or 40 megabit per second fiber-optic cables that run throughout the car. Fiber-optic cabling was chosen over more traditional coaxial or twisted pair cabling because it provides a high capacity sufficient for most future predicted needs, is not susceptible to interference, and weighs less than coaxial or twisted pair cables. Compared to coaxial or twisted pair cables, fiber-optic cables saves hundreds of feet of cabling and tens of pounds of weight in a typical car. Weight is important in car design, whether it is a high performance luxury sedan or an economical entry level car, because increased weight decreases both performance and gas mileage.
As digital devices such as Bluetooth phones and Wi-Fi wireless computer networks become standard on cars, the push to digital networks will only increase.
Several versions of ADPCM have been developed and standardized by the ITU-T. There are versions designed for 8 Kbps circuits (which send 1 bit 8,000 times per second) and 16Kbps circuits (which send 2 bits 8,000 times per second), as well as the original 32 Kbps version. However, there is a trade-off here. Although the 32 Kbps version usually provides as good a sound quality as that of a traditional voice telephone circuit, the 8 Kbps and 16 Kbps versions provide poorer sound quality.
Voice over Internet Protocol (VoIP)
Voice over Internet Protocol (VoIP, pronounced voyp) is commonly used to transmit phone conversations over digital networks. VoIP is a relatively new standard that uses digital telephones with built-in codecs to convert analog voice data into digital data (see Figure 3.26).

Figure 3.26 VoIP phone
Because the codec is built into the telephone, the telephone transmits digital data and therefore can be connected directly into a Local Area Network, in much the same manner as a typical computer. Because VoIP phones operate on the same networks as computers, we can reduce the amount of wiring needed; with VoIP, we need to operate and maintain only one network throughout our offices, rather than two separate networks—one for voice and one for data. However, this also means that data networks with VoIP phones must be designed to operate in emergencies (to enable 911 calls) even when the power fails; they must have uninterruptable power supplies (UPS) for all network circuits.
One commonly used VoIP standard is G.722 wideband audio, which is a version of ADPCM that operates at 64 Kbps. It samples 8,000 times per second and produces eight bits per sample.
Because VoIP phones are digital, they can also contain additional capabilities. For example, high-end VoIP phones often contain computer chips to enable them to download and install small software applications so that they can function in many ways like computers.

e- Networking and Hybrid in computer communication to next count rolling SAW for ADA
( Address -- Data -- Accumulation )

++++++++++++++++++++++++++++++++++++++++++++++++++++++++++++++++++++++++++
There are a set of devices (e.g., throttle control, brakes, fuel injection, CD player, navigation system) connected by a network.
BalasHapusyou manage a server that runs your company website the web server has reached its capacity