electronic lockers in the balance sheet how debits and credits can be calculated and used like an electronic locker: such as Automatic Teller Machine, e-money, electronic clearing where debit and credit transactions can be used in electronic locker balances, especially in e-money transactions

examples of electronic financial statements instead of using a general ledger :

Profit per share - Kanematsu Electronics
| 81.2 | 92.7 | 107 | 101 | 121 | 145 | 184 |
Sales per share - Kanematsu Electronics
| 1595 | 1636 | 1576 | 2234 | 2164 | 2143 | 2244 |
P/E ratio - Kanematsu Electronics
| 10.2 | 9.8 | 10.8 | 14.4 | 14.7 | 13.0 | 15.4 |
Kanematsu Electronics Ltd: Share Earnings Data (in JPY)
| 2011 | 2012 | 2013 | 2014 | 2015 | 2016 | 2017 | |
|---|---|---|---|---|---|---|---|
| Basic earnings per share | 81.22 | 92.73 | 107.04 | 100.63 | 121.24 | 145.29 | 184.09 |
| Diluted earnings per share | 81.22 | 92.73 | 107.04 | 100.63 | 121.24 | 145.29 | 184.09 |
| Dividend per share | 40.00 | 45.00 | 50.00 | 55.00 | 65.00 | 75.00 | 90.00 |
| Distribution of dividends | - | - | - | - | - | - | - |
Kanematsu Electronics Ltd: Key Data (in JPY)
| 2011 | 2012 | 2013 | 2014 | 2015 | 2016 | 2017 | |
|---|---|---|---|---|---|---|---|
| Sales per share | 1,595.22 | 1,635.50 | 1,575.55 | 2,233.78 | 2,164.31 | 2,143.14 | 2,243.75 |
| P/E ratio (year end quote, basic EPS) | 10.17 | 9.85 | 10.84 | 14.43 | 14.71 | 13.01 | 15.42 |
| P/E ratio (ear end quote, diluted EPS) | 10.17 | 9.85 | 10.84 | 14.43 | 14.71 | 13.01 | 15.42 |
| P/E ratio (year end quote) | 10.17 | 9.85 | 10.84 | 14.43 | 14.71 | 13.01 | 15.42 |
| Dividend yield in % | 4.84 | 4.93 | 4.31 | 3.79 | 3.65 | 3.97 | 3.17 |
| Equity ratio in % | 76.29 | 74.95 | 68.86 | 67.86 | 67.86 | 69.76 | 68.55 |
| Debt ratio in % | 23.71 | 25.05 | 31.14 | 32.14 | 32.14 | 30.24 | 31.45 |
Kanematsu Electronics Ltd: Income statement (in MILLION JPY)
| 2011 | 2012 | 2013 | 2014 | 2015 | 2016 | 2017 | |
|---|---|---|---|---|---|---|---|
| Sales | 45,623 | 46,774 | 45,059 | 63,884 | 61,897 | 61,290 | 64,167 |
| Change of sales in % | 5.64 | 2.52 | -3.67 | 41.78 | -3.11 | -0.98 | 4.69 |
| Gross profit on sales | 13,159 | 13,673 | 13,794 | 17,180 | 16,911 | 16,476 | 18,409 |
| Gross profit on sales change in % | 0.26 | 3.91 | 0.88 | 24.55 | -1.57 | -2.57 | 11.73 |
| Operating income | 4,230 | 4,600 | 4,763 | 5,405 | 6,108 | 6,391 | 8,408 |
| Operating income change in % | 17.56 | 8.76 | 3.54 | 13.47 | 13.02 | 4.63 | 31.56 |
| Income before tax | 4,043 | 4,691 | 5,063 | 4,929 | 6,083 | 6,503 | 7,853 |
| Income before tax change in % | 9.28 | 16.05 | 7.92 | -2.65 | 23.42 | 6.90 | 20.75 |
| Income after tax | 2,323 | 2,652 | 3,061 | 2,878 | 3,467 | 4,155 | 5,265 |
| Income after tax change in % | 7.39 | 14.17 | 15.43 | -5.99 | 20.49 | 19.83 | 26.70 |
Kanematsu Electronics Ltd: Balance (in MILLION JPY)
| 2011 | 2012 | 2013 | 2014 | 2015 | 2016 | 2017 | |
|---|---|---|---|---|---|---|---|
| Total liabilities | 9,821 | 11,047 | 14,573 | 16,027 | 17,783 | 16,674 | 19,194 |
| Total liabilities change in % | 24.25 | 23.95 | 89.15 | 103.62 | 98.35 | 114.67 | 97.97 |
| Equity | 31,603 | 33,149 | 36,085 | 37,126 | 37,979 | 38,657 | 41,999 |
| Equity change in % | 3.79 | 4.81 | 5.32 | 3.39 | 4.91 | 2.00 | 8.68 |
| Balance sheet total | 41,424 | 44,196 | 50,659 | 53,153 | 55,762 | 55,331 | 61,193 |
| Balance sheet total change in % | 5.22 | 6.69 | 14.62 | 4.92 | 4.91 | -0.77 | 10.59 |
Kanematsu Electronics Ltd: Other data (in JPY)
| 2011 | 2012 | 2013 | 2014 | 2015 | 2016 | 2017 | |
|---|---|---|---|---|---|---|---|
| Profit per share (basic) | 81.22 | 92.73 | 107.04 | 100.63 | 121.24 | 145.29 | 184.09 |
| Profit per share (basic) change in % | 7.39 | 14.17 | 15.43 | -5.99 | 20.48 | 19.84 | 26.71 |
| Profit per share (diluted) | 81.22 | 92.73 | 107.04 | 100.63 | 121.24 | 145.29 | 184.09 |
| Profit per share (diluted) change in % | - | 14.17 | 15.43 | -5.99 | 20.48 | 19.84 | 26.71 |
| Number of employees | 1,050 | 1,039 | 1,686 | 1,656 | 1,579 | 1,495 | 1,358 |
| Number of employees change in % | -1.59 | -1.05 | 62.27 | -1.78 | -4.65 | -5.32 | -9.16 |
XXX . V Introduction to Balance Sheet ( modern finance : tech locker on electronic base )
Introduction to Balance Sheet
The accounting balance sheet is one of the major financial statements used by accountants and business owners. (The other major financial statements are the income statement, statement of cash flows, and statement of stockholders' equity) The balance sheet is also referred to as the statement of financial position.The balance sheet presents a company's financial position at the end of a specified date. Some describe the balance sheet as a "snapshot" of the company's financial position at a point (a moment or an instant) in time. For example, the amounts reported on a balance sheet dated December 31, 2016 reflect that instant when all the transactions through December 31 have been recorded.
Because the balance sheet informs the reader of a company's financial position as of one moment in time, it allows someone—like a creditor—to see what a company owns as well as what it owes to other parties as of the date indicated in the heading. This is valuable information to the banker who wants to determine whether or not a company qualifies for additional credit or loans. Others who would be interested in the balance sheet include current investors, potential investors, company management, suppliers, some customers, competitors, government agencies, and labor unions.
In Part 1 we will explain the components of the balance sheet and in Part 2 we will present a sample balance sheet. If you are interested in balance sheet analysis, that is included in the Explanation of Financial Ratios.
We will begin our explanation of the accounting balance sheet with its major components, elements, or major categories:
- Assets
- Liabilities
- Owner's (Stockholders') Equity
Note: You can earn our three Certificates Achievement for Financial Statements, Debits and Credits, and Adjusting Entries when you upgrade your account to PRO Plus.
Assets
Assets are things that the company owns. They are the resources of the company that have been acquired through transactions, and have future economic value that can be measured and expressed in dollars. Assets also include costs paid in advance that have not yet expired, such as prepaid advertising, prepaid insurance, prepaid legal fees, and prepaid rent. (For a discussion of prepaid expenses go to Explanation of Adjusting Entries.)Examples of asset accounts that are reported on a company's balance sheet include:
- Cash
- Petty Cash
- Temporary Investments
- Accounts Receivable
- Inventory
- Supplies
- Prepaid Insurance
- Land
- Land Improvements
- Buildings
- Equipment
- Goodwill
Contra assets are asset accounts with credit balances. (A credit balance in an asset account is contrary—or contra—to an asset account's usual debit balance.) Examples of contra asset accounts include:
- Allowance for Doubtful Accounts
- Accumulated Depreciation-Land Improvements
- Accumulated Depreciation-Buildings
- Accumulated Depreciation-Equipment
- Accumulated Depletion
- Etc.
Accountants usually prepare classified balance sheets. "Classified" means that the balance sheet accounts are presented in distinct groupings, categories, or classifications. The asset classifications and their order of appearance on the balance sheet are:
An outline of a balance sheet using the balance sheet classifications is shown here:
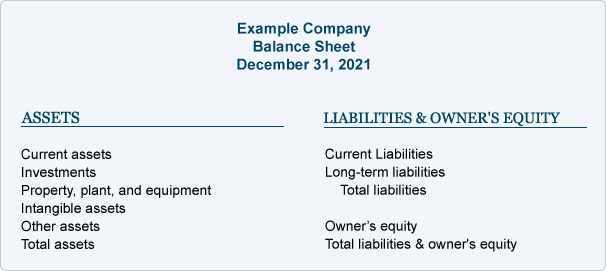
Effect of Cost Principle and Monetary Unit Assumption
The amounts reported in the asset accounts and on the balance sheet reflect actual costs recorded at the time of a transaction. For example, let's say a company acquires 40 acres of land in the year 1950 at a cost of $20,000. Then, in 1990, it pays $400,000 for an adjacent 40-acre parcel. The company's Land account will show a balance of $420,000 ($20,000 for the first parcel plus $400,000 for the second parcel.). This account balance of $420,000 will appear on today's balance sheet even though these parcels of land have appreciated to a current market value of $3,000,000.There are two guidelines that oblige the accountant to report $420,000 on the balance sheet rather than the current market value of $3,000,000: (1) the cost principle directs the accountant to report the company's assets at their original historical cost, and (2) the monetary unit assumption directs the accountant to presume the U.S. dollar is stable over time—it is not affected by inflation or deflation. In effect, the accountant is assuming that a 1950 dollar, a 1990 dollar, and a 2016 dollar all have the same purchasing power.
The cost principle and monetary unit assumption may also mean that some very valuable resources will not be reported on the balance sheet. A company's team of brilliant scientists will not be listed as an asset on the company's balance sheet, because (a) the company did not purchase the team in a transaction (cost principle) and (b) it's impossible for accountants to know how to put a dollar value on the team (monetary unit assumption).
Coca-Cola's logo, Nike's logo, and the trade names for most consumer products companies are likely to be their most valuable assets. If those names and logos were developed internally, it is reasonable that they will not appear on the company balance sheet. If, however, a company should purchase a product name and logo from another company, that cost will appear as an asset on the balance sheet of the acquiring company.
Remember, accounting principles and guidelines place some limitations on what is reported as an asset on the company's balance sheet.
Effect of Conservatism
While the cost principle and monetary unit assumption generally prevent assets from being reported on the balance sheet at an amount greater than cost, conservatism will result in some assets being reported at less than cost. For example, assume the cost of a company's inventory was $30,000, but now the current cost of the same items in inventory has dropped to $27,000. The conservatism guideline instructs the company to report Inventory on its balance sheet at $27,000. The $3,000 difference is reported immediately as a loss on the company's income statement.Effect of Matching Principle
The matching principle will also cause certain assets to be reported on the accounting balance sheet at less than cost. For example, if a company has Accounts Receivable of $50,000 but anticipates that it will collect only $48,500 due to some customers' financial problems, the company will report a credit balance of $1,500 in the contra asset account Allowance for Doubtful Accounts. The combination of the asset Accounts Receivable with a debit balance of $50,000 and the contra asset Allowance for Doubtful Accounts with a credit balance will mean that the balance sheet will report the net amount of $48,500. The income statement will report the $1,500 adjustment as Bad Debts Expense.The matching principle also requires that the cost of buildings and equipment be depreciated over their useful lives. This means that over time the cost of these assets will be moved from the balance sheet to Depreciation Expense on the income statement. As time goes on, the amounts reported on the balance sheet for these long-term assets will be reduced.
Liabilities
Liabilities are obligations of the company; they are amounts owed to creditors for a past transaction and they usually have the word "payable" in their account title. Along with owner's equity, liabilities can be thought of as a source of the company's assets. They can also be thought of as a claim against a company's assets. For example, a company's balance sheet reports assets of $100,000 and Accounts Payable of $40,000 and owner's equity of $60,000. The source of the company's assets are creditors/suppliers for $40,000 and the owners for $60,000. The creditors/suppliers have a claim against the company's assets and the owner can claim what remains after the Accounts Payable have been paid.Liabilities also include amounts received in advance for future services. Since the amount received (recorded as the asset Cash) has not yet been earned, the company defers the reporting of revenues and instead reports a liability such as Unearned Revenues or Customer Deposits.
Examples of liability accounts reported on a company's balance sheet include:
- Notes Payable
- Accounts Payable
- Salaries Payable
- Wages Payable
- Interest Payable
- Other Accrued Expenses Payable
- Income Taxes Payable
- Customer Deposits
- Warranty Liability
- Lawsuits Payable
- Unearned Revenues
- Bonds Payable
Contra liabilities are liability accounts with debit balances. (A debit balance in a liability account is contrary—or contra—to a liability account's usual credit balance.) Examples of contra liability accounts include:
- Discount on Notes Payable
- Discount on Bonds Payable
- Debt Issue Costs
- Bond Issue Costs
Classifications Of Liabilities On The Balance Sheet
Liability and contra liability accounts are usually classified (put into distinct groupings, categories, or classifications) on the balance sheet. The liability classifications and their order of appearance on the balance sheet are:To see how various liability accounts are placed within these classifications .
Commitments
A company's commitments (such as signing a contract to obtain future services or to purchase goods) may be legally binding, but they are not considered a liability on the balance sheet until some services or goods have been received. Commitments (if significant in amount) should be disclosed in the notes to the balance sheet.Form vs. Substance
The leasing of a certain asset may—on the surface—appear to be a rental of the asset, but in substance it may involve a binding agreement to purchase the asset and to finance it through monthly payments. Accountants must look past the form and focus on the substance of the transaction. If, in substance, a lease is an agreement to purchase an asset and to create a note payable, the accounting rules require that the asset and the liability be reported in the accounts and on the balance sheet.Contingent Liabilities
Three examples of contingent liabilities include warranty of a company's products, the guarantee of another party's loan, and lawsuits filed against a company. Contingent liabilities are potential liabilities. Because they are dependent upon some future event occurring or not occurring, they may or may not become actual liabilities.To illustrate this, let's assume that a company is sued for $100,000 by a former employee who claims he was wrongfully terminated. Does the company have a liability of $100,000? It depends. If the company was justified in the termination of the employee and has documentation and witnesses to support its action, this might be considered a frivolous lawsuit and there may be no liability. On the other hand, if the company was not justified in the termination and it is clear that the company acted improperly, the company will likely have an income statement loss and a balance sheet liability.
The accounting rules for these contingencies are as follows: If the contingent loss is probable and the amount of the loss can be estimated, the company needs to record a liability on its balance sheet and a loss on its income statement. If the contingent loss is remote, no liability or loss is recorded and there is no need to include this in the notes to the financial statements. If the contingent loss lies somewhere in between, it should be disclosed in the notes to the financial statements.
Current vs. Long-term Liabilities
If a company has a loan payable that requires it to make monthly payments for several years, only the principal due in the next twelve months should be reported on the balance sheet as a current liability. The remaining principal amount should be reported as a long-term liability. The interest on the loan that pertains to the future is not recorded on the balance sheet; only unpaid interest up to the date of the balance sheet is reported as a liability.Notes to the Financial Statements
As the above discussion indicates, the notes to the financial statements can reveal important information that should not be overlooked when reading a company's balance sheet.Owner's (Stockholders') Equity
Owner's Equity—along with liabilities—can be thought of as a source of the company's assets. Owner's equity is sometimes referred to as the book value of the company, because owner's equity is equal to the reported asset amounts minus the reported liability amounts.Owner's equity may also be referred to as the residual of assets minus liabilities. These references make sense if you think of the basic accounting equation:
| Assets = Liabilities + Owner's Equity |
| and just rearrange the terms: |
| Owner's Equity = Assets - Liabilities |
- Common Stock
- Preferred Stock
- Paid-in Capital in Excess of Par Value
- Paid-in Capital from Treasury Stock
- Retained Earnings
- Accumulated Other Comprehensive Income
- Etc.
Contra owner's equity accounts are a category of owner equity accounts with debit balances. (A debit balance in an owner's equity account is contrary—or contra—to an owner's equity account's usual credit balance.) An example of a contra owner's equity account is Mary Smith, Drawing (where Mary Smith is the owner of the sole proprietorship). An example of a contra stockholders' equity account is Treasury Stock.
Classifications of Owner's Equity On The Balance Sheet
Owner's equity is generally represented on the balance sheet with two or three accounts (e.g., Mary Smith, Capital; Mary Smith, Drawing; and perhaps Current Year's Net Income). See the sample balance sheet in Part 4.The stockholders' equity section of a corporation's balance sheet is:
The stockholders' equity section of a corporation's balance sheet is:
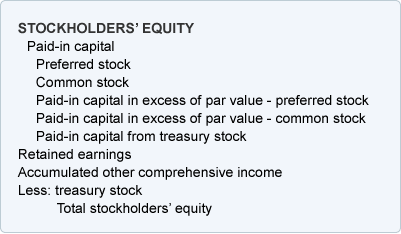
Owner's Equity vs. Company's Market Value
Since the asset amounts report the cost of the assets at the time of the transaction—or less—they do not reflect current fair market values. (For example, computers which had a cost of $100,000 two years ago may now have a book value of $60,000. However, the current value of the computers might be just $35,000. An office building purchased by the company 15 years ago at a cost of $400,000 may now have a book value of $200,000. However, the current value of the building might be $900,000.) Since the assets are not reported on the balance sheet at their current fair market value, owner's equity appearing on the balance sheet is not an indication of the fair market value of the company.Owner's Equity and Temporary Accounts
Revenues, gains, expenses, and losses are income statement accounts. Revenues and gains cause owner's equity to increase. Expenses and losses cause owner's equity to decrease. If a company performs a service and increases its assets, owner's equity will increase when the Service Revenues account is closed to owner's equity at the end of the accounting year.Sample Balance Sheet
Most accounting balance sheets classify a company's assets and liabilities into distinctive groupings such as Current Assets; Property, Plant, and Equipment; Current Liabilities; etc. These classifications make the balance sheet more useful. The following balance sheet example is a classified balance sheet.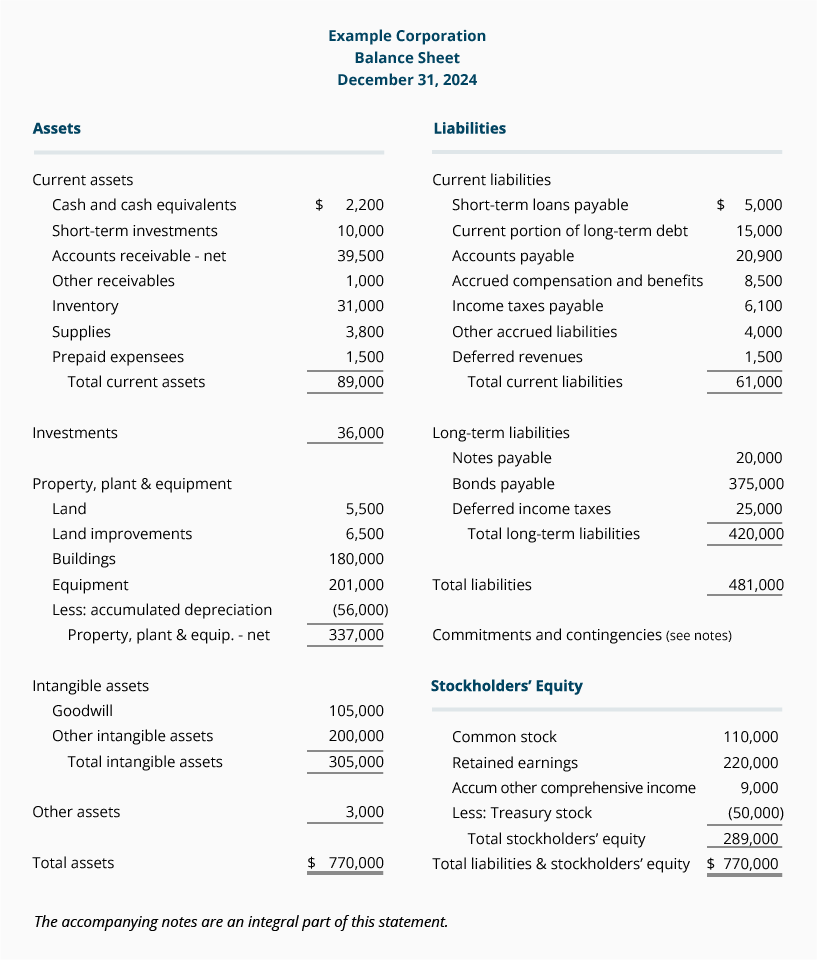
Whether you are a business person or student of business, our Master Set of 87 Business Forms will assist you in preparing financial statements, financial ratios, break-even calculations, depreciation, standard cost variances, and much, much more.
Notes To Financial Statements
The notes (or footnotes) to the balance sheet and to the other financial statements are considered to be part of the financial statements. The notes inform the readers about such things as significant accounting policies, commitments made by the company, and potential liabilities and potential losses. The notes contain information that is critical to properly understanding and analyzing a company's financial statements.It is common for the notes to the financial statements to be 10-20 pages in length. Go to the website for a company whose stock is publicly traded and locate its annual report. Review the notes near the end of the annual report.
Financial Ratios
A number of important financial ratios and statistics are generated by using amounts that are taken from the balance sheet.XXX . V0 Financial Ratios
Introduction to Financial Ratios
When computing financial ratios and when doing other financial statement analysis always keep in mind that the financial statements reflect the accounting principles. This means assets are generally not reported at their current value. It is also likely that many brand names and unique product lines will not be included among the assets reported on the balance sheet, even though they may be the most valuable of all the items owned by a company.These examples are signals that financial ratios and financial statement analysis have limitations. It is also important to realize that an impressive financial ratio in one industry might be viewed as less than impressive in a different industry.
Our explanation of financial ratios and financial statement analysis is organized as follows:
- Balance Sheet
- General discussion
- Common-size balance sheet
- Financial ratios based on the balance sheet
- Income Statement
- General discussion
- Common-size income statement
- Financial ratios based on the income statement
- Statement of Cash Flows
New! We just released our 29-page Managerial & Cost Accounting Insights. This PDF document is designed to deepen your understanding of topics such as product costing, overhead cost allocations, estimating cost behavior, costs for decision making, and more. It is only available when you join AccountingCoach PRO.
General Discussion of Balance Sheet
The balance sheet reports a company's assets, liabilities, and stockholders' equity as of a specific date, such as December 31, 2016, March 31, 2016, etc.The accountants' cost principle and the monetary unit assumption will limit the assets reported on the balance sheet. Assets will be reported
(1) only if they were acquired in a transaction, and
(2) generally at an amount that is not greater than the asset's cost at the time of the transaction.
This means that a company's creative and effective management team will not be listed as an asset. Similarly, a company's outstanding reputation, its unique product lines, and brand names developed within the company will not be reported on the balance sheet. As you may surmise, these items are often the most valuable of all the things owned by the company. (Brand names purchased from another company will be recorded in the company's accounting records at their cost.)
The accountants' matching principle will result in assets such as buildings, equipment, furnishings, fixtures, vehicles, etc. being reported at amounts less than cost. The reason is these assets are depreciated. Depreciation reduces an asset's book value each year and the amount of the reduction is reported as Depreciation Expense on the income statement.
While depreciation is reducing the book value of certain assets over their useful lives, the current value (or fair market value) of these assets may actually be increasing. (It is also possible that the current value of some assets—such as computers—may be decreasing faster than the book value.)
Current assets such as Cash, Accounts Receivable, Inventory, Supplies, Prepaid Insurance, etc. usually have current values that are close to the amounts reported on the balance sheet.
Current liabilities such as Notes Payable (due within one year), Accounts Payable, Wages Payable, Interest Payable, Unearned Revenues, etc. are also likely to have current values that are close to the amounts reported on the balance sheet.
Long-term liabilities such as Notes Payable (not due within one year) or Bonds Payable (not maturing within one year) will often have current values that differ from the amounts reported on the balance sheet.
Stockholders' equity is the book value of the company. It is the difference between the reported amount of assets and the reported amount of liabilities. For the reasons mentioned above, the reported amount of stockholders' equity will therefore be different from the current or market value of the company.
By definition the current assets and current liabilities are "turning over" at least once per year. As a result, the reported amounts are likely to be similar to their current value. The long-term assets and long-term liabilities are not "turning over" often. Therefore, the amounts reported for long-term assets and long-term liabilities will likely be different from the current value of those items.
The remainder of our explanation of financial ratios and financial statement analysis will use information from the following balance sheet:

To learn more about the balance sheet, go to:
Common-Size Balance Sheet
One technique in financial statement analysis is known as vertical analysis. Vertical analysis results in common-size financial statements. A common-size balance sheet is a balance sheet where every dollar amount has been restated to be a percentage of total assets. We will illustrate this by taking Example Company's balance sheet (shown above) and divide each item by the total asset amount $770,000. The result is the following common-size balance sheet for Example Company:
The benefit of a common-size balance sheet is that an item can be compared to a similar item of another company regardless of the size of the companies. A company can also compare its percentages to the industry's average percentages. For example, a company with Inventory at 4.0% of total assets can look to its industry statistics to see if its percentage is reasonable. (Industry percentages might be available from an industry association, library reference desks, and from bankers. Many banks have memberships in Risk Management Association (RMA), an organization that collects and distributes statistics by industry.) A common-size balance sheet also allows two businesspersons to compare the magnitude of a balance sheet item without either one revealing the actual dollar amounts.
Financial Ratios Based on the Balance Sheet
Financial statement analysis includes financial ratios. Here are three financial ratios that are based solely on current asset and current liability amounts appearing on a company's balance sheet: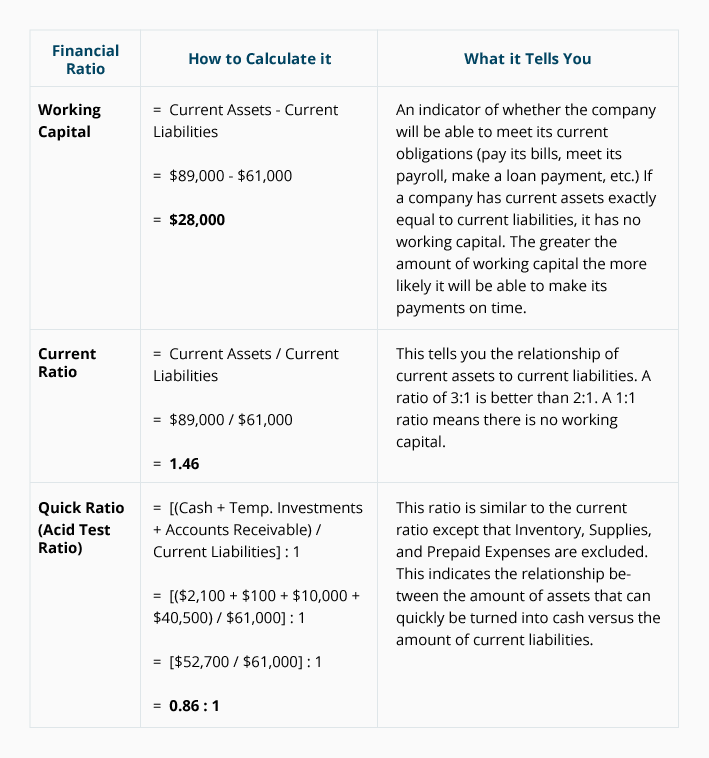
Four financial ratios relate balance sheet amounts for Accounts Receivable and Inventory to income statement amounts. To illustrate these financial ratios we will use the following income statement information:
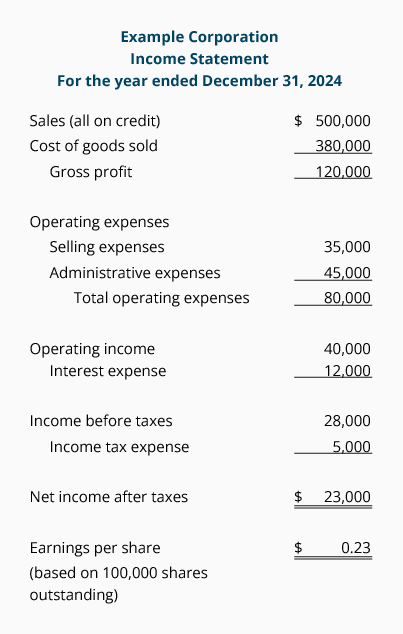
To learn more about the income statement, go to:
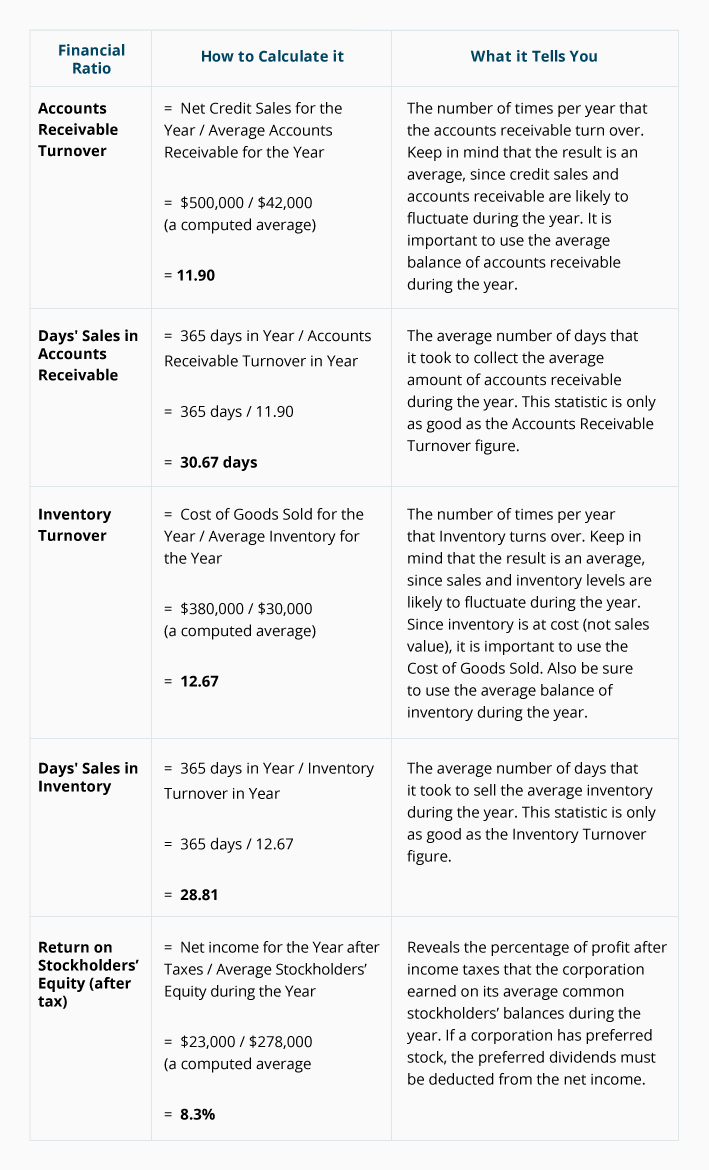
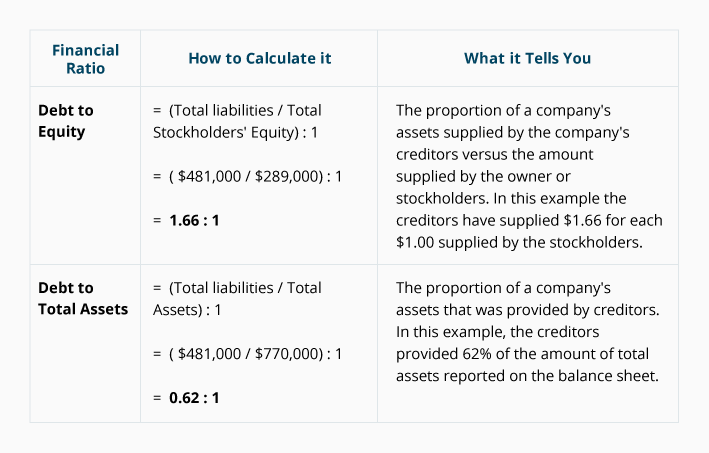
The next financial ratio involves the relationship between two amounts from the balance sheet: total liabilities and total stockholders' equity:
General Discussion of Income Statement
The income statement has some limitations since it reflects accounting principles. For example, a company's depreciation expense is based on the cost of the assets it has acquired and is using in its business. The resulting depreciation expense may not be a good indicator of the economic value of the asset being used up. To illustrate this point let's assume that a company's buildings and equipment have been fully depreciated and therefore there will be no depreciation expense for those buildings and equipment on its income statement. Is zero expense a good indicator of the cost of using those buildings and equipment? Compare that situation to a company with new buildings and equipment where there will be large amounts of depreciation expense.The remainder of our explanation of financial ratios and financial statement analysis will use information from the following income statement:
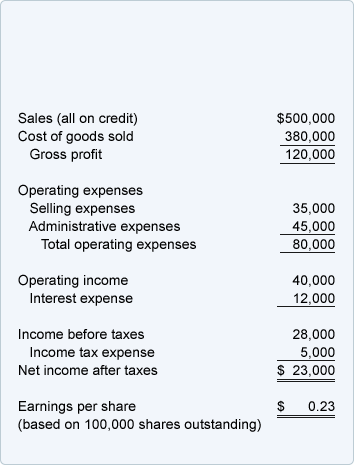
To learn more about the income statement, go to:
Common-Size Income Statement
Financial statement analysis includes a technique known as vertical analysis. Vertical analysis results in common-size financial statements. A common-size income statement presents all of the income statement amounts as a percentage of net sales. Below is Example Corporation's common-size income statement after each item from the income statement above was divided by the net sales of $500,000: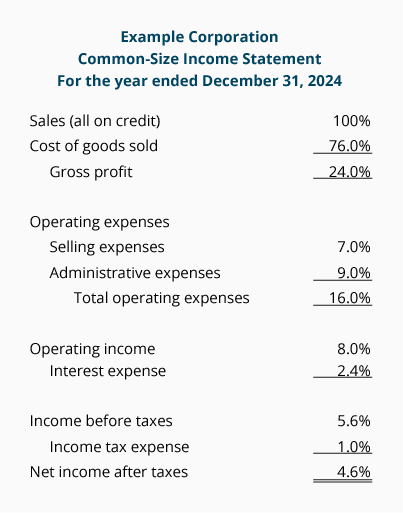
The percentages shown for Example Corporation can be compared to other companies and to the industry averages. Industry averages can be obtained from trade associations, bankers, and library reference desks. If a company competes with a company whose stock is publicly traded, another source of information is that company's "Management's Discussion and Analysis of Financial Condition and Results of Operations" contained in its annual report to the Securities and Exchange Commission (SEC). This annual report is the SEC Form 10-K and is usually accessible under the "Investor Relations" tab on the corporation's website.
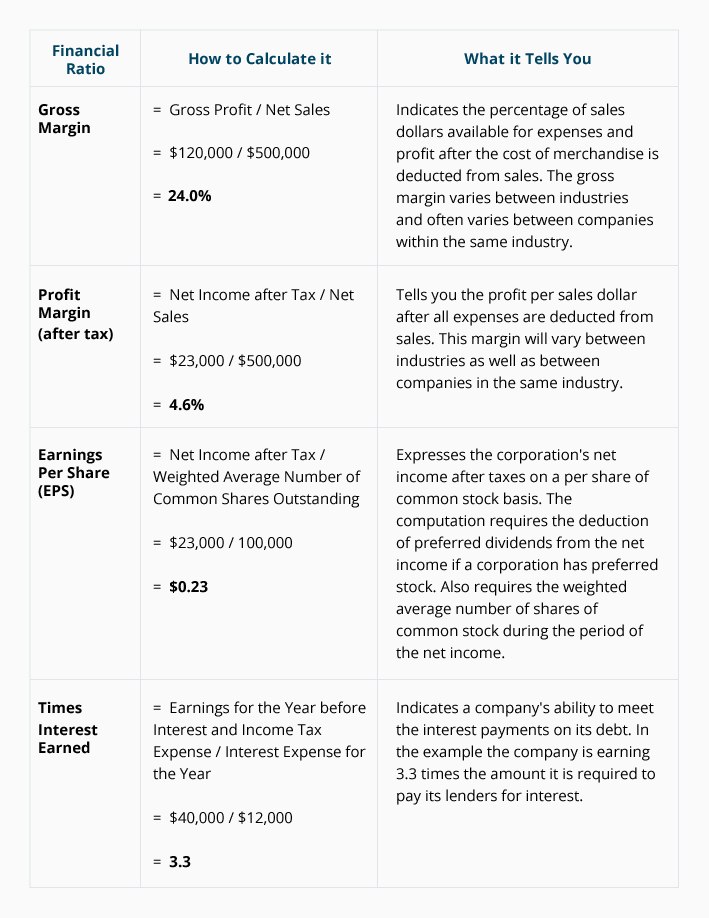
Financial Ratios Based on the Income Statement
Statement of Cash Flows
The statement of cash flows is a relatively new financial statement in comparison to the income statement or the balance sheet. This may explain why there are not as many well-established financial ratios associated with the statement of cash flows.We will use the following cash flow statement for Example Corporation to illustrate a limited financial statement analysis:
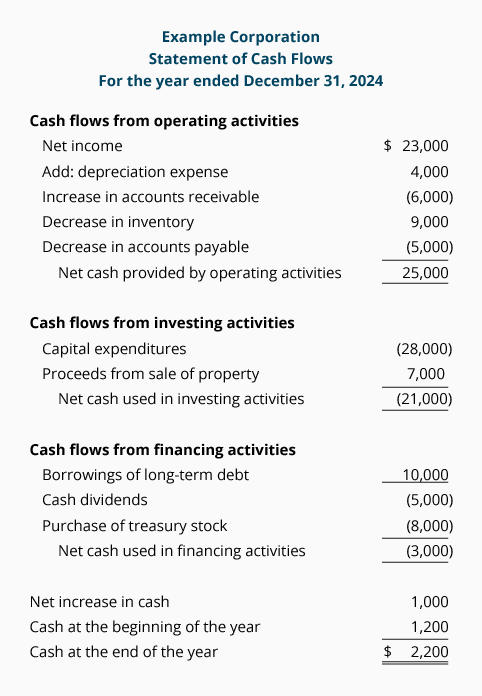
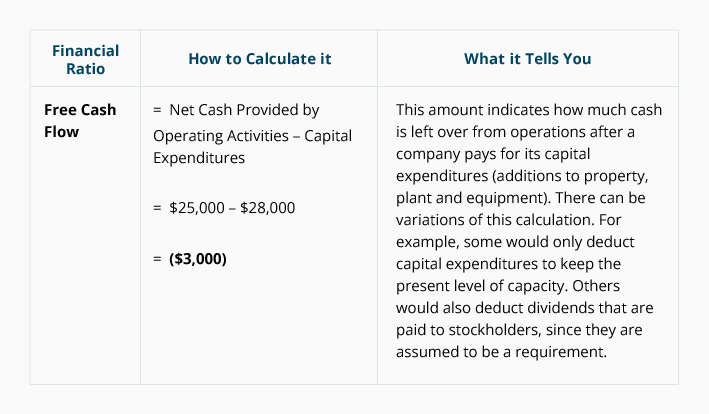
The cash flow from operating activities section of the statement of cash flows is also used by some analysts to assess the quality of a company's earnings. For a company's earnings to be of "quality" the amount of cash flow from operating activities must be consistently greater than the company's net income. The reason is that under accrual accounting, various estimates and assumptions are made regarding both revenues and expenses. When it comes to cash, however, the money is either in the bank or it isn't.
XXX . V00 Cash Flow Statement
Introduction to Cash Flow Statement
The official name for the cash flow statement is the statement of cash flows. We will use both names throughout AccountingCoach.com.The statement of cash flows is one of the main financial statements. (The other financial statements are the balance sheet, income statement, and statement of stockholders' equity.)
The cash flow statement reports the cash generated and used during the time interval specified in its heading. The period of time that the statement covers is chosen by the company. For example, the heading may state "For the Three Months Ended December 31, 2016" or "The Fiscal Year Ended September 30, 2016".
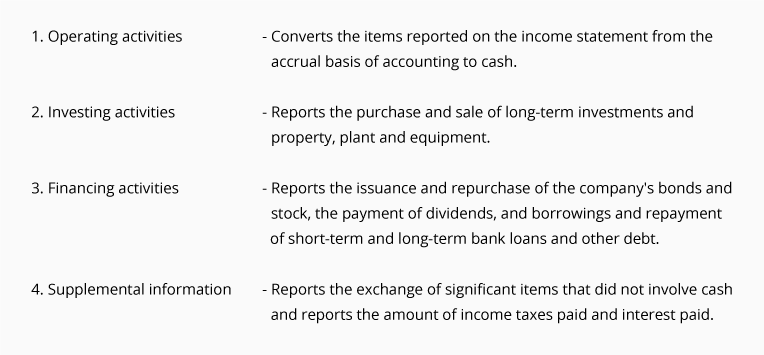
The cash flow statement organizes and reports the cash generated and used in the following categories:
To experience another presentation and to enhance your retention of the cash flow statement see AccountingCoach PRO for our visual tutorial, business forms to assist in preparing the statement, and exam questions.
Note: You can earn our three Certificates Achievement for Financial Statements, Debits and Credits, and Adjusting Entries when you upgrade your account to PRO Plus.
What Can The Statement of Cash Flows Tell Us?
Because the income statement is prepared under the accrual basis of accounting, the revenues reported may not have been collected. Similarly, the expenses reported on the income statement might not have been paid. You could review the balance sheet changes to determine the facts, but the cash flow statement already has integrated all that information. As a result, savvy business people and investors utilize this important financial statement.Here are a few ways the statement of cash flows is used.
- The cash from operating activities is compared to the company's net income. If the cash from operating activities is consistently greater than the net income, the company's net income or earnings are said to be of a "high quality". If the cash from operating activities is less than net income, a red flag is raised as to why the reported net income is not turning into cash.
- Some investors believe that "cash is king". The cash flow statement identifies the cash that is flowing in and out of the company. If a company is consistently generating more cash than it is using, the company will be able to increase its dividend, buy back some of its stock, reduce debt, or acquire another company. All of these are perceived to be good for stockholder value.
- Some financial models are based upon cash flow.
Understanding The Changes In Cash
We often enhance our comprehension of a topic when we have to think through solutions to problems, so to help you really understand the cash flow statement, we've put together some questions for you to answer. As you formulate your response you will be learning to think about cash flows the way an accountant does.- When Mary Smith invests her personal money into her new company, what will happen to her company's Cash account?
Answer The Cash account increases, and because of the double entry system, the owner's equity account Mary Smith, Capital also increases.
- When a company purchases inventory (merchandise purchased in order to be resold) what will happen to its Cash account?
Answer The Cash account decreases, and because of the double entry system, the asset account Inventory increases
- What happens to the company's Cash account if it borrows money from the bank by signing a note payable?
Answer The Cash account increases, and because of the double entry system, the liability account Notes Payable increases
- What happens to a company's Cash account if it declares a dividend on its shares of stock?
Answer It is assumed that the company pays the dividend and therefore the Cash account decreases. Because of the double entry system, the stockholders' equity account Retained Earnings also decreases
- What is the effect on its Cash account when a company pays some of its Accounts Payable?
Answer The Cash account decreases, and because of the double entry system, the liability account Accounts Payable is decreased.
- What is the effect on its Cash account when a company prepays a 6-month insurance premium?
Answer The Cash account decreases, and because of the double entry system, the asset account Prepaid Insurance increases.
- What is the effect on its Cash account when a company sells merchandise, but allows the customer to pay in 30 days?
Answer There is no effect on the Cash account. The transaction does, however, result in a debit to the asset account Accounts Receivable and a credit to the income statement account Sales, which has the effect of increasing sales and net income on the income statement. The transaction changes nothing on the statement of cash flows since there is no cash involved at this time (the cash will be received in 30 days
- What is the effect on its Cash account when a company receives payment from one of its customers 30 days after the sale was recorded?
Answer On the day the cash is received, the Cash account increases, and because of the double entry system, the asset account Accounts Receivable is decreased. (Be aware that this transaction has no effect on the income statement—there is no increase in Sales and no increase in net income.)
- If a company's Accounts Payable account decreased, what is the likely effect this will have on Cash?
Answer If Accounts Payable decreased, we assume that the company paid some of its bills, therefore we assume that the Cash account also decreased.
- If the asset account Prepaid Insurance increased, what is the likely effect on Cash?
Answer If the asset account Prepaid Insurance increased, we assume that the company paid an insurance premium that covered more than the current month. Therefore, we assume that the Cash account decreased. Consider the general journal entry for this transaction:
- If the asset account Land increased, what's the likely effect on Cash?
Answer If the asset account Land increased, we assume that the company paid cash to purchase the land, therefore, the Cash account decreased. Consider the general journal entry for this transaction: If the asset account Land increased, we assume that the company paid cash to purchase the land, therefore, the Cash account decreased. Consider the general journal entry for this transaction:

- If the asset account Land decreased, what's the likely effect on Cash?
Answer The Cash account increased because we assume that the company receives cash from the sale of any and all assets. Consider the general journal entry for this transaction:

- If the liability account Bonds Payable increases, what is the likely effect on Cash?
Answer The Cash account increases because we assume the company receives cash when it issues bonds.
- If the liability account Bonds Payable decreases, what is the likely effect on Cash?
Answer The Cash account decreases because we assume that the company used cash or paid cash to repurchase/redeem/reduce its bonds that are outstanding.
- When an asset (other than cash) increases, the Cash account decreases.
- When an asset (other than cash) decreases, the Cash account increases.
- When a liability increases, the Cash account increases.
- When a liability decreases, the Cash account decreases.
- When owner's equity increases, the Cash account increases.
- When owner's equity decreases, the Cash account decreases.
Format of the Statement of Cash Flows
The statement of cash flows has four distinct sections:- Cash involving operating activities
- Cash involving investing activities
- Cash involving financing activities
- Supplemental information.
Shown below is each of the four sections of the statement of cash flows, followed by a list of those balance sheet accounts which affect it.
1. Cash Provided From or Used By Operating Activities
This section of the cash flow statement reports the company's net income and then converts it from the accrual basis to the cash basis by using the changes in the balances of current asset and current liability accounts, such as:Accounts Receivable
Inventory
Supplies
Prepaid Insurance
Other Current Assets
Notes Payble
Accounts Payable
Wages Payable
Payroll Taxes Payable
Interest Payable
Income Taxes Payable
Unearned Revenues
Other Current Liabilities
In addition to using the changes in current assets and current liabilities, the operating activities section has adjustments for depreciation expense and for the gains and losses on the sale of long-term assets.
2. Cash Provided From or Used By Investing Activities
This section of the cash flow statement reports changes in the balances of long-term asset accounts, such as:Long-term Investments
Land
Buildings
Equipment
Furniture & Fixtures
Vehicles
In short, investing activities involve the purchase and/or sale of long-term investments and property, plant, and equipment.
3. Cash Provided From or Used By Financing Activities
This section of the cash flow statement reports changes in balances of the long-term liability and stockholders' equity accounts, such as:Notes Payable (generally due after one year)
Bonds Payable
Deferred Income Taxes
Preferred Stock
Paid-in Capital in Excess of Par-Preferred Stock
Common Stock
Paid-in Capital in Excess of Par-Common Stock
Paid-in Capital from Treasury Stock
Retained Earnings
Treasury Stock
In short, financing activities involve the issuance and/or the repurchase of a company's own bonds or stock as well as short-term and long-term borrowings and repayments.
4. Supplemental Information
This section of the cash flow statement discloses the amount of interest and income taxes paid. Also reported are significant exchanges not involving cash. For example, the exchange of company stock for company bonds would be reported in this section.Where To Enter The Balance Sheet Changes
Take a look at the summary below—it shows where the changes in balance sheet accounts should be entered on your statement of cash flows: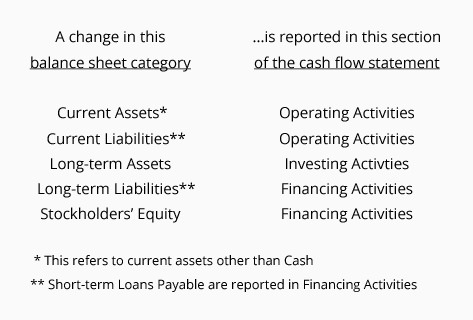
Adjustments Within The Operating Activities Section
When we use the indirect method to prepare a statement of cash flows we begin with the net income figure from the company's income statement as our starting point. We then make adjustments to that figure to arrive at the cash amount.If all of a company's revenues were cash sales (no credit sales), and if the company paid out cash for all of its expenses, then net income would equal the cash from operating activities. However, since some of the revenues and expenses on the income statement were not cash transactions, we must include depreciation, gain or losses on sales of assets, and the changes in current assets and current liabilities.
Story To Illustrate
Matt is a college student who enjoys buying and selling merchandise using the Internet. On January 2, 2016, he decides to turn his hobby into a business called "Good Deal Co." Each month the Good Deal Co. will have one or two transactions. At the end of each month we will prepare an income statement, balance sheet, and a statement of cash flows for the current month and for the year-to-date period. The purpose is to show how these transactions are reported on the cash flow statement.January Transactions and Financial Statements
On January 2, 2016 Matt invests $2,000 of his personal money into his sole proprietorship, Good Deal Co. On January 20, Good Deal buys 14 graphing calculators for $50 per calculator—this is about 50% less than the selling price Matt has observed at the retail stores. The total cost to Good Deal for all 14 calculators is $700. Good Deal has no other transactions during January.Matt prepares financial statements for his new business as of January 31, 2016:
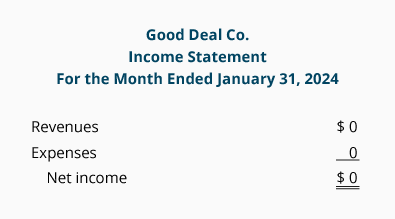
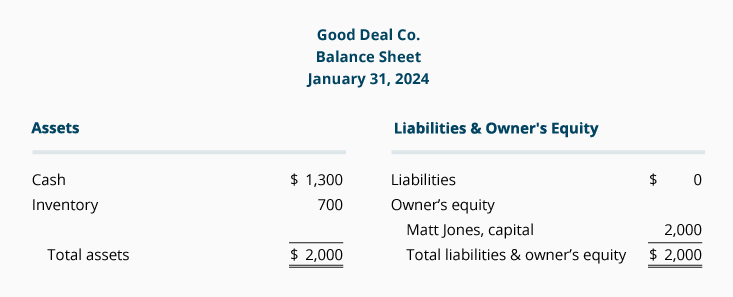
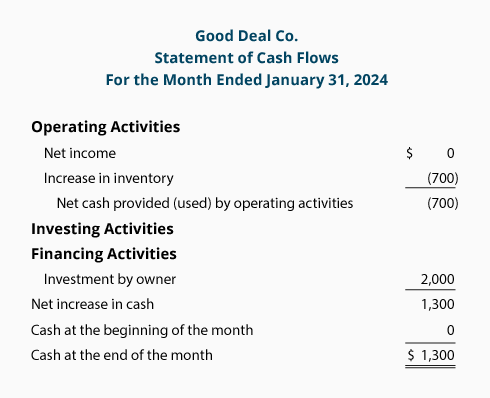
Good Deal's income statement for January showed no profit or loss, since it did not have any sales or expenses. However, the cash flow statement reports that Good Deal's operating activities resulted in a decrease in cash of $700. The decrease in cash occurred because the company increased its inventory by $700 during January. The financing activities section shows an increase in cash of $2,000 which corresponds to the increase in Matt Jones, Capital (Matt's investment in the business). The net change in the Cash account from the owner's investment and the cash outflow for inventory is a positive $1,300.
This net change of a positive $1,300 is verified at the bottom of the cash flow statement and on the balance sheet. There was a $0 cash at January 1, but at January 31, the Cash balance is $1,300.
Here's a Tip
For a change in assets (other than cash)—the change in the Cash account is in the opposite direction. Recall that when Inventory increased by $700, Cash decreased by $700.For a change in liabilities and owner's equity—the change in the Cash account is in the same direction. Recall that when the owner invested cash in the company Cash increased and Owner's Equity increased.
February Transactions and Financial Statements
On February 25, 2016, Good Deal sells 10 calculators to a nearby high school for $80 each. Matt delivers the calculators on February 25 and gives the school an $800 invoice due by March 10. Matt receives $800 from the school on March 8.Matt prepared financial statements for his new business as of February 28, 2016:
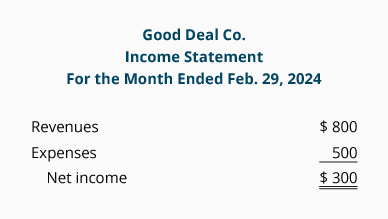
The income statement for the month of February shows revenues (or sales) of $800. Under the accrual basis of accounting—revenue is recognized when title passes (at the time of shipment or time of delivery), not when the money is received. Expenses (such as the cost of goods sold for $500) appear on the income statement when they best match up with revenues, not when the expenses or goods are paid for. (Other expenses will also appear on the income statement when they are used, not when they are paid for.) As a result of the accrual basis of accounting, the income statement reports $300 of net income even though there was no cash inflow or cash outflow during February.
As you can see above, the cash flow statement for the month of February reports no change in cash. That agrees with the company's balance sheet that reported Cash of $1,300 on January 31 and will show $1,300 on February 28.
The year-to-date net income of $300 increases the owner's equity on the balance sheet. Please note the connection between the bottom line of the year-to-date income statement and the change in Matt Jones, Capital on the balance sheet. Matt Jones, Capital has increased from $2,000 to $2,300.
Good Deal's income statement for the first two months shows a positive net income of $300. However, the fact that the company's Accounts Receivable increased by $800 means the company did not collect the cash from its sales. And because Inventory increased by $200, the company's Cash had also decreased in order to pay for the Inventory increase. As a result, the cash flows for the two-month period shows that Good Deal's cash from operating activities is a negative $700. Recall that Good Deal has not received any money yet from its operations (buying and selling merchandise) and it paid out $700 for the 14 calculators it purchased.
The cash flow statement also shows $2,000 of financing by the owner. When this is combined with the negative $700 from operating activities, the net change in cash for the first two months is a positive $1,300. This agrees to the change in cash on the balance sheet—none on January 1 but $1,300 on February 28.
March Transactions and Financial Statements
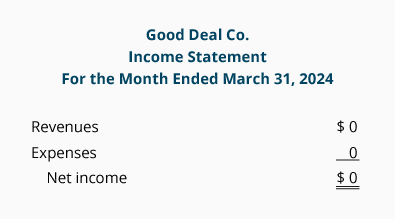
On March 8 Good Deal receives $800 for the calculators sold to the school on February 25. No other transactions occurred in March.The Good Deal financial statements dated March 31 are:
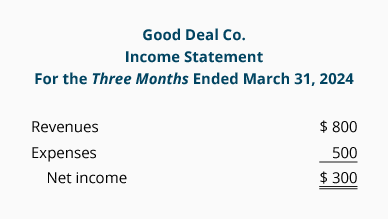
Note that the year-to-date net income causes the amount in the owner's capital account (on the balance sheet) to increase from $2,000 to $2,300.
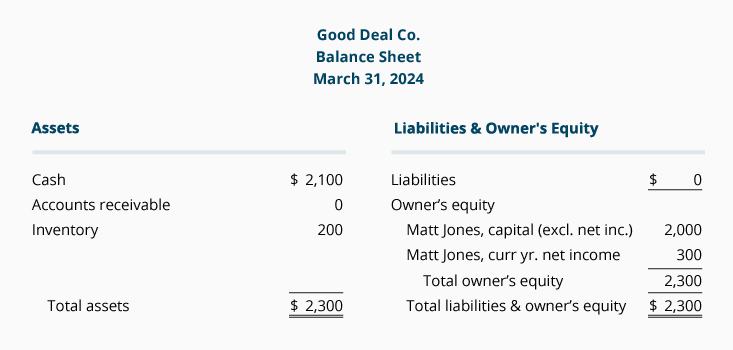
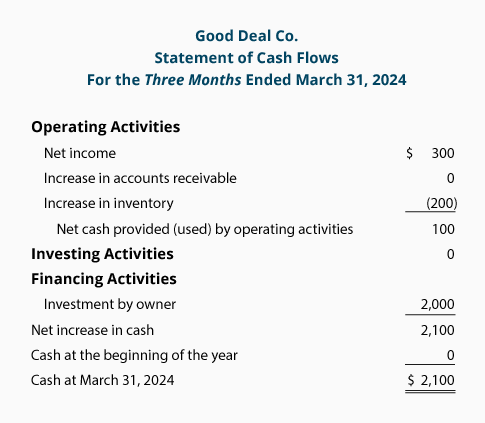
The income statement for the first three months of the business shows a net income of $300. The operating activities section of the statement of cash flows begins with the $300 in net income, but then shows that $200 of cash was used to increase inventory. As a result, only $100 of cash was provided from operating activities.
The statement of cash flows also shows that $2,000 was received from the owner's investment in the company. The net cash inflow from the company's operating, investing, and financing activities for the three months ended March 31, 2016 was $2,100.
The figure of $2,100 represents the change in cash from the beginning of the accounting year through March 31. If you look at the March 31 balance sheet, you will find that it confirms this—there is $2,100 in the Cash account on March 31 and there was $0 on January 1.
The statement of cash flows presented above was for the three months ended March 31, 2016. Let's look at how the statement of cash flows would be prepared for just one month—March 2016.
Since much of the information for the cash flow statement comes from changes in balance sheet accounts, we need to have the balance sheet amounts for both February 28, 2016 and March 31, 2016. The differences in these account balances from February 28 to March 31 will provide us with information we need on the activities in March.
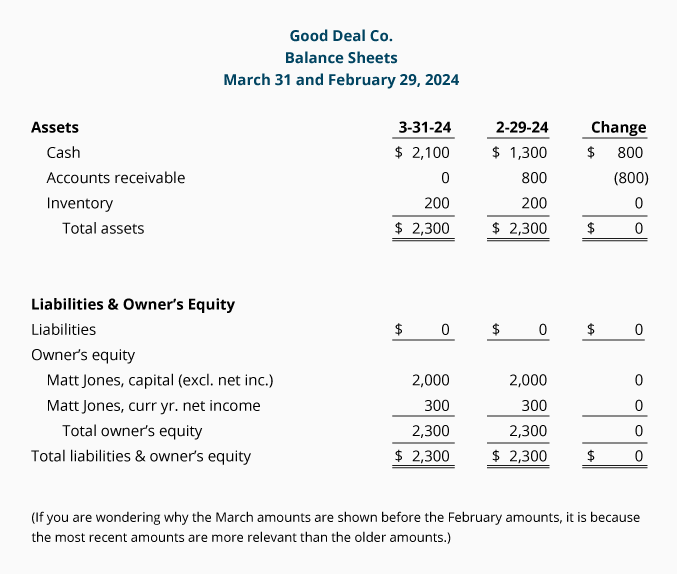
Focus on the "Change" column above. The first amount, a positive $800 change in the Cash account, will serve as a "check figure" for the bottom line of the cash flow statement for the month of March. In other words, the cash flow statement for March must end up explaining this $800 increase in the Cash account. The other amounts in the "Change" column will be used on the statement of cash flows to identify the reasons for the $800 increase in cash.
Since there were no sales and no expenses in March, the income statement for the one month of March (see above) reported no net income. This $0 of net income is the first amount reported on the statement of cash flows. The changes in the balance sheet accounts from February 28 to March 31 provided the other information needed for the month of March:
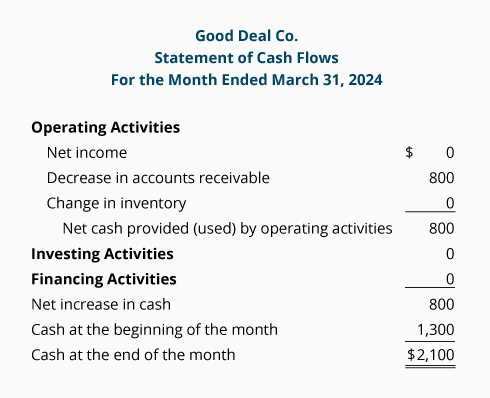
Let's review the cash flow statement for the month of March 2016:
- Net income for March is $0, since there were no revenues, gains, expenses, or losses.
- Cash increased by $800 because $800 of accounts receivable were collected during March.
- Inventory did not change, so Cash was not affected. (We could omit this line since it had no effect on cash.)
- There were no changes in long-term assets during March, so nothing is reported in the investing activities section.
- There were no changes in long-term liabilities or owner's equity; hence, nothing is reported in the financing activities section.
- The summation of the amounts on the statement of cash flows is a positive $800. This amount agrees to the increase in the Cash account balance from $1,300 on February 28 to $2,100 on March 31.
Whether you are a business person or student of business, our Master Set of 87 Business Forms will assist you in preparing financial statements, financial ratios, break-even calculations, depreciation, standard
April Transactions and Financial Statements
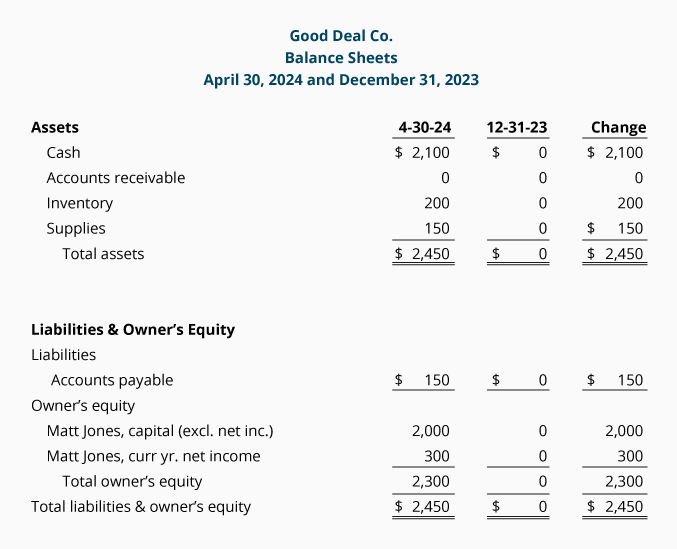
On April 28 Good Deal orders $150 of supplies on account. The supplies arrive on April 30 along with an invoice showing that the full $150 is due by May 30. None of the supplies were used in April. This was the only transaction during April.Matt prepared the following financial statements for Good Deal Co. as of April 30:
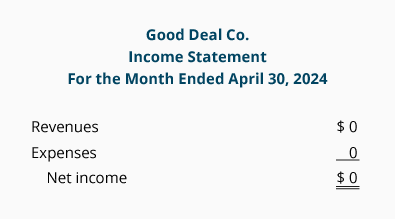
Since no supplies were used in April, there is no change to the Supplies Expense account. The $150 is reported on the balance sheet in the asset account Supplies.
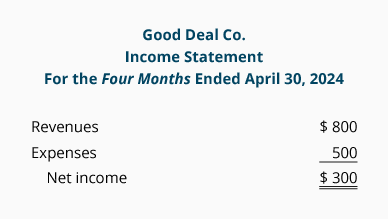
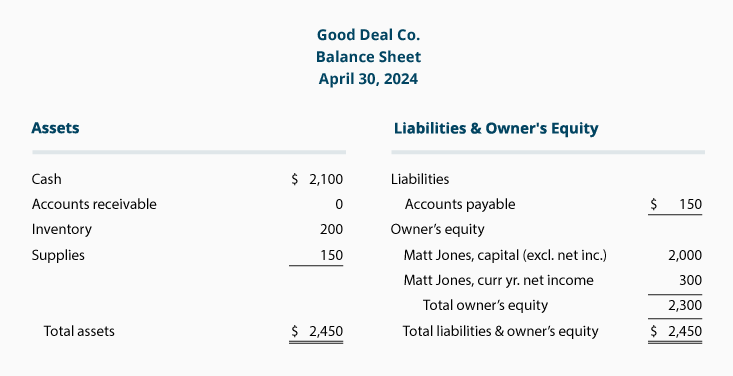
As you can see from the balance sheet the company added assets of $150 (Supplies) and added its first liability of $150 (Accounts Payable).
A balance sheet comparing April 30 to March 31 and the resulting differences or changes is shown below:
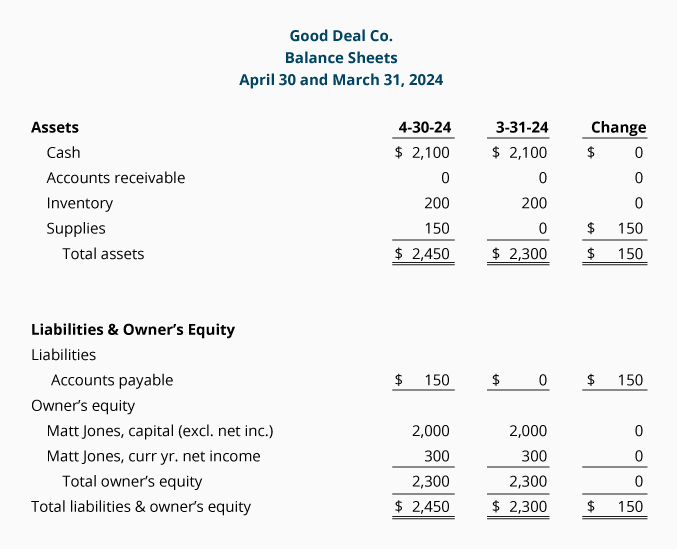
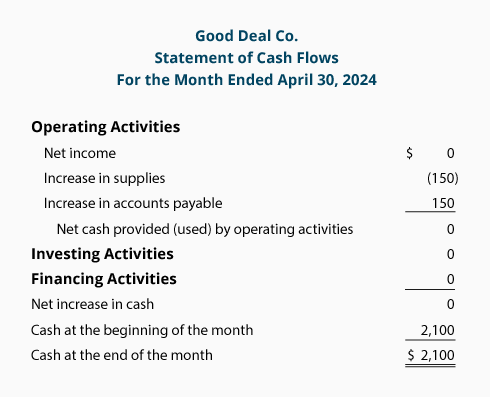
The cash flow statement for the month of April reports that there was no change in the Cash account from March 31 through April 30. The operating activities section reports the increase in Supplies, but also reports the increase in Accounts Payable.
Here's a Tip
On the statement of cash flows, think of the positive amounts (the numbers not in parentheses) as good for your cash balance. For example, if you don't pay your bills, that's good for your cash balance (but bad for the liability Accounts Payable which increases).Think of the negative amounts (the numbers within parentheses) as not good for cash. For example, if you pay a bill, that's not good for your cash balance (but good for the liability Accounts Payable which decreases).
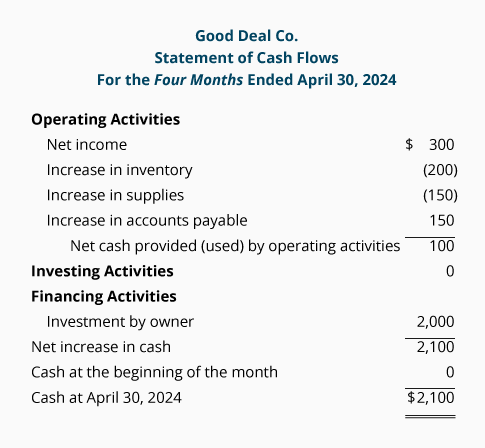
Let's review the statement of cash flows for the four months ended April 30:
- The operating activities section of the cash flow statement starts with the net income of $300 for the four-month period. The increase in Inventory is not good for cash, as shown by the negative $200. Similarly, the increase in Supplies is not good for cash and it is reported as a negative $150. The increase in Accounts Payable is good for cash (since some bills were not paid) so the increase in the liability account is a positive $150. Combining the amounts, the net change in cash that is explained by operating activities is a positive $100.
- There were no changes in long-term assets, hence no cash was involved in investing activities.
- There were no changes in long-term liabilities. There was a change in owner's equity since December 31, and as a result the financing activities section reports the owner's investment in Good Deal Co.
- Combining the operating, investing, and financing activities, the cash flow statement reports a change in cash of $2,100. This agrees with the change in the Cash account from $0 on December 31, 2015 to $2,100 on April 30, 2016.
May Transactions and Financial Statements
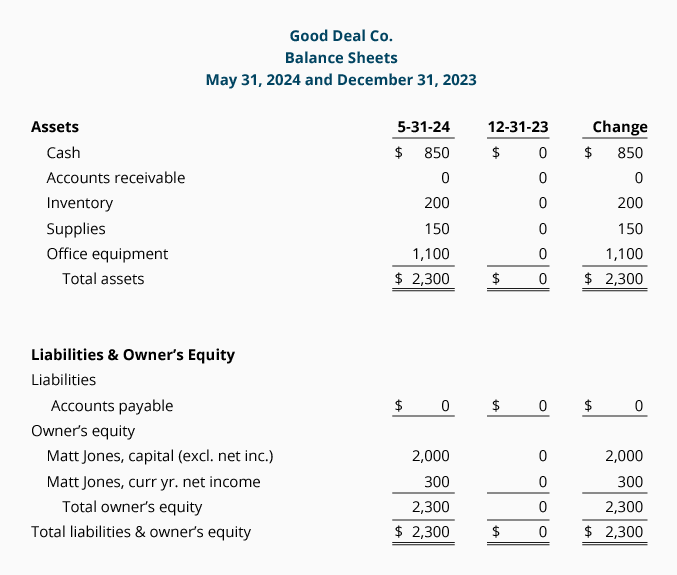
On May 30 Good Deal pays its accounts payable of $150. On May 31 Good Deal purchases office equipment (a new computer and printer) that will be used exclusively in the business. The cost of the office equipment is $1,100 and is paid for in cash. The equipment is put into service on May 31. There were no other transactions in May.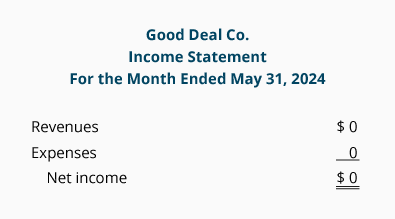
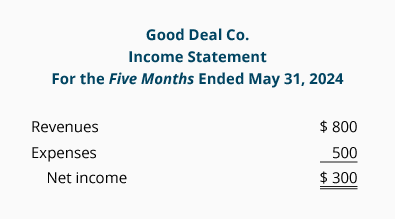
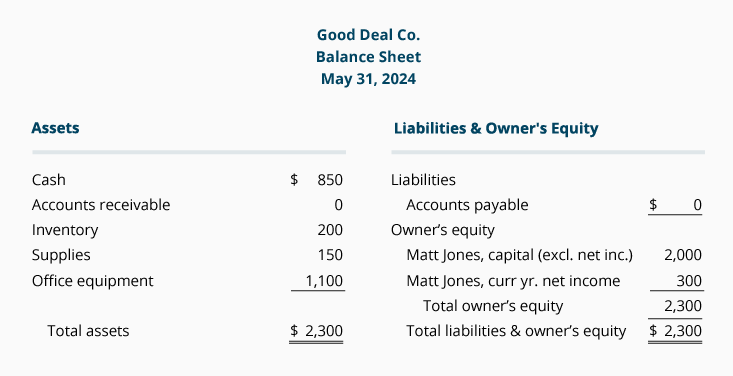
A balance sheet comparing May 31 to April 30 and the resulting differences or changes is shown below:
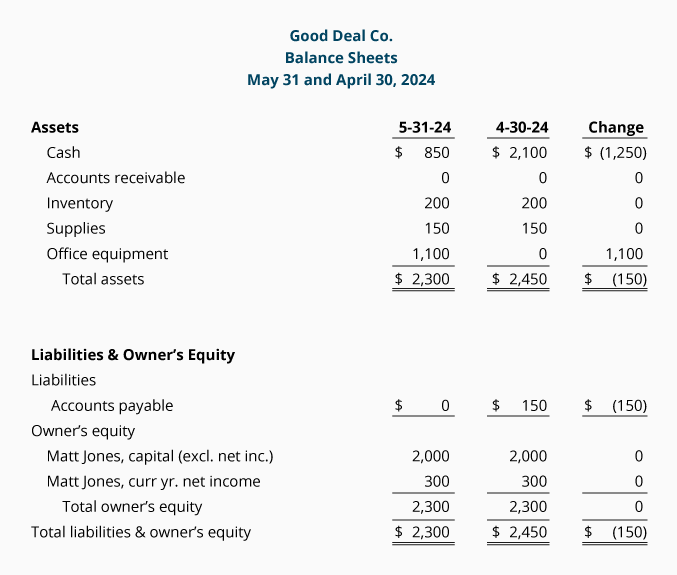
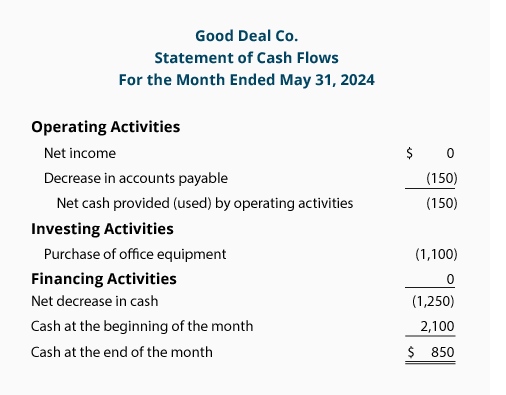
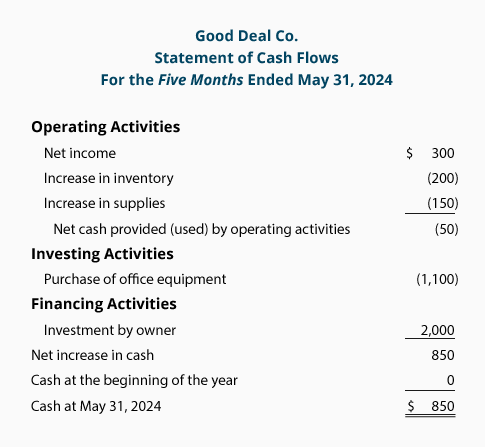
Let's review the cash flow statement for the five months ended May 31:
- The operating activities section starts with the net income of $300 for the five-month period. The increase in Inventory is not good for cash, as shown by the negative $200. Similarly, the increase in Supplies is not good for cash and it is reported as a negative $150. Combining the amounts, the net change in cash that is explained by operating activities is a negative $50.
- The increase in long-term assets is reported under investing activities.
- There were no changes in long-term liabilities. There was a change in owner's equity since December 31, and as a result the financing activities section of the cash flow statement reports the owner's investment into the Good Deal Co.
- Combining the operating, investing, and financing activities, the statement of cash flows reports an increase in cash of $850. This agrees with the change in the Cash account as shown on the balance sheets from December 31, 2015 (or January 1, 2016) and May 31, 2016.
Whether you are a business person or student of business, our Master Set of 87 Business Forms will assist you in preparing financial statements, financial ratios, break-even calculations, depreciation, standard cost variances, and more.
Depreciation Expense
Depreciation moves the cost of an asset to Depreciation Expense during the asset's useful life. The accounts involved in recording depreciation are Depreciation Expense and Accumulated Depreciation. As you can see, cash is not involved. In other words, depreciation reduces net income on the income statement, but it does not reduce the Cash account on the balance sheet.Because we begin preparing the statement of cash flows using the net income figure taken from the income statement, we need to adjust the net income figure so that it is not reduced by Depreciation Expense. To do this, we add back the amount of the Depreciation Expense.
Depletion Expense and Amortization Expense are accounts similar to Depreciation Expense, as all three involve allocating the cost of a long-term asset to an expense over the useful life of the asset. There is no cash involved.
Here's a Tip
In the operating activities section of the cash flow statement, add back expenses that did not require the use of cash. Examples are depreciation, depletion, and amortization expense.June Transactions and Financial Statements
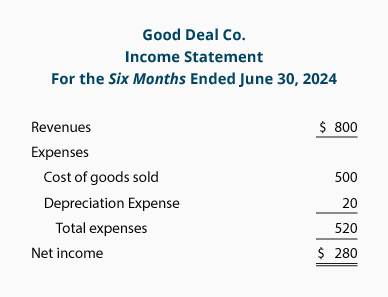
The only transaction recorded by Good Deal during June was the depreciation on the office equipment. Recall that on May 31 Good Deal purchased the office equipment (a new computer and printer) for $1,100 and it was put into service on the same day. Let's assume that a depreciation expense of $20 per month is recorded by Good Deal. As a result, Good Deal's financial statements at June 30 will be as follows: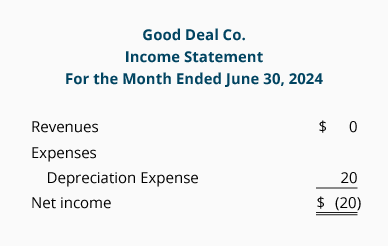
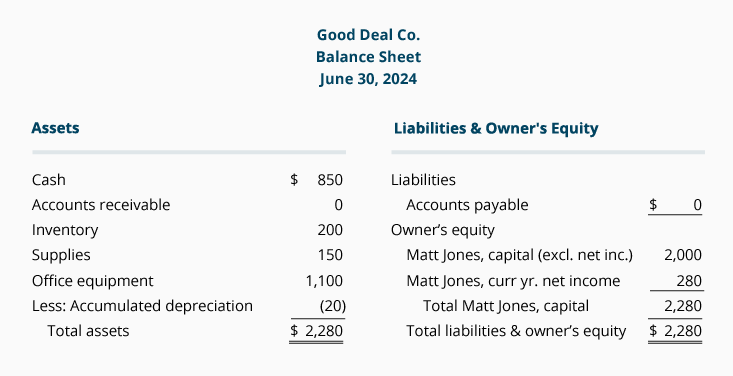
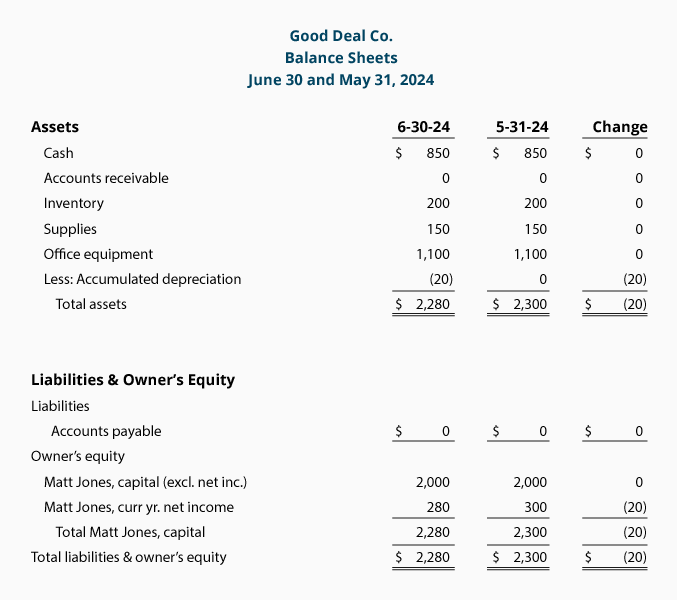
A balance sheet comparing June 30 to May 31 and the resulting differences or changes is shown below:
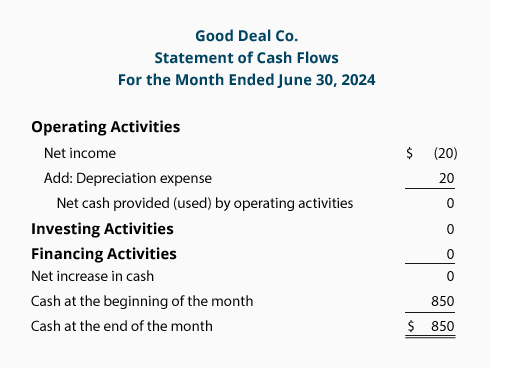
The cash flow statement for the month of June illustrates why depreciation expense needs to be added back to net income. Good Deal did not spend any cash in June, however, the entry in the Depreciation Expense account resulted in a net loss on the income statement. To convert the bottom line of the income statement (a loss of $20) to the amount of cash provided or used in operating activities ($0) we need to add back or remove the depreciation expense amount.
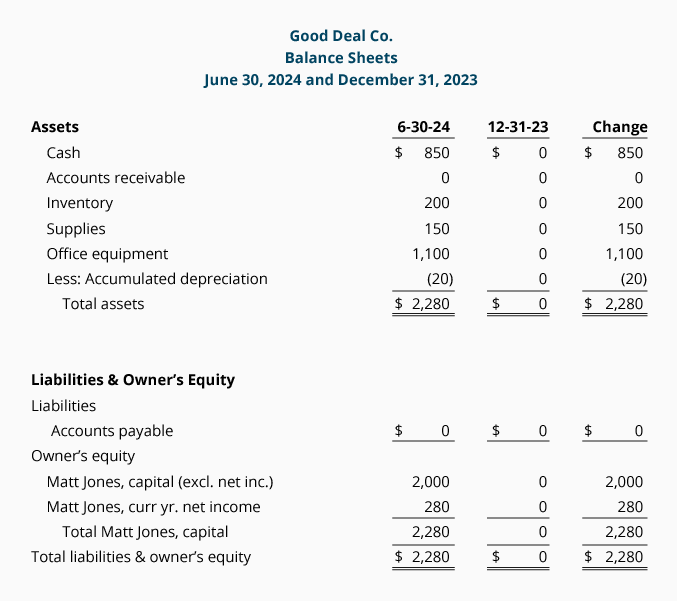
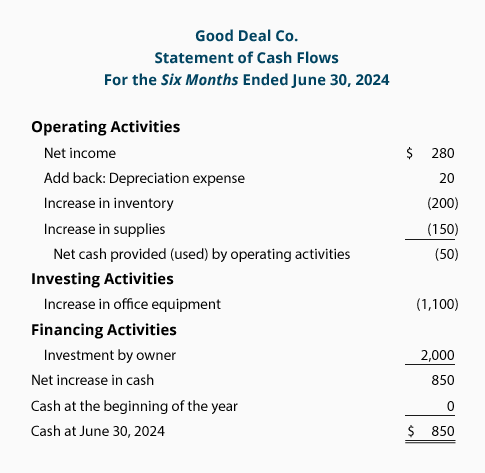
Let's review the cash flow statement for the six months ended June 30:
- The operating activities section starts with the net income of $280 for the six-month period. Depreciation expense is added back to net income because it was a noncash transaction (net income was reduced, but there was no cash spent on depreciation). The increase in the Inventory account is not good for cash, as shown by the negative $200. Similarly, the increase in Supplies is not good for cash and it is reported as a negative $150. Combining the amounts, the net change in cash that is explained by operating activities is a negative $50.
- The increase in long-term assets caused a cash outflow of $1,100 which is reported in the investing activities section.
- There were no changes in long-term liabilities. There was a change in owner's equity since December 31, and as a result the financing activities section reports the owner's $2,000 investment into the Good Deal Co.
- Combining the operating, investing, and financing activities, the statement of cash flows reports an increase in cash of $850. This agrees with the change in the Cash account as shown on the balance sheets from December 31, 2015 and June 30, 2016.
Disposal of Assets
If a company disposes of (sells) a long-term asset for an amount different from its recorded amount in the company's accounting records (its book value), an adjustment must be made to net income on the cash flow statement.For example, let's say a company sells one of its delivery trucks for $3,000. That truck is shown on the company records at its original cost of $20,000 less accumulated depreciation of $18,000. When these two amounts are combined ("netted together") the net amount is known as the book value (or the carrying value) of the asset. In the example, the book value of the truck is $2,000 ($20,000 - $18,000).
Because the proceeds from the sale of the truck are $3,000 and the book value is $2,000 the difference of $1,000 is recorded in the account Gain on Sale of Truck—an income statement account. The transaction has the effect of increasing the company's net income. If the truck had sold for $1,500 ($500 less than its $2,000 book value), the difference of $500 would be reported in the account Loss on Sale of Truck and would reduce the company's net income.
One of the rules in preparing a statement of cash flows is that the entire proceeds received from the sale of a long-term asset must be reported in the second section of the statement, the investing activities section. This presents a problem because any gain or loss on the sale of an asset is also included in the company's net income which is reported in the first section—operating activities. To avoid double counting, each gain is deducted from net income and each loss is added to net income in the operating activities section of the cash flow statement.
Let's illustrate this by returning to Good Deal Co.'s activities.
July Transactions and Financial Statements
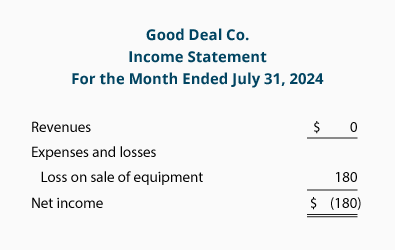
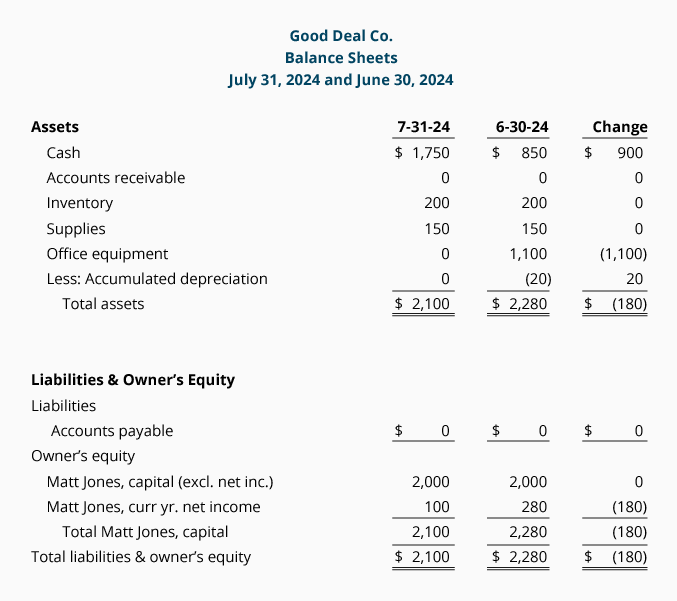
On July 1 Matt decides that his company no longer needs its office equipment. Good Deal used the equipment for one month (May 31 through June 30) and had recorded one month's depreciation of $20. This means the book value of the equipment is $1,080 (the original cost of $1,100 less the $20 of accumulated depreciation). On July 1 Good Deal sells the equipment for $900 in cash and records a loss of $180 in the account Loss on Sale of Equipment on its income statement. There were no other transactions in July.The income statement and the statement of cash flows for the month of July illustrate how the disposal of the equipment is reported:
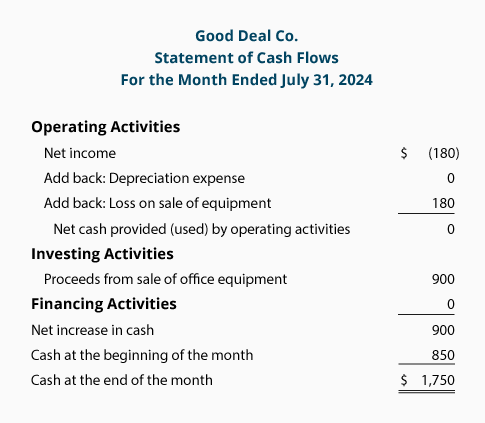
Let's review the cash flow statement for the month of July 2016:
- Net income for July was a net loss of $180. There were no revenues, expenses, or gains, but there was an entry of $180 in the account Loss on Sale of Equipment.
- There was no depreciation expense in July, and current assets and current liabilities did not change in July, so cash was not affected. (We could have omitted the line "Depreciation Expense".)
- There was no cash provided or used by operating activities.
- Good Deal received $900 from the sale of its office equipment.
- There was no change in long-term liabilities or owner's equity during July (other than the $180 loss on sale of equipment).
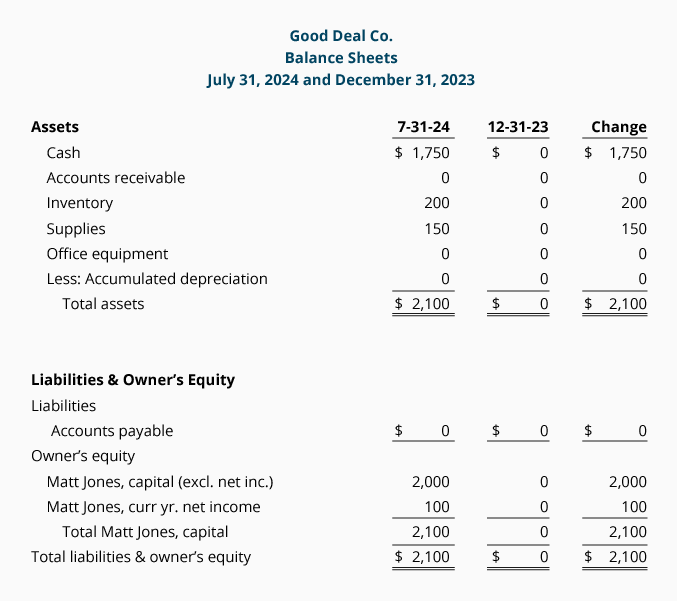
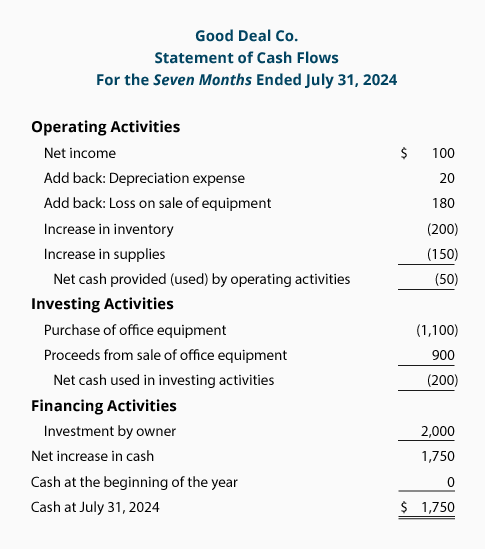
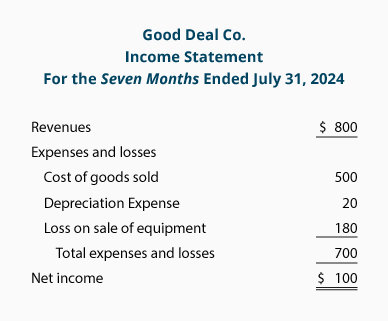
Let's review the cash flow statement for the seven months of January through July 2016:
- Net income for the seven months is $100. This includes revenues, gains, expenses, and losses.
- Included in the net income for the seven months is $20 of depreciation expense. This expense reduced net income but did not reduce the Cash account; therefore we add the $20 depreciation expense to the net income.
- Also included in net income is the $180 entry into the Loss on Sale of Equipment account. This loss was reported on the income statement thereby reducing net income but not reducing cash. (The cash received from the sale of the equipment appears in its entirety under the investing activities section of the cash flow statement.)
- Inventory on July 31 is $200 (4 calculators at a cost of $50 each). Since the company began with no inventory, this increase in the Inventory account means that $200 of cash was used to increase inventory.
- Supplies increased from none to $150. The increase in the Supplies account is assumed to have had a negative effect of $150 on the Cash account.
- Combining the amounts so far, we see that the cash from operating activities is a negative $50. In other words, rather than providing cash, the operating activities used $50 of cash.
- There is cash outflow (or payment) of $1,100 to purchase the office equipment on May 31 and the $900 of cash inflow (or receipt) from the sale of the office equipment on July 1. Combining these two amounts results in the net outflow ("cash used in investing activities") of $200.
- There was an owner's investment of $2,000 made on January 2.
Download More Sample Statements of Cash Flows
Whether you are a business person or student of business, our Master Set of 87 Business Forms will assist you in preparing financial statements, financial ratios, break-even calculations, depreciation, standard cost variances, and more.
XXX . V00 How to Read a Balance Sheet
what is a balance sheet and what does a balance sheet show? At it’s simplest, a balance sheet shows what assets your company controls and who owns them. And if you’re concerned with not bankrupting your new store (“I TOLD you selling piranhas online would never work!”), it’s a pretty important statement to understand.
Fortunately, it’s not too difficult to grasp if you’re willing to learn a few key concepts. So let’s dive in!
Anatomy of a Balance Sheet
Unlike the income statement which shows how a company performed over a period of time, a balance sheet shows a business’ financial health at a single point in time. This will take the form of an exact date, like 9/30/2013 for example, and is usually prepared at a month or quarter’s end.The balance sheet lets you know exactly what things of value a company controls (assets) and who owns those assets: someone else (liabilities) or the business owner (owner’s equity). Revisiting our friend Phil from last time, you can see the balance sheet for his business The Parachute Palace below:

Assets
An asset is anything of value your business controls, regardless of who owns it. Cash, office equipment (computers, chairs, etc) and inventory are all considered assets. So are accounts receivable, which represents people who owe you money but haven’t yet paid.This is an important enough concept to repeat: the financial ownership doesn’t matter. If something is in possession of a company, it’s considered an asset.
Did your business manager go out and borrow $60,000 to 100% finance a new Escalade for sales calls? The car may be entirely owned by the bank (and causing Dave Ramsey to cry), but it’s still an asset as far as the balance sheet is concerned.
Liabilities
Liabilities are debts you owe to other people. This could be a credit card balance, payment owed to suppliers who offer you 30 or 60 day payment terms or long-term debt – like the loan on that new Escalade.Any debts or future financial obligations you have to pay should be listed in the liabilities section.
Owner’s Equity
Owner’s equity represents the portion of the business assets that you own free and clear. Think of it this way: if you liquidated all of your assets and then paid off all the debts you owed, the amount left over would be your “owner’s equity”.It’s important to understand that owner’s equity is NOT necessarily how much the business is worth in a sale. Because businesses usually sell based on a multiple of their earnings, the value of a business will usually (but not always) be greater than the owner’s equity value (also called “book value”).
The Balance Sheet Equation
The balance sheet is so named because the two sides of the balance sheet ALWAYS add up to the same amount. The balance sheet is separated with assets on one side and liabilities and owner’s equity on the other.This one unbreakable balance sheet formula is always, always true: Assets = Liabilities + Owner’s Equity.

In our balance sheet from above, you can see that this holds true:

At first, this rule can be really confusing. But think of it this way. All the assets owned by a business fall into one of two categories. They’re either owned by a creditor (you had to take a loan to get them) or they’re owned by you (you paid for them in full). That’s pretty much all the balance sheet equation is saying!
The Home Mortgage Example
Let’s use a simple balance sheet example that you’re probably familiar with – a home mortgage. Assume you recently purchased a home worth $250,000. With the financial carnage of 2008 fresh in your mind, you put down a healthy 20% down payment of $50,000 and took out a loan for the remainder of the balance of $200,000.What would your balance sheet look like in terms of assets, owner’s equity and liabilities?
The asset column would be the value of the home, regardless of who owns it. So in this case, the value of the home is $250,000. Assets = $250,000. Our liabilities – the amount we owe to someone else – is the value of the loan. This is what we’re financially obligated to pay to someone else. So liabilities = $200,000.
Let’s go back to our universal balance sheet formula: Assets = Liabilities + Owner’s Equity
Inserting our values, we get:
$250,000 (Assets) = $200,000 (Liabilities) + Owner’s Equity
At this point, you can compute owner’s equity one of two ways. You can either do some simple algebra and solve for the equity figure. Or you can go back and recognize that we put down $50,000 of our own money. So that would be the portion of the home we own and which represents the owner’s equity.
$250,000 (Assets) = $200,000 (Liabilities) + $50,000 (Equity)
You’ve probably done this in your head before and never realized it was an accounting balance sheet at work!
And Then Come the Boars (Sorry, What?)

As I’ve mentioned repeatedly now, the rules of the accounting universe decree that a balance sheet ALWAYS must balance. So what happens a year down the road when some wild boar trainers and their 20 filthy animals move in next door and reduce the value of your property by $30,000? (A common occurrence, I’ve heard.)
Let’s tackle the asset side first. Because the market value of the home has gone down by $30,000, we’ll reduce the asset side by that amount – from $250K to $220K:
$220,000 (Assets) = $200,000 (Liabilities) + $50,000 (Equity)
But now we’re in trouble as our balance sheet equation doesn’t balance. We’ll need to adjust either liabilities or equity to get things right.
Disregarding the small amount you’ve paid off your loan, let’s assume it’s still $200,000 – so this part hasn’t changed. So we’ll need to adjust the equity portion to balance the equation:
$220,000 (Assets) = $200,000 (Liabilities) + Equity
Equity = $20,000, so…
$220,000 (Assets) = $200,000 (Liabilities) + $20,000 (Equity)
Ouch – a $30,000 direct hit to the equity you had in the house! If you think this simple balance sheet example may be a bit far fetched, perhaps we should do something that’s more business related and less boorish (Pun 100% intended. Please don’t stop reading).
Purchasing a Sweet New Ride
Unfortunately, business for Phil at the Parachute Palace isn’t going very well. He had a few quality control issues with the parachutes and people haven’t been buying because of it.Improving the quality of the products would be too much work (obviously) so he hatches another plan. Instead, he decides to finance a brand new $45,000 BMW to make it look like his parachutes are selling like hotcakes and hopefully increase confidence in the business.
Let’s tackle the asset side of the accounting balance sheet first. Because the car is valued at $45,000, we’ll add this amount to the assets side under the account “Vehicles”. But this leaves our balance sheet unbalanced as you can see below:
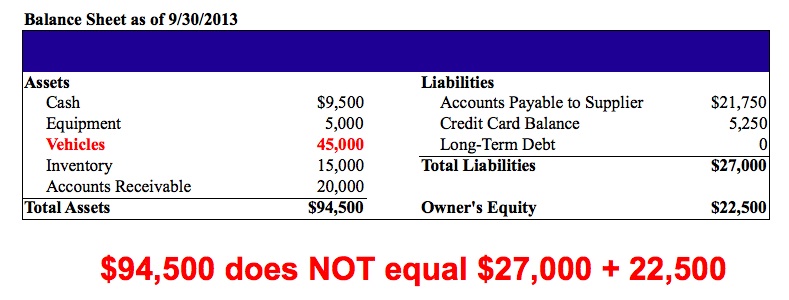
The way to fix it? We need to add the outstanding debt to the liabilities side, as seen below. Again, the assets of the business increase by $45,000 – but there’s no change in the amount of equity the business owner has. The entire amount was added to liabilities.

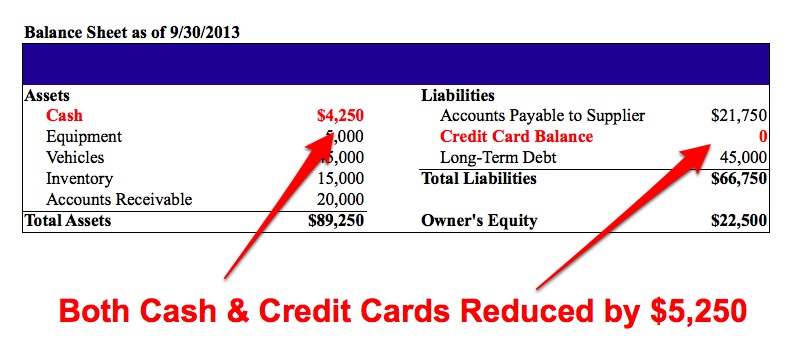
Let’s explore one more example. Realizing the error of his free spending ways, Phil resolves to start being more financially prudent and decides to pay off the business’ outstanding credit card debt, which is listed under liabilities.
For things to balance, we’ll need to make an adjustment to both sides of the balance sheet. Care to take a stab at which account on the asset side needs to be changed if he’ll be paying off the credit cards?
 Happen to guess cash? If so, you’d be right. To pay off the credit card balance, Phil will need to pull the funds from his cash account. Because the credit card balance is at $5,250 both the cash and credit card accounts are reduced by this amount.
Notice that even though Phil’s cash levels decreased by over $5,000, the owner’s equity value of the business didn’t change. The payment simply decreased funds from the asset side (cash) to pay off a liability (the credit card) with no effect to the amount of equity Phil had in the business.
That’s the Basics….
There’s plenty more to the balance sheet, but I’ll spare you the gory details of shareholder distributions, accumulated deprecation and retained earnings that make accountants howl with delight. But using the concepts we covered, you should be able to make sense of most balance sheets you come across.
XXX . V000 Reading the Balance Sheet
A balance sheet, also known as a "statement of financial position," reveals a company's assets, liabilities and owners' equity (net worth). The balance sheet, together with the income statement and cash flow statement, make up the cornerstone of any company's financial statements. If you are a shareholder of a company, it is important that you understand how the balance sheet is structured, how to analyze it, and how to read it.
How the Balance Sheet Works
The balance sheet is divided into two parts that, based on the following equation, must equal each other or balance each other out. The main formula behind balance sheets is:| Assets = Liabilities + Shareholders' Equity |
Assets are what a company uses to operate its business, while its liabilities and equity are two sources that support these assets. Owners' equity, referred to as shareholders' equity in a publicly traded company, is the amount of money initially invested into the company plus any retained earnings and it represents a source of funding for the business.
It is important to note that a balance sheet is a snapshot of the company's financial position at a single point in time.
Know the Types of Assets
Current Assets
Current assets have a life span of one year or less, meaning they can be converted easily into cash. Such assets classes include cash and cash equivalents, accounts receivable, and inventory. Cash, the most fundamental of current assets, also includes non-restricted bank accounts and checks. Cash equivalents are very safe assets that can be readily converted into cash; U.S. Treasuries are one such example. Accounts receivables consist of the short-term obligations owed to the company by its clients. Companies often sell products or services to customers on credit; these obligations are held in the current assets account until they are paid off by the clients.Lastly, inventory represents the raw materials, work-in-progress goods, and the company's finished goods. Depending on the company, the exact makeup of the inventory account will differ. For example, a manufacturing firm will carry a large amount of raw materials, while a retail firm carries none. The make-up of a retailer's inventory typically consists of goods purchased from manufacturers and wholesalers.
Non-Current Assets
Non-current assets are assets that are not turned into cash easily, are expected to be turned into cash within a year, and/or have a lifespan of more than a year. They can refer to tangible assets such as machinery, computers, buildings, and land. Non-current assets also can be intangible assets such as goodwill, patents or copyright. While these assets are not physical in nature, they are often the resources that can make or break a company – the value of a brand name, for instance, should not be underestimated.
Depreciation is calculated and deducted from most of these assets,
, which represents the economic cost of the asset over its useful life.
Learn the Different Liabilities
On the other side of the balance sheet are the liabilities. These are the financial obligations a company owes to outside parties. Like assets, they can be both current and long-term. Long-term liabilities are debts and other non-debt financial obligations, which are due after a period of at least one year from the date of the balance sheet. Current liabilities are the company's liabilities that will come due, or must be paid, within one year. This includes both shorter-term borrowings, such as accounts payables, along with the current portion of longer-term borrowing, such as the latest interest payment on a 10-year loan.Shareholders' Equity
Shareholders' equity is the initial amount of money invested into a business. If, at the end of the fiscal year, a company decides to reinvest its net earnings into the company (after taxes), these retained earnings will be transferred from the income statement onto the balance sheet and into the shareholder's equity account. This account represents a company's total net worth. In order for the balance sheet to balance, total assets on one side have to equal total liabilities plus shareholders' equity on the other.Read the Balance Sheet
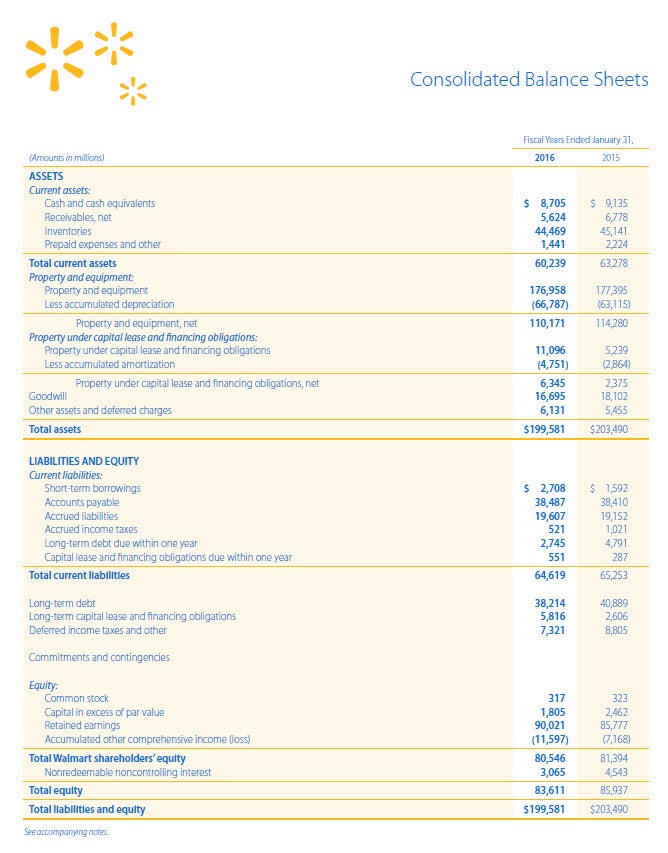
As you can see from the balance sheet above, it is broken into two areas. Assets are on the top, and below them are the company's liabilities and shareholders' equity. It is also clear that this balance sheet is in balance where the value of the assets equals the combined value of the liabilities and shareholders' equity. Another interesting aspect of the balance sheet is how it is organized. The assets and liabilities sections of the balance sheet are organized by how current the account is. So for the asset side, the accounts are classified typically from most liquid to least liquid. For the liabilities side, the accounts are organized from short to long-term borrowings and other obligations.
Analyze the Balance Sheet with Ratios
With a greater understanding of the balance sheet and how it is constructed, we can look now at some techniques used to analyze the information contained within the balance sheet. The main way this is done is through financial ratio analysis.Financial ratio analysis uses formulas to gain insight into the company and its operations. For the balance sheet, using financial ratios (like the debt-to-equity ratio) can show you a better idea of the company's financial condition along with its operational efficiency. It is important to note that some ratios will need information from more than one financial statement, such as from the balance sheet and the income statement.
The main types of ratios that use information from the balance sheet are financial strength ratios and activity ratios. Financial strength ratios, such as the working capital and debt-to-equity ratios, provide information on how well the company can meet its obligations
and how the obligations are leveraged.
This can give investors an idea of how financially stable the company is and how the company finances itself. Activity ratios focus mainly on current accounts to show how well the company manages its operating cycle (which include receivables, inventory and payables). These ratios can provide insight into the company's operational efficiency.
SEE: Ratio Tutorial
The Bottom Line
The balance sheet, along with the income and cash flow statements, is an important tool for investors to gain insight into a company and its operations. The balance sheet is a snapshot at a single point in time of the company's accounts – covering its assets, liabilities and shareholders' equity. The purpose of the balance sheet is to give users an idea of the company's financial position along with displaying what the company owns and owes. It is important that all investors know how to use, analyze and read this document.XXX . V0000 Balance sheet
The balance sheet is a report that summarizes all of an entity's assets, liabilities, and equity as of a given point in time. It is typically used by lenders, investors, and creditors to estimate the liquidity of a business. The balance sheet is one of the documents included in an entity's financial statements. Of the financial statements, the balance sheet is stated as of the end of the reporting period, while the income statement and statement of cash flows cover the entire reporting period.
Typical line items included in the balance sheet (by general category) are:
The total amount of assets listed on the balance sheet should always equal the total of all liabilities and equity accounts listed on the balance sheet (also known as the accounting equation). If this is not the case, a balance sheet is considered to be unbalanced, and should not be issued until the underlying accounting recordation error causing the imbalance has been located and corrected.
Similar Terms
The balance sheet is also known as the statement of financial position.
Typical line items included in the balance sheet (by general category) are:
- Assets: Cash, marketable securities, prepaid expenses, accounts receivable, inventory, and fixed assets
- Liabilities: Accounts payable, accrued liabilities, taxes payable, short-term debt, and long-term debt
- Shareholders' equity: Stock, retained earnings, and treasury stock
The total amount of assets listed on the balance sheet should always equal the total of all liabilities and equity accounts listed on the balance sheet (also known as the accounting equation). If this is not the case, a balance sheet is considered to be unbalanced, and should not be issued until the underlying accounting recordation error causing the imbalance has been located and corrected.
Similar Terms
The balance sheet is also known as the statement of financial position.
Expected rate of return
The expected rate of return is the return on investment that an investor anticipates receiving. It is calculated by estimating the probability of a full range of returns on an investment, with the probabilities summing to 100%. For example, an investor is contemplating making a risky $100,000 investment, where there is a 25% chance of receiving no return at all. There is also a 50% probability of generating a $10,000 return, and a 25% chance that the investment will create a $50,000 return. Based on this information, the expected rate of return is:
$0 return x 25% = $0 return
$10,000 return x 50% = $5,000
$50,000 return x 25% = $12,500
The investor then sums these projections to arrive at an expected rate of return of $17,500, or 17.5%, which is calculated as:
$17,500 sum of returns ÷ $100,000 investment = 17.5% expected rate of return
Since the probabilities used in these projections are qualitative in nature, it is quite possible that two people using the same information will come up with different probability percentages, and therefore different rates of return. This is especially the case when the individuals use historical information as the basis for their projections; historical results do not necessarily translate into future results.Preaudit
A preaudit is preliminary work conducted by an auditor, prior to the scheduled start date of an audit. The intent of a preaudit is to gather preliminary information about the client, which can be used to highlight any areas that may require special attention during the audit. The findings from the preaudit are then considered when deriving the budget for the audit. For example, if preaudit work finds that a client has large amounts of its inventory held on consignment by third parties, this information can be used to add an audit step to ask for confirmations from the third parties.
A preaudit is designed to involve a relatively small amount of time by the auditor. Consequently, it may only involve sending a standard questionnaire to the client, which may then lead to a phone conversation to expand upon any unusual points raised on the questionnaire. It is also possible that the auditor will travel to the client to interview the controller and others on the management team
Financial statement audit
A financial statement audit is the examination of an entity's financial statements and accompanying disclosures by an independent auditor. The result of this examination is a report by the auditor, attesting to the fairness of presentation of the financial statements and related disclosures. The auditor's report must accompany the financial statements when they are issued to the intended recipients.
The purpose of a financial statement audit is to add credibility to the reported financial position and performance of a business. The Securities and Exchange Commission requires that all entities that are publicly held must file annual reports with it that are audited. Similarly, lenders typically require an audit of the financial statements of any entity to which they lend funds. Suppliers may also require audited financial statements before they will be willing to extend trade credit (though usually only when the amount of requested credit is substantial).
Audits have become increasingly common as the complexity of the two primary accounting frameworks, Generally Accepted Accounting Principles and International Financial Reporting Standards, have increased, and because there have been an ongoing series of disclosures of fraudulent reporting by major companies.
The primary stages of an audit are:
1. Planning and risk assessment. Involves gaining an understanding of the business and the business environment in which it operates, and using this information to assess whether there may be risks that could impact the financial statements.
2. Internal controls testing. Involves the assessment of the effectiveness of an entity's suite of controls, concentrating on such areas as proper authorization, the safeguarding of assets, and the segregation of duties. This can involve an array of tests conducted on a sampling of transactions to determine the degree of control effectiveness. A high level of effectiveness allows the auditors to scale back some of their later audit procedures. If the controls are ineffective (i.e., there is a high risk of material misstatement), then the auditors must use other procedures to examine the financial statements. There are a variety of risk assessment questionnaires available that can assist with internal controls testing.
3. Substantive procedures. Involves a broad array of procedures, of which a small sampling are:
Audits are more expensive for publicly-held firms, for auditors must adhere to the stricter audit standards of the Public Company Accounting Oversight Board (PCAOB), and so will pass their increased costs through to their clients.
The purpose of a financial statement audit is to add credibility to the reported financial position and performance of a business. The Securities and Exchange Commission requires that all entities that are publicly held must file annual reports with it that are audited. Similarly, lenders typically require an audit of the financial statements of any entity to which they lend funds. Suppliers may also require audited financial statements before they will be willing to extend trade credit (though usually only when the amount of requested credit is substantial).
Audits have become increasingly common as the complexity of the two primary accounting frameworks, Generally Accepted Accounting Principles and International Financial Reporting Standards, have increased, and because there have been an ongoing series of disclosures of fraudulent reporting by major companies.
The primary stages of an audit are:
1. Planning and risk assessment. Involves gaining an understanding of the business and the business environment in which it operates, and using this information to assess whether there may be risks that could impact the financial statements.
2. Internal controls testing. Involves the assessment of the effectiveness of an entity's suite of controls, concentrating on such areas as proper authorization, the safeguarding of assets, and the segregation of duties. This can involve an array of tests conducted on a sampling of transactions to determine the degree of control effectiveness. A high level of effectiveness allows the auditors to scale back some of their later audit procedures. If the controls are ineffective (i.e., there is a high risk of material misstatement), then the auditors must use other procedures to examine the financial statements. There are a variety of risk assessment questionnaires available that can assist with internal controls testing.
3. Substantive procedures. Involves a broad array of procedures, of which a small sampling are:
- Analysis. Conduct a ratio comparison with historical, forecasted, and industry results to spot anomalies.
- Cash. Review bank reconciliations, count on-hand cash, confirm restrictions on bank balances, issue bank confirmations.
- Marketable securities. Confirm securities, review subsequent transactions, verify market value.
- Accounts receivable. Confirm account balances, investigate subsequent collections, test year-end sales and cutoff procedures.
- Inventory. Observe the physical inventory count, obtain confirmation of inventories held at other locations, test shipping and receiving cutoff procedures, examine paid supplier invoices, test the computation of allocated overhead, review current production costs, trace compiled inventory costs to the general ledger.
- Fixed assets. Observe assets, review purchase and disposal authorizations, review lease documents, examine appraisal reports, recalculate depreciation and amortization.
- Accounts payable. Confirm accounts, test year-end cutoff.
- Accrued expenses. Examine subsequent payments, compare balances to prior years, recompute accruals.
- Debt. Confirm with lenders, review lease agreements, review references in board of directors minutes.
- Revenue. Examine documents supporting a selection of sales, review subsequent transactions, recalculate percentage of completion computations, review the history of sales returns and allowances.
- Expenses. Examine documents supporting a selection of expenses, review subsequent transactions, confirm unusual items with suppliers.
Audits are more expensive for publicly-held firms, for auditors must adhere to the stricter audit standards of the Public Company Accounting Oversight Board (PCAOB), and so will pass their increased costs through to their clients.
A Closer Look at the Fed’s Balance Sheet Accounting
An earlier post on how the Fed changes the size of its balance sheet prompted several questions from readers about the Federal Reserve’s accounting of asset purchases and the payment of principal by the Treasury on Treasury securities owned by the Fed. In this post, we provide a more detailed explanation of the accounting rules that govern these transactions.
Overview of the Federal Reserve System
It is useful to start with an overview of the Federal Reserve System. The System is decentralized and consists of three key entities: (1) The Board of Governors of the Federal Reserve System (the Fed’s central governing board); (2) twelve Federal Reserve Banks (through which the System operates); and (3) the Federal Open Market Committee (the FOMC, which sets U.S. monetary policy and consists of members of the Board of Governors and some Reserve Bank presidents).
As the operating arms of the System, the Reserve Banks hold the System’s assets, liabilities, and capital. Accordingly, the Federal Reserve’s balance sheet actually represents the accounts and results of operations of the Reserve Banks—their combined and individual statements of condition are reported weekly in tables 5 and 6 in the H.4.1 statistical release and in annual audited financial statements of the Federal Reserve System.
Federal Reserve Purchases of Treasury Securities
Reserve Banks are authorized to purchase Treasury securities in the open market (the secondary market) under the terms of Section 14 of the Federal Reserve Act and at the direction of the FOMC. The FOMC has selected the Federal Reserve Bank of New York to execute open market operations. The securities acquired are then allocated across the Reserve Banks.
When a Reserve Bank purchases a Treasury security, it purchases an asset, typically from a bank or broker-dealer. It credits reserves (a liability of the Fed) to the reserve account of the seller (or the seller’s bank). The bank or broker-dealer may sell its own securities or may act as an agent on behalf of a client. As a holder of a Treasury security, a Reserve Bank has no special rights relative to other Treasury-holding entities. The Treasury security that the Fed has purchased is not “paid in full.” It remains an asset on the Fed’s balance sheet until the security matures or is redeemed by the Treasury in accordance with the terms of issuance.
The Relationship between the Fed and the Treasury
As the nation’s central bank, the Fed plays a number of important public policy roles, and monetary policy does indeed have fiscal implications. In trying to understand the effects of the Fed’s actions on public finances and debt, it can be convenient, in some cases, to think about a consolidated public sector balance sheet that sums together the respective assets and liabilities held by the Fed and the federal government. Nevertheless, as noted in an answer to a comment on our earlier post, the Federal Reserve Banks are independent entities, with their own balance sheets, separate from that of the Treasury. There is no authority to consolidate Reserve Bank and Treasury balance sheets.
One might wonder whether the Fed could coordinate with the Treasury and agree to an accounting offset, so that every time the Fed buys a Treasury security, the security is considered “paid in full.” In fact, neither the Board of Governors nor any Reserve Bank is authorized under the Federal Reserve Act to fund the repayment or retirement of a Treasury security; only the Treasury can do so, and it can do so only under the terms under which it issued the security.
Even if it could coordinate with the Treasury and agree to an accounting offset every time it buys a Treasury security, the Fed may prefer to hold on to these assets for future use. Indeed, just like any other entity with Treasury holdings, a Reserve Bank may resell or lend Treasury securities—as the New York Fed does—subject to the Section 14 open market limitation and FOMC directions. But again, a Reserve Bank does not have the authority to fund the payment or retirement of Treasury securities, which are obligations of the U.S. government.
What Happens When a Treasury Security on the Fed’s Balance Sheet Matures?
As discussed in the previous post, when a Treasury security on the Fed’s balance sheet comes due, the Fed can roll over the security or let it mature. A rollover is used if the Fed wants to keep the amount of Treasury securities it holds constant. Reserve Banks do not have the authority to purchase securities directly from the Treasury Department, but they may exchange maturing securities for newly issued securities (so that, on net, no new money is paid to the Treasury). This is how things are done under the current rollover program.
What if the Fed lets the security mature? As is standard in accounting, the payment of principal is not recorded as income (although the payment of interest is). When a Treasury security is paid off, the payment from the Treasury’s General Account at the Fed simply offsets the value of the maturing Treasury security. If the Treasury security was held by an individual, then a new asset—cash—would replace the old asset—the Treasury security—on the asset side of the individual’s balance sheet. This replacement of one asset by another does not represent income.
In the case of the Fed, things are slightly different because a Fed liability, balances in the Treasury General Account, is used to pay off the Treasury security; as a result, both the asset and the liability sides of the Fed’s balance sheet decrease. But, for the same reason stated above, this does not constitute income.
To Sum Up
The way the Fed accounts for changes to its balance sheet depends in part on the structure of the Federal Reserve System and the fact that the Fed is not part of the Treasury. In this post, we have tried to provide more detail on the accounting rules governing transactions that can affect the size of the Fed’s balance sheet.
Disclaimer
The views expressed in this post are those of the authors and do not necessarily reflect the position of the Federal Reserve Bank of New York or the Federal Reserve System. Any errors or omissions are the responsibility of the authors.
XXX . V00000 Beginners' Guide to Financial Statement
The Basics
If you can read a nutrition label or a baseball box score, you can learn to read basic financial statements. If you can follow a recipe or apply for a loan, you can learn basic accounting. The basics aren’t difficult and they aren’t rocket science.
This brochure is designed to help you gain a basic understanding of how to read financial statements. Just as a CPR class teaches you how to perform the basics of cardiac pulmonary resuscitation, this brochure will explain how to read the basic parts of a financial statement. It will not train you to be an accountant (just as a CPR course will not make you a cardiac doctor), but it should give you the confidence to be able to look at a set of financial statements and make sense of them.
Let’s begin by looking at what financial statements do.
“Show me the money!”
We all remember Cuba Gooding Jr.’s immortal line from the movie Jerry Maguire, “Show me the money!” Well, that’s what financial statements do. They show you the money. They show you where a company’s money came from, where it went, and where it is now.There are four main financial statements. They are: (1) balance sheets; (2) income statements; (3) cash flow statements; and (4) statements of shareholders’ equity. Balance sheets show what a company owns and what it owes at a fixed point in time. Income statements show how much money a company made and spent over a period of time. Cash flow statements show the exchange of money between a company and the outside world also over a period of time. The fourth financial statement, called a “statement of shareholders’ equity,” shows changes in the interests of the company’s shareholders over time.
Let’s look at each of the first three financial statements in more detail.
Balance Sheets
A balance sheet provides detailed information about a company’s assets, liabilities and shareholders’ equity.Assets are things that a company owns that have value. This typically means they can either be sold or used by the company to make products or provide services that can be sold. Assets include physical property, such as plants, trucks, equipment and inventory. It also includes things that can’t be touched but nevertheless exist and have value, such as trademarks and patents. And cash itself is an asset. So are investments a company makes.
Liabilities are amounts of money that a company owes to others. This can include all kinds of obligations, like money borrowed from a bank to launch a new product, rent for use of a building, money owed to suppliers for materials, payroll a company owes to its employees, environmental cleanup costs, or taxes owed to the government. Liabilities also include obligations to provide goods or services to customers in the future.
Shareholders’ equity is sometimes called capital or net worth. It’s the money that would be left if a company sold all of its assets and paid off all of its liabilities. This leftover money belongs to the shareholders, or the owners, of the company.
The following formula summarizes what a balance sheet shows: A company's assets have to equal, or "balance," the sum of its liabilities and shareholders' equity. |
Assets are generally listed based on how quickly they will be converted into cash. Current assets are things a company expects to convert to cash within one year. A good example is inventory. Most companies expect to sell their inventory for cash within one year. Noncurrent assets are things a company does not expect to convert to cash within one year or that would take longer than one year to sell. Noncurrent assets include fixed assets. Fixed assets are those assets used to operate the business but that are not available for sale, such as trucks, office furniture and other property.
Liabilities are generally listed based on their due dates. Liabilities are said to be either current or long-term. Current liabilities are obligations a company expects to pay off within the year. Long-term liabilities are obligations due more than one year away.
Shareholders’ equity is the amount owners invested in the company’s stock plus or minus the company’s earnings or losses since inception. Sometimes companies distribute earnings, instead of retaining them. These distributions are called dividends.
A balance sheet shows a snapshot of a company’s assets, liabilities and shareholders’ equity at the end of the reporting period. It does not show the flows into and out of the accounts during the period.
Income Statements
An income statement is a report that shows how much revenue a company earned over a specific time period (usually for a year or some portion of a year). An income statement also shows the costs and expenses associated with earning that revenue. The literal “bottom line” of the statement usually shows the company’s net earnings or losses. This tells you how much the company earned or lost over the period.Income statements also report earnings per share (or “EPS”). This calculation tells you how much money shareholders would receive if the company decided to distribute all of the net earnings for the period. (Companies almost never distribute all of their earnings. Usually they reinvest them in the business.)
To understand how income statements are set up, think of them as a set of stairs. You start at the top with the total amount of sales made during the accounting period. Then you go down, one step at a time. At each step, you make a deduction for certain costs or other operating expenses associated with earning the revenue. At the bottom of the stairs, after deducting all of the expenses, you learn how much the company actually earned or lost during the accounting period. People often call this “the bottom line.”
At the top of the income statement is the total amount of money brought in from sales of products or services. This top line is often referred to as gross revenues or sales. It’s called “gross” because expenses have not been deducted from it yet. So the number is “gross” or unrefined.
The next line is money the company doesn’t expect to collect on certain sales. This could be due, for example, to sales discounts or merchandise returns.
When you subtract the returns and allowances from the gross revenues, you arrive at the company’s net revenues. It’s called “net” because, if you can imagine a net, these revenues are left in the net after the deductions for returns and allowances have come out.
Moving down the stairs from the net revenue line, there are several lines that represent various kinds of operating expenses. Although these lines can be reported in various orders, the next line after net revenues typically shows the costs of the sales. This number tells you the amount of money the company spent to produce the goods or services it sold during the accounting period.
The next line subtracts the costs of sales from the net revenues to arrive at a subtotal called “gross profit” or sometimes “gross margin.” It’s considered “gross” because there are certain expenses that haven’t been deducted from it yet.
The next section deals with operating expenses. These are expenses that go toward supporting a company’s operations for a given period – for example, salaries of administrative personnel and costs of researching new products. Marketing expenses are another example. Operating expenses are different from “costs of sales,” which were deducted above, because operating expenses cannot be linked directly to the production of the products or services being sold.
Depreciation is also deducted from gross profit. Depreciation takes into account the wear and tear on some assets, such as machinery, tools and furniture, which are used over the long term. Companies spread the cost of these assets over the periods they are used. This process of spreading these costs is called depreciation or amortization. The “charge” for using these assets during the period is a fraction of the original cost of the assets.
After all operating expenses are deducted from gross profit, you arrive at operating profit before interest and income tax expenses. This is often called “income from operations.”
Next companies must account for interest income and interest expense. Interest income is the money companies make from keeping their cash in interest-bearing savings accounts, money market funds and the like. On the other hand, interest expense is the money companies paid in interest for money they borrow. Some income statements show interest income and interest expense separately. Some income statements combine the two numbers. The interest income and expense are then added or subtracted from the operating profits to arrive at operating profit before income tax.
Finally, income tax is deducted and you arrive at the bottom line: net profit or net losses. (Net profit is also called net income or net earnings.) This tells you how much the company actually earned or lost during the accounting period. Did the company make a profit or did it lose money?
Earnings Per Share or EPS
Most income statements include a calculation of earnings per share or EPS. This calculation tells you how much money shareholders would receive for each share of stock they own if the company distributed all of its net income for the period.To calculate EPS, you take the total net income and divide it by the number of outstanding shares of the company.
Cash Flow Statements
Cash flow statements report a company’s inflows and outflows of cash. This is important because a company needs to have enough cash on hand to pay its expenses and purchase assets. While an income statement can tell you whether a company made a profit, a cash flow statement can tell you whether the company generated cash.A cash flow statement shows changes over time rather than absolute dollar amounts at a point in time. It uses and reorders the information from a company’s balance sheet and income statement.
The bottom line of the cash flow statement shows the net increase or decrease in cash for the period. Generally, cash flow statements are divided into three main parts. Each part reviews the cash flow from one of three types of activities: (1) operating activities; (2) investing activities; and (3) financing activities.
Operating Activities
The first part of a cash flow statement analyzes a company’s cash flow from net income or losses. For most companies, this section of the cash flow statement reconciles the net income (as shown on the income statement) to the actual cash the company received from or used in its operating activities. To do this, it adjusts net income for any non-cash items (such as adding back depreciation expenses) and adjusts for any cash that was used or provided by other operating assets and liabilities.Investing Activities
The second part of a cash flow statement shows the cash flow from all investing activities, which generally include purchases or sales of long-term assets, such as property, plant and equipment, as well as investment securities. If a company buys a piece of machinery, the cash flow statement would reflect this activity as a cash outflow from investing activities because it used cash. If the company decided to sell off some investments from an investment portfolio, the proceeds from the sales would show up as a cash inflow from investing activities because it provided cash.Financing Activities
The third part of a cash flow statement shows the cash flow from all financing activities. Typical sources of cash flow include cash raised by selling stocks and bonds or borrowing from banks. Likewise, paying back a bank loan would show up as a use of cash flow.Read the Footnotes
A horse called “Read The Footnotes” ran in the 2004 Kentucky Derby. He finished seventh, but if he had won, it would have been a victory for financial literacy proponents everywhere. It’s so important to read the footnotes. The footnotes to financial statements are packed with information. Here are some of the highlights:- Significant accounting policies and practices – Companies are required to disclose the accounting policies that are most important to the portrayal of the company’s financial condition and results. These often require management’s most difficult, subjective or complex judgments.
- Income taxes – The footnotes provide detailed information about the company’s current and deferred income taxes. The information is broken down by level – federal, state, local and/or foreign, and the main items that affect the company’s effective tax rate are described.
- Pension plans and other retirement programs – The footnotes discuss the company’s pension plans and other retirement or post-employment benefit programs. The notes contain specific information about the assets and costs of these programs, and indicate whether and by how much the plans are over- or under-funded.
- Stock options – The notes also contain information about stock options granted to officers and employees, including the method of accounting for stock-based compensation and the effect of the method on reported results.
Read the MD&A
You can find a narrative explanation of a company’s financial performance in a section of the quarterly or annual report entitled, “Management’s Discussion and Analysis of Financial Condition and Results of Operations.” MD&A is management’s opportunity to provide investors with its view of the financial performance and condition of the company. It’s management’s opportunity to tell investors what the financial statements show and do not show, as well as important trends and risks that have shaped the past or are reasonably likely to shape the company’s future.The SEC’s rules governing MD&A require disclosure about trends, events or uncertainties known to management that would have a material impact on reported financial information. The purpose of MD&A is to provide investors with information that the company’s management believes to be necessary to an understanding of its financial condition, changes in financial condition and results of operations. It is intended to help investors to see the company through the eyes of management. It is also intended to provide context for the financial statements and information about the company’s earnings and cash flows.
Financial Statement Ratios and Calculations
You’ve probably heard people banter around phrases like “P/E ratio,” “current ratio” and “operating margin.” But what do these terms mean and why don’t they show up on financial statements? Listed below are just some of the many ratios that investors calculate from information on financial statements and then use to evaluate a company. As a general rule, desirable ratios vary by industry.If a company has a debt-to-equity ratio of 2 to 1, it means that the company has two dollars of debt to every one dollar shareholders invest in the company. In other words, the company is taking on debt at twice the rate that its owners are investing in the company.
Inventory Turnover Ratio = Cost of Sales / Average Inventory for the PeriodIf a company has an inventory turnover ratio of 2 to 1, it means that the company’s inventory turned over twice in the reporting period.
Operating Margin = Income from Operations / Net RevenuesOperating margin is usually expressed as a percentage. It shows, for each dollar of sales, what percentage was profit.
P/E Ratio = Price per share / Earnings per shareIf a company’s stock is selling at $20 per share and the company is earning $2 per share, then the company’s P/E Ratio is 10 to 1. The company’s stock is selling at 10 times its earnings.
Working Capital = Current Assets – Current Liabilities
- Debt-to-equity ratio compares a company’s total debt to shareholders’ equity. Both of these numbers can be found on a company’s balance sheet. To calculate debt-to-equity ratio, you divide a company’s total liabilities by its shareholder equity, or
- Inventory turnover ratio compares a company’s cost of sales on its income statement with its average inventory balance for the period. To calculate the average inventory balance for the period, look at the inventory numbers listed on the balance sheet. Take the balance listed for the period of the report and add it to the balance listed for the previous comparable period, and then divide by two. (Remember that balance sheets are snapshots in time. So the inventory balance for the previous period is the beginning balance for the current period, and the inventory balance for the current period is the ending balance.) To calculate the inventory turnover ratio, you divide a company’s cost of sales (just below the net revenues on the income statement) by the average inventory for the period, or
- Operating margin compares a company’s operating income to net revenues. Both of these numbers can be found on a company’s income statement. To calculate operating margin, you divide a company’s income from operations (before interest and income tax expenses) by its net revenues, or
- P/E ratio compares a company’s common stock price with its earnings per share. To calculate a company’s P/E ratio, you divide a company’s stock price by its earnings per share, or
- Working capital is the money leftover if a company paid its current liabilities (that is, its debts due within one-year of the date of the balance sheet) from its current assets
XXX . V000000 From asset to liability
The shifting shape of bank balance-sheets
Illustration 
THE dirty secret of the golden age of finance was that it was obscenely easy to make money. The supply of credit was seemingly inexhaustible, so banks could fund their expansion at will. Demand was equally insatiable, providing those infamously complex structured products with a stream of ready buyers. The years of plenty disastrously skewed risk models, allowing banks to run with lower capital on the assumption that past performance was, contrary to the industry's standard advice, a guide to future returns. And the theory that risk had been dispersed because of securitisation added to the false sense of security. The result for many banks was a strategy of expanding their balance-sheets by writing more and more loans and holding ever more securities. With risk low, liquidity ubiquitous and many institutions under fire for appearing to be overcapitalised, there seemed to be little cost to growth. “If we could have an infinite balance-sheet for a penny return, we were going to take it,” says a Wall Street veteran.
Things are somewhat different now. If boardroom discussion in the past decade revolved around the asset side of the balance-sheet, the next decade will see managers focusing on the liabilities side—the amount and quality of capital they hold to protect against losses, and the duration and sources of their funding. Banks will go from being unconstrained by their balance-sheets to being caged by them.
Start with capital, which has suddenly become the industry's scarce resource. That is particularly true today as the prospect of further losses continues to unnerve private investors. But it will remain true after the immediate crisis has eased. The amount of capital that banks have to hold will go up, and not just because their regulators want them to have a bigger buffer against losses.
The risk weightings on assets are rising as the effects of the downturn feed through into banks' risk models, forcing them to set aside more capital. Bondholders want a greater cushion beneath them in the capital structure to protect them against losses. Shareholders too are belatedly happy to trade higher returns on equity for a reduced chance of being wiped out. So banks with more equity capital are now valued more highly by the market. Between 2000 and 2007 there was no correlation between equity-capital ratios and the total return on banks' shares, says Mr Varley of Barclays. “Now the correlation is meaningful.”
The amount of capital banks hold is not the only thing under scrutiny. They also need to have the right kind. Their capital is a mix of common equity, which is first in line when losses strike, and various other instruments, often hybrids of equity and debt. A gradual pre-crisis increase in the proportion of this sort of capital has accelerated rapidly in recent months, as common equity has been eaten up by losses and governments have largely filled the gap with preferred shares, which helps to avoid nationalisation.
The curious effect of this changing capital mix has been to bolster banks' overall capital bases while disturbing shareholders, who see common equity as the only dependable bulwark against losses. Thus banks with less of it have been punished by the markets. “It turns out that hybrids don't have much loss-absorbing capacity and are not much use in a period of stress,” concludes Mr Ramsden of Goldman Sachs. That realisation helps to explain why American commercial banks, despite appearing well capitalised compared with their European peers ahead of the crisis, have still had a capital problem. It also helps to explain the banks' rush to buy back hybrid debt at discounted prices: they can book the gains as profits and use these to beef up capital where it counts.
Holders of hybrid instruments, as well as of other forms of junior debt, have been given their own reasons to reflect. The British government's decision in February to amend the terms of subordinated debt issued by Bradford & Bingley, a nationalised bank, spooked European markets, for example. Bondholders were locked in when Deutsche Bank decided in December not to redeem a €1 billion ($1.3 billion) subordinated bond at its first opportunity. John Raymond of CreditSights, a research firm, says investors used to like buying debt lower down banks' capital structure because they thought its higher yield overcompensated for a marginal increase in risk. Now their thinking has changed.
Senior debtholders, who rank first in the hierarchy of unsecured creditors if a bank is liquidated, have less to worry about. In general regulators have stuck to the standard script of bank bail-outs, in which shareholders take the pain and bondholders are protected. And a bigger equity cushion should help to reduce the cost of debt by counteracting fears that debtholders are too exposed to losses.
Bank debt of all kinds will nevertheless be perceived as more risky after this crisis. Investors will not soon forget Washington Mutual's failure last September, when assets and deposits of the Seattle-based thrift were transferred to JPMorgan Chase but its creditors were left high and dry. Even in countries that do not formally prioritise depositors over other creditors, as America does, the political necessity of reimbursing taxpayers before anyone else has become crystal clear. Thanks to Iceland's crisis the creditworthiness of banks will also be far more closely tied to the creditworthiness of the countries in which they are headquartered.
The primary effect of all these changes will be to make it more expensive to expand the balance-sheet. Scared bank shareholders will now demand a higher risk premium, as will debtholders. Competition for capital and safer forms of debt will be greater, as investors demand fortress-like balance-sheets. And equity will go less far in a world where banks are more constrained in the amount of assets they can support with each unit of capital.
All this in turn will lead banks to think harder about where they deploy capital. Executives will ask tough questions about activities that absorb lots of capital but have lower returns now that leverage is lower, the risks are clearer and cost of funding is higher. “Some banks' balance-sheets could be expanded indefinitely in the past,” says Paul Calello, the boss of Credit Suisse's investment bank. “Now that capital is more scarce the banks have to be even more efficient in their balance-sheet and capital usage to maximise profitability.” Dedicated proprietary-trading desks, where a group of traders put the bank's own capital at risk, look much less attractive in this changed environment, for example. The advantages of running such desks have largely gone, says Bill Winters of JPMorgan Chase's investment bank.
Finer judgments about the liquidity of assets will also come into play. When markets are less liquid, assets stay on the balance-sheets for longer. That exposes institutions to greater risk and ties up capital that could be better deployed elsewhere. Credit Suisse is planning to continue to operate in American residential mortgage-backed securities (RMBS), for example, where markets are deeper and more liquid, but exit the sludgier European RMBS market, where the bank is forced to hold assets for longer.
Businesses that throw off plenty of earnings without absorbing much capital or running great risks are naturally in demand. Take the advisory businesses of investment banking, an area in which plenty of boutiques make a decent living without having a balance-sheet at all. Or custody businesses, where banks look after the assets of other financial institutions. Or asset management, where someone else's money is at risk. The two remaining independent investment banks, Goldman Sachs and Morgan Stanley, have both signalled greater emphasis on less capital-intensive businesses.
Debt dilemmas
Capital is not the only bit of the balance-sheet that will get a lot more attention in future. Executives (and regulators) will also focus more on the funding profile of their businesses in light of the crisis, as the costs of borrowing rise, lenders demand greater security and keener awareness of liquidity risk informs behaviour.
They will pay greater attention, for example, to whether assets can be used as collateral for further borrowing. Huw van Steenis, an analyst at Morgan Stanley, says banks will divide activities between those generating collateral that can be placed with central banks (high-quality mortgages, for example) or is otherwise decent enough to be used as security (shares, say), and those that do not throw off any collateral at all and therefore consume unsecured funding. The cost and scarcity of this type of funding means that these businesses—equity underwriting is an example—will command higher margins.
Above all, banks will have a deeper awareness of funding risk—their ability to roll over debts as they come due. Institutions that keenly exploited the pricing differences between long-term assets and short-term liabilities paid heavily when liquidity dried up and they were unable to refinance fast-maturing debts or sell the assets that they held.
To be more precise, the weakness revealed by this crisis has been in short-term wholesale funding, which rolls over quickly but does not have the government-backed guarantees that help to keep retail depositors quiescent. This type of funding has been at the heart of the crisis.
Many subprime mortgage-backed securities were held in off-balance-sheet vehicles that funded themselves by issuing short-dated, asset-backed commercial paper to money-market funds and other investors. When those funds suddenly stopped buying paper, the banks' liquidity lines to these vehicles abruptly came into force. Similarly, the amount of funding that investment banks were doing through overnight repo agreements surged between 2004 and 2007; they were rolling over one-quarter of their balance-sheets every day prior to the crisis, making them vulnerable to a sudden loss of confidence.
Short-term wholesale funding also helped to sink Northern Rock, one of the earliest victims of the crisis. The bank's failure in September 2007 is indelibly associated with images of Britain's first retail bank run since 1866 and is often blamed on its enthusiastic use of securitisation to expand its mortgage book. Yet a 2008 paper by Hyun Song Shin of Princeton University, dissecting the bank's implosion, suggests that neither the run nor securitisation was the principal culprit.
Faced with this stress fracture in their funding structures, banks have two obvious ways to respond. The first is to lengthen the maturity of the wholesale debts that they have. Some institutions have less far to go than others: the unsecured debt of Goldman Sachs already boasts an average maturity of eight years, for instance. But when markets get back to normal, funding maturities are likely to rise.
There are limits to issuance of longer-dated liabilities. A big rise in the proportion of long-term bond funding across the industry is bound to be costly, especially since banks will have to compete to attract interest from bond investors who already have exposure to many of these institutions anyway. Securitisation markets are badly damaged
The second option, and the more important shift, is for banks to increase their dependence on more stable deposits. The most dramatic volte-face has been that of the surviving investment banks, Goldman Sachs and Morgan Stanley, which became bank holding companies in September, making it easier for them to take deposits.
Retail-bank bosses who had financed loan growth by tapping wholesale sources of funding are now targeting lower LDRs. Before it was snapped up by Lloyds TSB, HBOS, another stricken British lender, was trying to dispose of businesses that were dependent on wholesale funds and therefore increased the group's LDR. Many banks have now imposed limits on asset growth, requiring that loans do not expand more quickly than deposits.
A perennial industry debate, on the merits of bank branches versus other customer channels, has been given fresh piquancy by this need to gather in deposits—and the branch is likely to emerge strengthened. Studies consistently suggest that branch networks with a strong local presence are the most effective way to win deposits. Mr Shin's analysis of Northern Rock contains some fascinating detail on the retail-deposit run. Despite those snaking queues, customers with branch-based accounts were stickier than many others. Online account-holders fled in roughly similar proportions to branch customers. Holders of postal accounts and offshore accounts were flightier.
In truth, banks need to have a diverse set of funding sources and maturities, whether wholesale or retail. Relying on deposits alone still entails risk. Deposits can be withdrawn at a moment's notice, after all, and government guarantees do not stop depositors from discriminating between institutions: companies and individuals alike want to avoid the hassle of having to retrieve deposits from a failed bank.
=== MA TO THEOS ELECTRONIC LOCKER BALANCE SHEET AT e-MONEY MATIC ===
